
This piece is a work in progress, so I solicit your feedback on it. How could it be improved?
=-=-=-=-=-=-=-=-=-=-=-=-=-=-=-=-=-=-=-=-=-=-=-=-=-=-=-=-=-=-=-=-=-=-=-=-=-=-=-=-=-
I enjoy it when my expectations are proven wrong, because it means that I learned something in the process. When I began preparation for this post (which will probably have two parts, because I am having difficulty posting files, tables and pictures at my blog), I expected to write a post that would conclude that the PEG ratio (P/E divided by the anticipated growth rate expressed as an integer) is a nifty market artifact, but had no sound theoretical grounding.
The answer to the question in my title is complex. The answers are No, Sometimes, and Yes.
- If you?re a deep value investor: No.
- If you?re a moderate value or core investor: Sometimes.
- If you?re a fundamentally-driven moderate growth investor: Yes.
- If you?re an aggressive growth investor: No.
When I did my earlier post on my version of the Fed Model, I began by showing that it was a simplification of the simple version of the dividend discount model [DDM], which states that the value of a stock is equal to the present value of its future dividends. I?m going to do the same thing here with a few changes:
? I can?t prove what I am stating analytically, that is, by manipulating equations. I?m going to do it through scenario analysis and regression.
? My piece on my Fed model used the simple DDM. This piece uses a three-stage DDM. The stages are growth, transition, and maturity. For those with access to a Bloomberg Terminal, my implementation is a more conservative version of what they did.
Three-Stage DDM Assumptions
- ? Initial forecast earnings (E1)
- ? Initial dividend payout ratio as a portion of earnings (PR1)
- ? Growth rate of earnings in the first phase of the model (g)
- ? Length of the first phase (5 years)
- ? Length of the second transition phase (6 years)
- ? Ultimate earnings growth rate in maturity (6%)
- ? Ultimate payout ratio in maturity (50%)
- ? Discount rate for the dividend stream (ks), otherwise known as the required rate of return (i.e., what does an investor have to expect to earn in order to get him to part with his cash?)
In brief, in the first phase of the model, earnings grow at a rapid rate, and dividends are paid at a relatively low rate, in the second (transition) phase, the earnings growth and dividend payout rates grade linearly into the rates of the ultimate phase. The resulting dividend stream gets discounted at a discount rate reflecting the riskiness of the company.
Limitations of the Model
- ? It is difficult to forecast earnings for next year, much less give a growth rate for the next 5 years. I use sell side estimates as an initial jumping off point.
- ? Companies grow erratically.
- ? The maturation of a company is rarely so linear.
- ? The lengths of the first two phases are somewhat arbitrary, though the sell side typically does 5-year growth rates.
- ? A 6% growth rate in maturity is consistent with long term nominal GDP growth, but it is still quite an assumption.
- ? Payout rates and growth rates should be inversely correlated. To the extent that capital constrains business growth, a higher rate of dividend payout should result in a lower earnings growth rate.
- ? The discount rate is difficult to calculate. Theoretically, it should be 2-3% percent higher than the highest yield on the longest, most subordinated debt or preferred of the company. If a company has no debt, compare it to the yields of bonds of other companies with similar put option implied volatility 20% or more out of the money. Then add 2-3% to those yields.
- ? Payout rates and the discount rate should be negatively correlated. Companies with high payout rates will be judged to be less risky most of the time, and vice-versa.
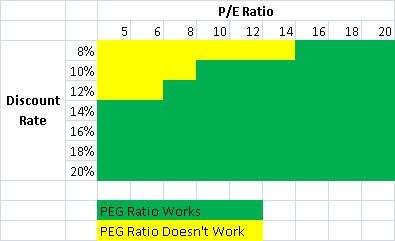
All that said, the DDM is a model, and a richer model than the PEG ratio. My question became, ?Are there conditions where the results of the DDM resemble a PEG ratio?? The answer to that is yes, when:
- The discount rate is 14% or lower
- At lower discount rates, only for higher P/Es. For example at a discount rate of 8%, the PEG ratio works for P/Es 16 and higher.
Now I oversimplified my conclusions here. Look at this graphic:
Or, based off of that, consider this graph, which shows the PEG hurdle rates as a function of initial P/Es. and cost of capital (discount) rates:
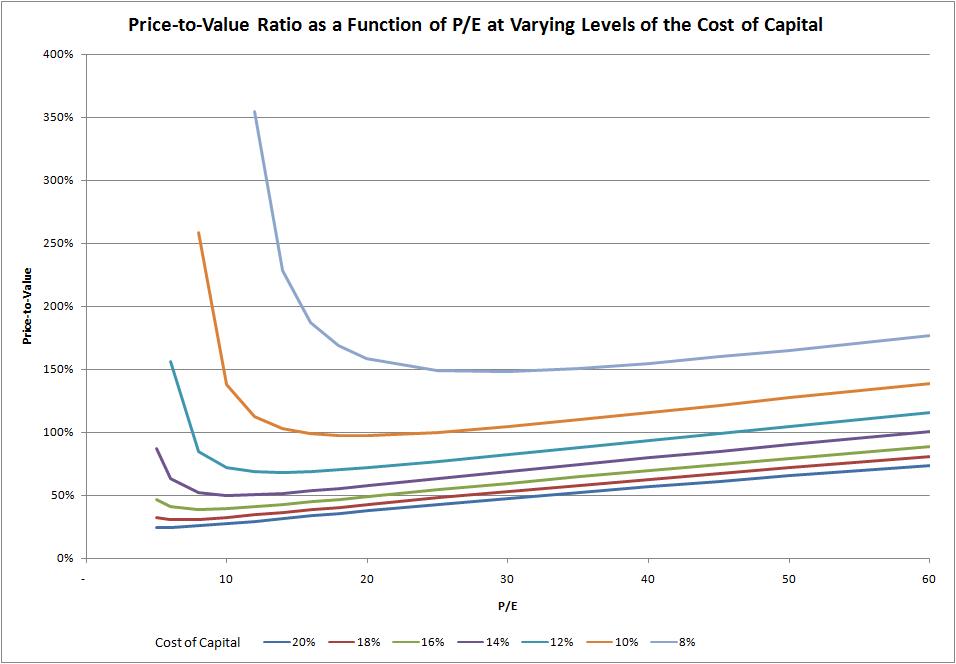
How did I come to this result? For differing levels of the discount rate, I varied P/E levels, calculating the initial phase growth rate that would make price equal to value in the DDM. Those P/E and growth levels gave me the PEG ratios. Those PEG ratios were often quite flat for higher P/Es at a given level of the discount rate of 14% or below. There is usually a bit of a smile or smirk, but you can see an average level.
At 16% or higher levels of the discount rate, the PEG ratio falls apart. At low levels of P/E the required PEG ratio should be low. At high levels of P/E, the required PEG ratio can be higher. The intuition here is that situations with high discount rates, and thus high risk, require high growth to fuel value in a DDM calculation.
At low discount rates, and low P/Es, the DDM says that value investors don?t need much growth at all in order to buy good values. If one considers the inverse of the P/E, the E/P, or earnings yield, when it is greater than the discount rate, it is hard to lose money, even when earnings don?t grow. Even more so when the dividend yield exceeds or is near the discount rate.
A Formula for the PEG Ratio Hurdle
Taking the average PEG hurdle rates for P/Es 16 and above, where price equaled DDM Value, for various discount and payout rates, I calculated a regression to give a more general PEG hurdle rate formula. The factors appeared multiplicative, so I used a formula that looked like this:
ln ( average PEG hurdle) = a + b * ln(discount rate) + c * ln(payout rate) + e (error term)
The regression had an adjusted R-squared of 98%, with all coefficients statistically significant at prob-values of 99% or better. a was 7.8646, b was -1.3169 and c was .0752. In summary form, the formula looks like this:
Average PEG hurdle = 26.03 * discount rate-1.3169 * payout rate0.0752
Pretty good, but after a little while, I asked if I could create a formula that better represented the curves in graph 2. So, I ran the following regression:
ln (PEG hurdle) = a + b * ln(discount rate) + c * ln(payout rate) + d * ln(P/E) + e (error term)
I had a debate as to how to censor the data. I threw out data points with negative PEG hurdles in the first analysis. In the second one, I threw out negative PEG hurdles, and PEG hurdles over 2.0x. On the second analysis, my reasoning was that if PEG hurdles over 2.0 are acceptable, we?re in weird times. Now perhaps that pre-judges the situation, but the right functional form for graph 2 eludes me here. Personally, I would use the second formula here:
Formula 1: Average PEG hurdle = 0.01823 * discount rate-1.6279 * payout rate0.1039 * PE Ratio0.1893
Formula 2: Average PEG hurdle = 0.02035 * discount rate-1.4215 * payout rate0.0941 * PE Ratio0.2704
Formula 1 has an R-squared of 76%, and with 2 it is 88%. The t-statistics are all significant at 99% levels.
Now, suppose I am a growth investor and I decide to apply formula 2. I look for stocks with PE ratios of around 20, my discount rate is 15%, and the dividend payout rate is around 10%. What annual earnings growth should I be looking for over the next 5 years? The formula says 36.6%. Pretty aggressive. At a discount rate of 12%, the growth rate drops to 26.6%.
What this points out in a way is the difficulty of making consistent money in growth stocks. The earnings growth rates needed to make money in excess of the discount rate on average over time is higher than most growth investors realize.
Growth investors overpay for growth. That is one of the reasons that I am a value investor.
One final note: Jim Cramer has a limit for what he is willing to pay for growth stocks ? a PEG ratio of 2.0x. Now, he?s a bright guy, so there are two ways that I can interpret this. 1) Since momentum plays a large role in Cramer?s investing, the 2.0x ceiling limits his risk while he plays momentum. Or, 2) he has longer periods of competitive advantage and transition than I do. I favor the first interpretation, because it is rare in my opinion that growth investors should pay over 1.5 times the growth rate for any investment, unless the barriers to entry are significant.
Summary
PEG ratios work for core and growth investors, but the PEG ratio hurdles needed for investment are lower than most investors think, so long as the expected rate of return (discount rate) is high.? As for me, I will stick with value investing, where the need for earnings growth is negligible.
You could actually try backtesting the PEG as a trading criterion ….
Morningstar’s screener calculates the “PEG payback period” as the number of years to earn the current market cap assuming linear growth. That could be improved by using some sort of profile growth curve (as you’ve done) and figuring the time to earn the current enterprise value instead. This might be a better number for value investor comparisons. My impression of most growth investors is that rather than hoping to make money by having their stock grow into a value stock, they are hoping to make money by buying stocks that stretch out the profile – i.e. they are looking for a “margin in safety” in the number of years of higher growth that are expected going forward.
Here are the results of holding the 30 largest (by market cap) stocks in the S&P 500 when they have PEG under 1.00 and price over $5.
http://keelix.com/backtester/auth/displayjob.tt?id=204957
Switch out monthly.
Returns DOUBLE the S&P 500’s annualized gain since Aug 1997, with only a 50% increase in annual standard deviation.