Day: May 6, 2008

What is Liquidity? (Part II)

What is Liquidity? (Part II)

Liquidity is like water. Is water a solid, a liquid, or a gas? Depending on the situation, water can be any or all of the three. When I started my blog, my first serious post was “What is Liquidity?” Given what was about to happen in Shanghai seven days later, and what that would do to liquidity, the post was ahead of its time.

Yesterday I saw two posts on liquidity:

Both had a number of good points, though I like my piece better.? Let me borrow from Peter Bernstein, where he said something to the effect of “Liquidity is the ability to have a do-over.”? In other words, if you make an investment mistake, how much does it cost you to reverse it?

The three aspects of liquidity:

  • What sort of premium does it take to get someone to lock into a long-term commitment?
  • Slack assets available for deployment into new investments, and
  • Bid-ask spreads

are correlated.? When there are few slack assets relative to investment needs, large premiums have to be offered to get investors to lock into a long-term investment, and bid-ask spreads tend to be wide as well.

But let’s consider the flip side of liquidity.? Liquidity is akin to holding a long option.? Rising volatility is the friend of one who has liquidity or a long option.? But, being long an option means someone else is short an option.? Having liquidity means that someone else has to provide cash should you choose to buy something.? If you liquidate shares in a money market fund, cash must come either from new investors in the fund who take your spot, or the fund has to raise liquidity internally, handing you some of the proceeds from not entering into an overnight loan.

Or, consider the bid-ask spread in stocks, or other securities.? When the bid-ask spread is tight, it means that the market maker (or specialist), is comfortable that short-term volatility is low enough, that he will be able to profit from the tight spread on average.? When there is severe uncertainty, as there often is in esoteric fixed income instruments during a panic period, the bid-ask spread disappears, and one is reduced to “price discovery, using a broker who is discreet about your intentions regarding buying or selling.? (My, but I got good at that during 2001-2003. ? Ouch.)

I like my definition of liquidity, which is the willingness (price) to enter into or exit fixed commitments.? It covers all three aspects of liquidity, and helps explain why they are usually different manifestations of the same phenomenon.

As for now, versus mid-February 2007, the willingness to enter into fixed commitments has declined markedly, even though it has improved over the last seven weeks.? That is no guarantee that it will continue to improve linearly.? Bear markets have their rallies, and this current rally has been a good one.? It would be rare to have such a short bear market, or one that ended without clearing away most of the prior excess lending problems.? We still have a lot of wood to chop there.

Year-over-year Non-farm Payrolls

Year-over-year Non-farm Payrolls

I tried forecasting the non-farm payrolls number when I first came to RealMoney — after all, what other number made as big of a splash? I seemed to do well at it for a while, and then badly, and then I really began to dig in to how the number was calculated. The more I dug into it, the more I concluded that I could not forecast it. Not that it is wrong, made up, whatever. I just could not forecast it, so I gave up.

Not that I like being a quitter, but there are benefits to recognizing reality and respecting it.? I did learn some things along the way, though, and let me explain them:

1) The 12-month change for the seasonally adjusted [SA] and non-seasonally adjusted [NSA] numbers are equal.

2) The seasonal adjustment is more than just an adjustment for seasonality.? There is a distinct annual pattern to the NSA data, and I have done my own seasonal adjustments and they do not reduce that variability nearly as much as the BLS methods which involve ARIMA models.? (As one of my econometrics professors used to say to me, “Practitioners use ARIMA models when they have no idea of what the true model might be.? It’s just a hunt for correlations.”)

In other words, the SA data is not just adjusted for seasonality, but it is smoothed as well.? Now, as an actuary, I can get into smoothing.? We do that all the time when theory would dictate smoothness, as in mortality table construction.? But here the smoothing is opaque to me, and presumes that changes to employment levels happen slowly.? I’m not sure that always holds.

Think of it this way — the SA figures always contain a pad/buffer/fudge factor, whether positive or negative, that gets amortized into future changes in employment.? A particularly large change in the NSA figures will tend to lead to the SA figures changing in the same direction for a little while (or, in some cases, they revise prior months). For what it is worth, I think the pad is small at present.

3) You can’t easily disaggregate the birth/death [B/D] adjustment from the SA figures, because the SA figures come about like this:

  • Calculate the raw NSA figure
  • Add the B/D adjustment
  • perform the seasonal adjustment (and smoothing)

4) The B/D adjustment works sort of like this: estimate the amount of jobs that the economy will add from new businesses that are outside of our survey for the next year.? Add those jobs in using a pattern that reflects our estimate of when businesses add jobs on net.

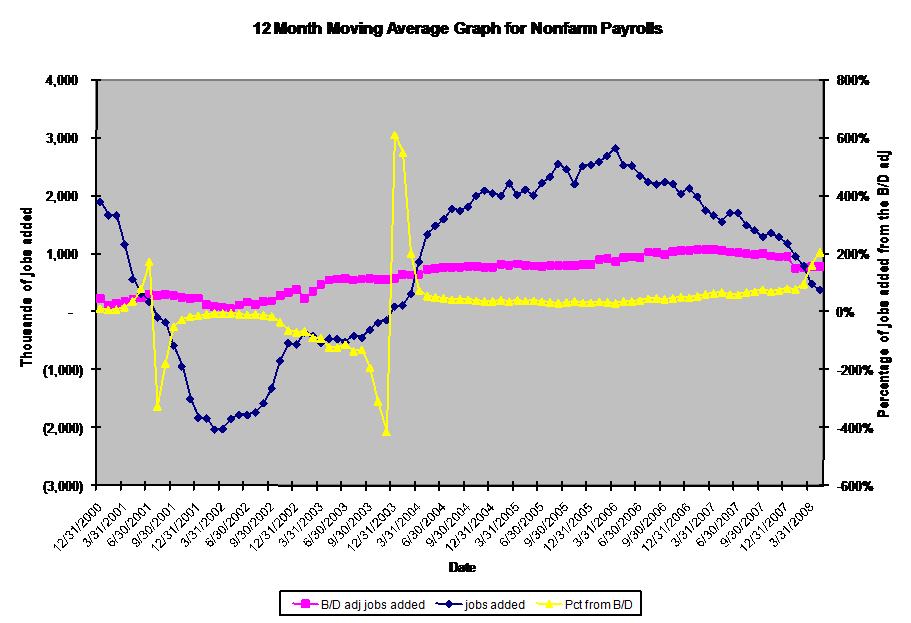
5) Now, back to the graph at the top of this page.? The blue line is the number of net jobs added over the prior 12 months.? It doesn’t matter whether I use the NSA or SA figures, because over 12 months, they are the same.? The magenta line indicates the number of jobs added by the B/D adjustment over the prior 12 months.

Because I am doing a year-over-year comparison, I escape the problems associated with the seasonal adjustment, and this fairly disaggregates the B/D adjustment.? The yellow line is the proportion of net new jobs coming from the B/D adjustment.? Over the life of the B/D adjustment (since 1/1/2000), the B/D adjustment has made up 82% of all new jobs created.

6) At present, the B/D adjustment is running at an annualized 750-800 thousand jobs per year.? I don’t know if that is right or wrong, but since 2004, it has been near that level.? Recently, non-farm payroll numbers and the B/D adjustment have been declining, but the B/D adjustment has been declining more slowly.?? The B/D adjustment accounts for more than 100% of jobs added over the past twelve months.? That’s not necessarily wrong, but the B/D adjustment does move slowly.

7) I’ve tried to be as neutral as possible here.? Two of my favorite bloggers, Dr. Jeff Miller, and Barry Ritholtz, are on opposite sides of this argument.? I put this out as data for discussion; I am not taking a stand because I can’t vet out the estimates of job creation from the birth/death adjustment.? They could be high, low, or just right.? In a slowdown, perhaps they should be off more, but the global economy is still strong, supporting jobs in some cyclical sectors.

Theme: Overlay by Kaira