Two Updates
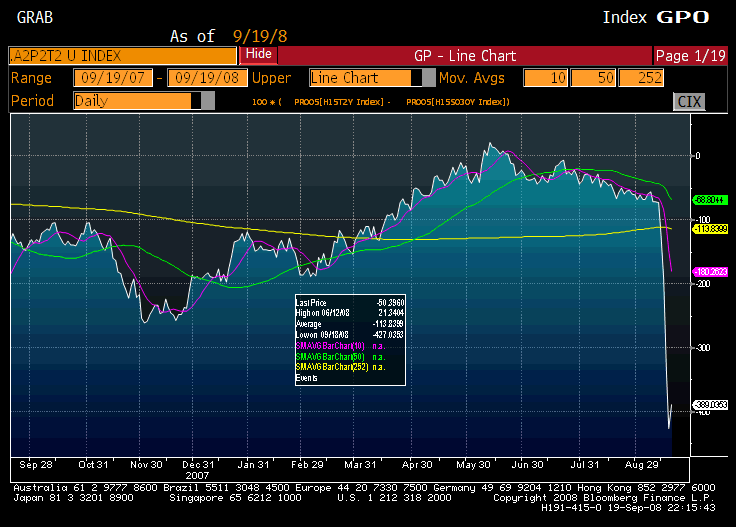
I want to update my two Thursday evening pieces.? First with respect to Liquidity for the Government and no Liquidity for Anyone Else, the degree of financial stress in the short-term part of the market is worse.? Here’s the graph:
Much as the government wants to eliminate stress in the lending markets, I don’t think they are succeeding.? The little bounce still leaves the indicator below Thursday’s close.
One reader brought up the timing mismatch in this indicator, because I have a 2-year Treasury versus a 90-day commercial paper series.? I use the 2-year Treasury, because it is very sensitive to changes in expectations for short-term interest rates.? I suppose I could use 3-month T-bills to match, but this indicator arose out of comparing two different series that change in opposite directions when the economy strengthens or weakens.
Part 2
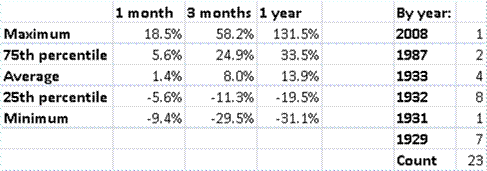
Now for my article Now We?re Talking Volatility.? Okay, so we had three 4% moves in a five business day period, well, now you have four of them.? Now how do the statistics look?
Oddly, after four 4% events in five days the average return is lower than that for three 4% days.? Most of the history here comes from the Great Depression, and we are dealing with the “Law of Small Numbers” here, so I am not inclined to offer definitive analysis here.? I will give you my guess, though.? Extreme volatility often begets an opportunity for profit, but also sometimes begets significant future losses.? I lean toward the profit side here in the short run, but I also realize that the actions of the US Government might not be the best for the markets, even if the markets have interpreted it positively in the short run.
I would be neutral-to-positive on the US equity market here.? The presidential cycle is a positive, as is the current market volatility.? Given the difficulties with financials, I can’t get very positive, though.? Play defense, wherever you are.


