
Time for another break from “All crisis, all of the time.”? I have long been fascinated by momentum anomalies, and this is an initial attempt to under stand them better.? My contentions have been that:
- Sharp moves mean-revert, gradual moves persist.
- In the short-run momentum persists, in the intermediate-term, it mean-reverts, and in the long-run, oddly, it persists.
Let’s see how well my default views stack up against the evidence.? I used Professor Shiller’s augmented S&P 500 data from 1871 to mid-2008 to ask the following question: given the performance of the last year and the last month, what can that tell us about the likely returns for the next year and next month?
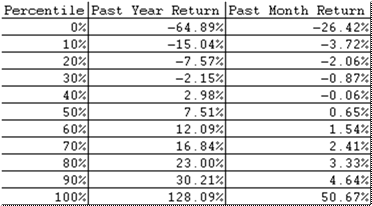
I divided performance into ten deciles for the past year and the past month.? Here are the monthly and annual returns by decile:
For purposes of completeness, I also calculated the number of observations by decile:
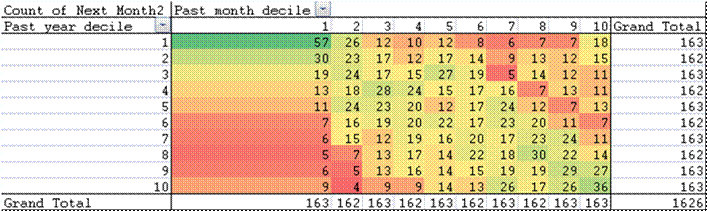
Note the correlation.? The main diagonal elements support the idea that monthly and yearly returns are correlated.? Not too surprising.
Returns Over the Next Year
So, how do returns over the next year relate to returns over the last month and year?
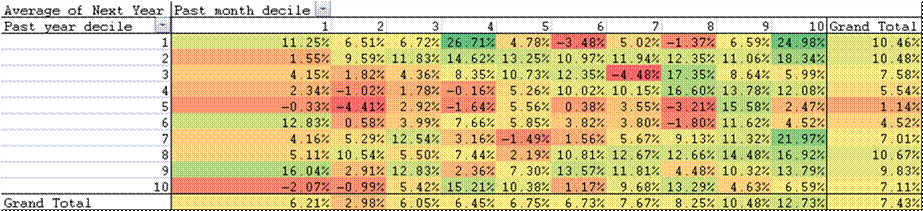
Okay, the R-squared is low on this calculation, but the drift from the regression is that there is mean reversion from the past year’s return, and momentum from the monthly returns.? Oddly, some of the worst return occurred when yearly returns were pretty average.
Returns Over the Next Month
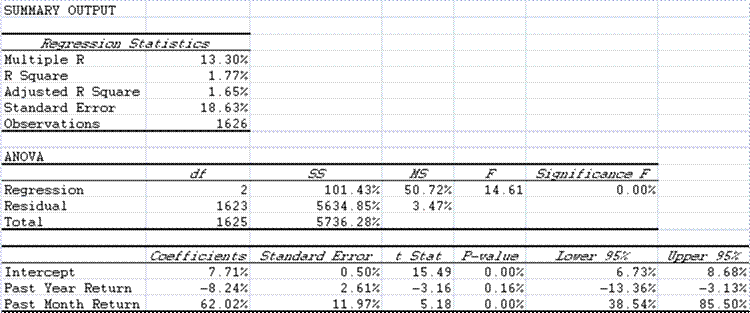
So, how do returns over the next month relate to returns over the last month and year?
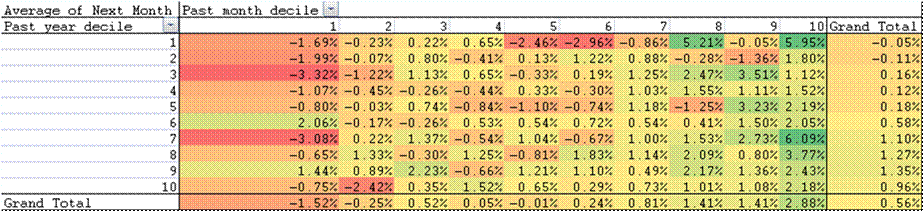
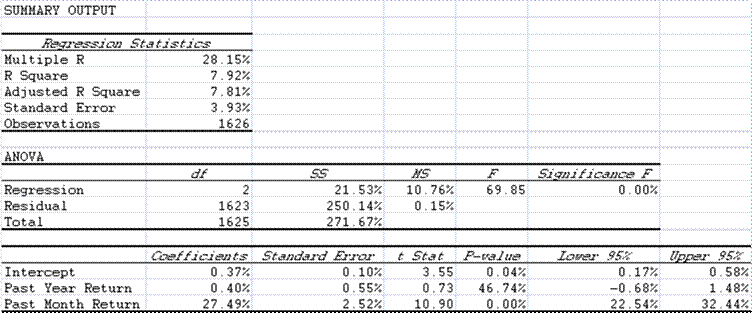
The R-squared is a little better here, and the main result is that the past year’s returns do not impact the next month’s returns much, but the past month’s returns do.? There may be some evidence for when monthly momentum is strong, if annual momentum is strongly positive or negative, there will be outperformance.
So, what do I conclude here?
- Monthly momentum persists over the next month and year.
- Annual momentum might persist over the next month, and with a lesser tendency might revert over the next year.
One constant I have observed in financial economics: mean-reversion exists, but the tendency is weak.
PS — where are we now?? Lowest deciles for both monthly and annual returns, which indicates bad performance for the next month , but good performance for the next year.? Buckle in, it will be volatile.
Thanks, David. Very good food for thought.
What could happen in the next year if we see a dramatic reversal in the flight-to-quality / liquidity trade currently on? In the event of a dollar collapse, might the nominal return on the S&P be positive y-o-y but the real return something altogether worse?
The image in my head right now is one of obese bankers frantically piling one on top of the other into a safe house named “treasuries” only to have the floor collapse beneath them due to sheer weight…..
Hello David,
there is a lot of literature out there that supports your theory regarding momentum strategies applied to stock and commodity markets, e.g.Jagadeesh/Titman http://papers.ssrn.com/sol3/papers.cfm?abstract_id=299107.
We simulated a momentum strategy on S&P500 stocks that did exceptionally well since 1991 and outperformed the S&P by sharp ratio, MDD and returns but nevertheless had by far its worst drawdown in the last three months.
David, I did something similar several years ago with individual stocks from the Telechart universe of about 7000 stocks, and found that BOTH the largest future gains and losses were in the most extreme deciles?10% and 90%. In other words, the largest historical gainers had many large future winners and many large future losers at the same time, as did the worst historical losers. This is consistent with both the momentum and turnaround strategies.
You might throw in an interaction into the analysis since the effect of one variable seems to be different across levels of the other variable. You can do so by creating an interaction variable equal to the product of the historical yearly return X monthly return.