David Merkel is an investment professional, and like every investment professional, he makes mistakes. David encourages you to do your own independent "due diligence" on any idea that he talks about, because he could be wrong. Nothing written here, at RealMoney, Wall Street All-Stars, or anywhere else David may write is an invitation to buy or sell any particular security; at most, David is handing out educated guesses as to what the markets may do. David is fond of saying, "The markets always find a new way to make a fool out of you," and so he encourages caution in investing. Risk control wins the game in the long run, not bold moves. Even the best strategies of the past fail, sometimes spectacularly, when you least expect it. David is not immune to that, so please understand that any past success of his will be probably be followed by failures. Also, though David runs Aleph Investments, LLC, this blog is not a part of that business. This blog exists to educate investors, and give something back. It is not intended as advertisement for Aleph Investments; David is not soliciting business through it. When David, or a client of David's has an interest in a security mentioned, full disclosure will be given, as has been past practice for all that David does on the web. Disclosure is the breakfast of champions. Additionally, David may occasionally write about accounting, actuarial, insurance, and tax topics, but nothing written here, at RealMoney, or anywhere else is meant to be formal "advice" in those areas. Consult a reputable professional in those areas to get personal, tailored advice that meets the specialized needs that David can have no knowledge of.


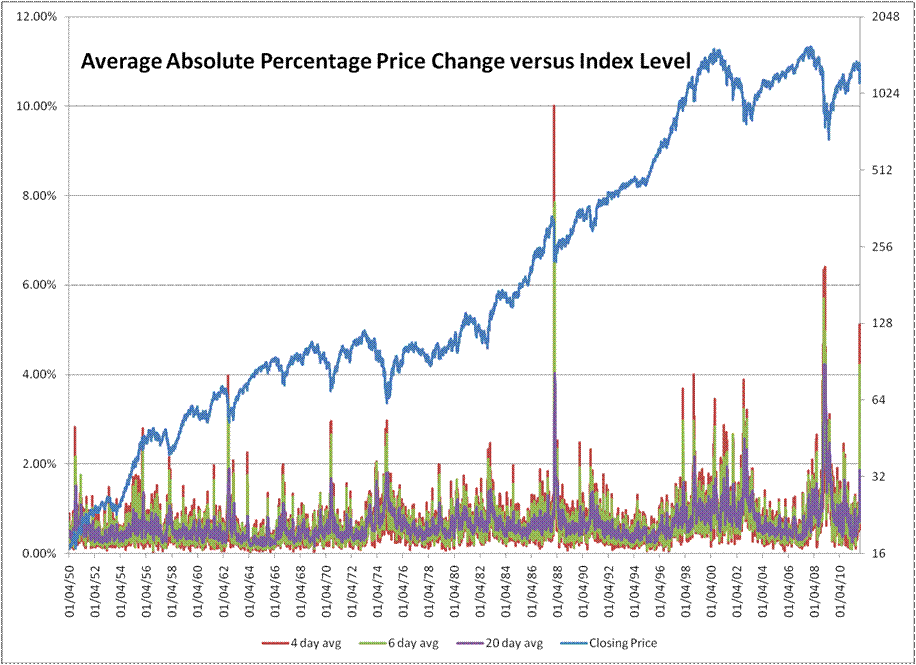
The FT wrote last week about the growing use of algorithms that punish the use of limit orders. I think that probably accounts for the change in market characteristics, like volatility.
(FT link – this probably requires a subscription) http://www.ft.com/intl/cms/s/0/ef5818d6-c297-11e0-9ede-00144feabdc0.html#axzz1UQNTmyil
with market down, David are your cash position is lower then last month? thank you for your update
My cash positions have fallen from 13% to 9%. I have been nibbling as prices have fallen.
thx u for ur update.
At what point would you get all in 100% stock, 0% cash?
Down another 15% or so.
A nonlinear transformation for equities is now occurring.
The CAC for instance has lost all gains in the last two years in a three week time span…
There is a precise pathway for the devolution…..
Saturation Macroeconomics:
There exists a global disparity in debt, ownership of debt, global real estate asset supply, real estate over valuation, western debt dependent consumption and eastern savings,massive trade imbalances dependent on eastern and western huge huge wage differentials, and 50 years of unsustainable corporate and taxpayer entitlements legislated by reelected politicians.
Is there a macroeconomic saturation point in saturation of supply and saturation of debt disparities that produces nonlinear transition periods?
In other words was the recent political intransigence and US debt downgrade merely an epiphoenomena of the global macroeconomic system’s unbalanced and saturated conditions?
Is the equity market following a nonlinear daily trading valuation pattern that confers on the system an equivalency of the laws of physics and the self assembly laws of chemistry and biology?
Wouldn’t it be marvelous even in the system’s collapse to determine that macroeconomic system had the characteristics and properties of a true science?
The financial asset class with the greatest market value and greatest global participation is the US debt instrument.
Observe the weekly composite equity and debt charts.
Equities are in the midst of a nonlinear collapse. US debt instruments
are the recipients of that nonlinear collapse and are in nonlinear growth
going to 150 year low interest rates.
For fifty years western debt expansion has been offset by
asset and wage inflation allowing further debt expansion. While there
are natural saturation limits to this process, the world macroeconomy
with the new Asian labor force participation has reached a
supersaturation point of debt and wage dysequilibrium.
50 years of entitlement promises ? most disproportionally benefiting the financial and corporate industries who now go into the asset collapse laden with cash ? have reelected Pavlovian politicians.
There is now a defacto consensus among US
(and eurobond) debt holders that austerity is needed to maintain the
quality of US debt. Qualitatively further debt expansion which drives
the real global economy is dead.
The deceleration in global GDP will be nonlinear. France?s quarterly GDP is one of the canaries in the coal mine.
Equities are undergoing exquisitely predictable Lammert quantitative
fractal collapse.
The daily fractal pattern for the first segment of the equity
collapse is 3/8/4 of 6-8/5 days.
I looked at your blog, which put out a few posts, then stopped. I know what a fractal is, but I can’t interpret your last sentence. Translation?