Twitter is serendipitous to me.? I don’t track it all day long, or I would never get anything done.? Usually, I keep it off, unless I am sending off tweets.? But I accidentally saw a tweet from Cardiff Garcia of FT Alphaville. regarding a presentation done by Brad DeLong.? Here it is:
So I looked, and here is what I found:
I looked at it and said, “Huh, yeah, whoever did this was a total hack.? Totally arbitrary curve drawing.”? But then I thought a little more.? “If I estimated a quadratic equation (parabola) what would it look like versus the data?”
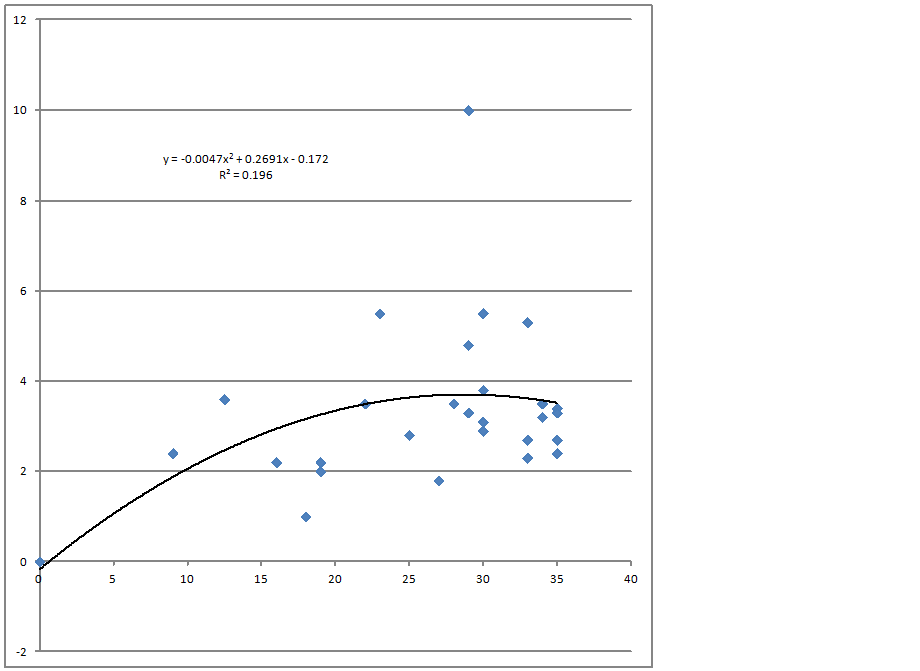
So I took the points and eyeball estimated the values, and dropped them into an Excel spreadsheet, and ran the regression.? Turns out that both DeLong and the Wall Street Journal, and those they relied on were wrong.? Remember that the horizontal axis is marginal corporate tax rate, and the vertical axis is corporate taxes received as a percentage of GDP.
At a 5% level of significance, the equation is not significant, and the coefficients are not significant, though they are close.? The signs all go the right way, and the intercept is near zero.? That said, the prob-value for the equation as a whole (F test), is 6.5%, not far from the 5% threshold, so it looks like there is some validity to the idea that as marginal corporate tax rates rise, so do corporate taxes as a percentage of GDP, until the taxes get too high.
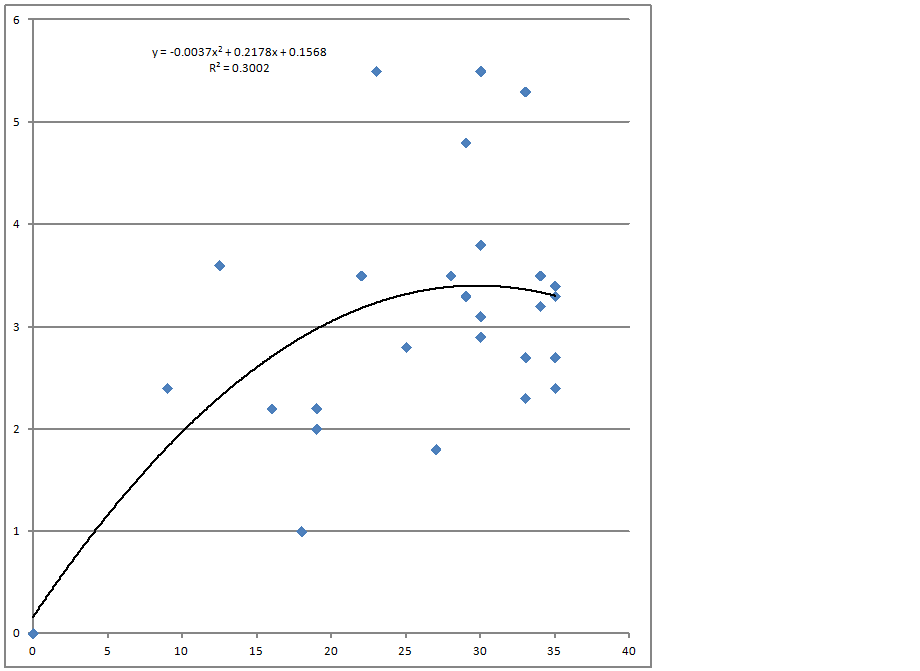
Only one data point of the above analysis, Norway, is statistically significant, with an error 3+ standard deviations versus the model.? Norway is different, with its huge sovereign wealth fund, so what happens to the model if we exclude it, and re-run the model?
Under these conditions, at a 5% level of significance, the equation is significant, with a prob-value of 1.4%, and all but one of the coefficients are significant, and the coefficient on the squared term has a prob value of 11.6%.? The signs all go the right way, and the intercept is near zero.? It looks like there is some validity to the idea that as marginal corporate tax rates rise, so do corporate taxes as a percentage of GDP, until the taxes get too high.
I didn’t test anything else.? With both equations we learn two ideas:
- The tax take tops out at a 30% marginal rate
- You don’t give up much if you set the marginal rate at 20%
Now, this is a cursory analysis on a limited data set.? But the idea that corporations start to go elsewhere when tax rates get too high is a reasonable hypothesis.? The WSJ analysis was a joke, but so was DeLong’s dismissal of the data.
I’m no great fan of the idea of the Laffer Curve, never have been, but this was the first time I gained some sympathy for the idea.? So, be wary who you listen to, study statistics and their limitations, and generally, be skeptical, but not cynical.? There is truth out there, we just need to find it.
PS — If anyone wants me to publish the detailed statistics, I will, but I omitted them because they make most of my readers’ eyes glaze over.


I’m not a statistics guy so I’m curious why you took off the top outlier but left the bottom one? Wouldn’t the chart level out a LOT if you took out UAE or whomever is on the bottom?
That was the point that fit the model least well. Actual value was more than 3 SDs more than modeled value. The UAE value fit the model very well in both cases, without additional constraint.
David,
Thank you – an interesting piece, as usual.
By way of background, I am a tax professional (in the UK). While there’s no doubt that headline rates of tax are important, there are a lot of other factors that would, in a fuller study, be taken into account: rules on deductibility and use of losses, basis of taxation (territorial/worldwide), treatment of CFCs, complexity and administrative burden of the tax code, attractiveness as regards sales taxes and employee taxation, etc. All these, and more, are relevant to corporations deciding where to invest, so – while this type of analysis is interesting – it’s far from the full picture. Also, for the UK at least, corporation tax is a relatively minor source of revenues when compared with VAT and (individuals’) income tax. Obviously, however, individuals are less mobile than corporates, so perhaps laffer curve effect less relevant to taxation of individuals?
We can all argue about the minutia of this regression model versus that one, but even if we (magically) find a model with an R-squared of 1.00 …. correlation does not prove causality.
I think a more important question to ask is this: why are we listening to a couple of quacks debating something they have only read about? Brad Delong is an academic, with tenure — he doesn’t have to make payroll or make a sales quota. He has no clue. The other guy is a media guy / writer for the FT (I think it is wrong to speak ill of the dead, so I refuse to call it journalism).
Neither of these alleged “experts” has ever run a business. Neither has ever had to make payroll, or manage the cashflows of a lemonade stand. They may have read about it in a book, they may have written a thesis about it. They might have even appeared in a movie. But they have never actually done it.
This is exactly like asking a male OB/GYN what it is like to give birth. The doctor might have awards and degrees from every medical school on the planet, but *he* has never actually given birth.
I don’t care how many academic degrees Mr Delong has. I don’t care if the FT guy has interviewed every hedge fund manager on the planet. They are a couple of virgins arguing about what sex feels like.
Real wisdom is admitting you don’t know everything. Real wisdom is understanding that there is a HUGE difference between what works in a research lab or “in theory” — versus what works out in the real world.