========================
I lost this post once already, hopefully it will be better-written this time. ?I’ve been playing around with the stock market prediction model in order to give some idea of how the actual results could vary from the forecasts.
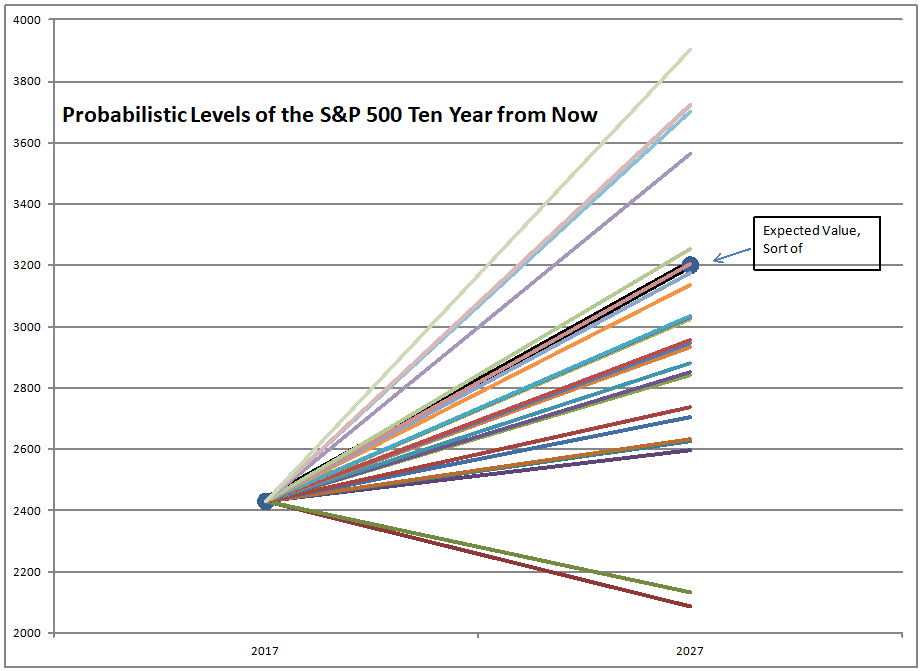
Look at the graph above. ?it shows potential price returns that vary from -1.51%/year to 4.84%/year, with a most likely value of 2.79%, placing the S&P 500 at 3200 in March 2027. ?Add onto this a 2% dividend yield to get the total returns.
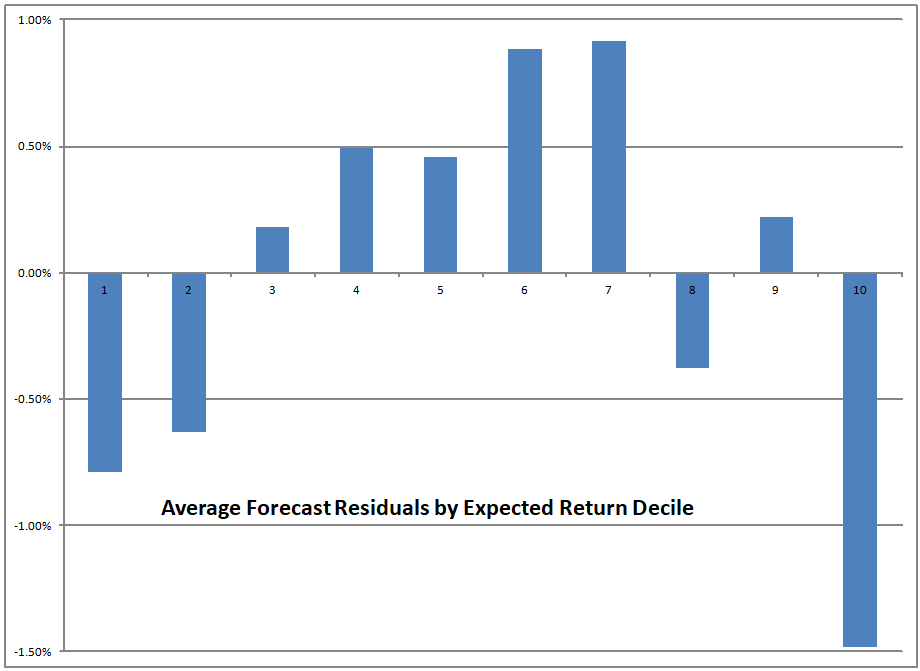
The 26 paths above come from the 26 times in the past that the model forecast total returns within 1% of 4.79%. ?4.79% is at the 90th percentile of expected returns. ?Typically in the past, when expected returns were in the lower two deciles, actual returns were lower still. ?For the 26 scenarios, that difference was 0.63%/year, which would imply 10-year future returns in the 4.16%/year area.
The pattern of residuals is unusual. ?The model tends to overestimate returns at the extremes, and underestimate when expected returns are “normal.” ?I can’t think of a good reason for this. ?If you have a good explanation please give it in the comments.
Now if errors followed a normal distribution, a 95% confidence interval on total returns would be plus or minus 3.8%, i.e., from 1.0% to 8.6%. ?I find the non-normal confidence interval, from 0.5% to 6.8% to be more plausible, partly because valuations would be a new record in 2027 if we had anything near 8.6%/year for the next ten years. ?Even 6.8%/year would be a record. ?That”s why I think a downward bias on results makes sense, with high valuations.
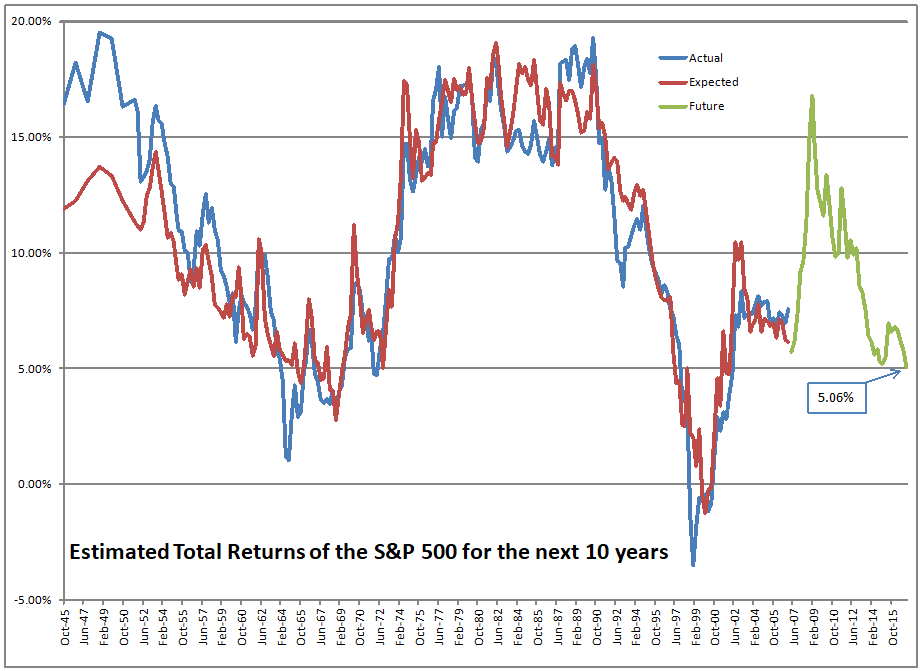
At the end of the first quarter, the model forecast total returns of 5.06%/year for the next ten years. ?With the recent rally, that figure is now 4.79%/year. ?Now, how excited should we be about these returns? ?Not very? ?I can buy that.
But what if you were a financial planner and thought this argument to be plausible? ?Maybe you can get 3.5%/year out of bonds over the next ten years. ?With 4.79% on stocks, and a 60/40 mix of stocks/bonds, that means returns of 4.27%. ?Not many financial planning models are considering levels like that.
But now think of pension plans and endowments. ?How many of them have assumptions in the low 4% region? ?Some endowments are there as far as a spending rule goes, but they still assume some capital gains to preserve the purchasing power of the endowment. ?Pension plans are nowhere near that, and if they think alternative investments will bail them out, they don’t know what they are doing. ?Alternatives are common enough now that the face the same allocative behavior from institutional investors, which then correlates their returns with regular investments in the future, even if they weren’t so in the past.
I don’t have much more to say, so I will close with this: if you want to study this model more, you need to read the articles in this series, and the articles referenced at the Economic Philosopher blog. ?Move your return expectations down, and diversify away from the US; there are better returns abroad — but remember, there are good reasons for home bias, so choose your foreign investments with care.


This series of discussions on future returns on this site and Philosophical Economics has been very interesting. Personally, it has been reinforcing to me the message that has been out there on the GMO site, Doug Short’s site etc. about extended valuations. The novel thing in this go-around is the very low interest rates, which means that bonds are not reliable for future returns either but are still a necessary diversifier as bond bear markets tend to have completely different rates of change than stock markets (bonds took a decade to plunge in value in the 70s while stocks only took months in 1974).
For the past few years, I have been using a diversified portfolio (about 60/40) with US and international stocks, US bonds, TIPS, and short-term funds (e.g. Stable Value GIC fund in 401k). Pretty much everything yields 1.5% to 2.5% in annual interest/dividend cash yields, so the main variability is potential future capital gains. I have been assuming 0% annualized real returns for that portfolio up to retirement in about 7 years. This means that we have to save to build our portfolio in real terms, which we are doing instead of relying on investment returns. Zen-like acceptance of this means that we are not desperately casting about for alternatives.
After retirement (about 2025), I am assuming about 5% real returns as I think we will have moved past a US stock market crash and the Millenials moving into their 40s will start to shift the demographics into a positive framework for growth for the next couple of decades, which will start to normalize interest rates with 2% – 5% Fed Funds rates.
Any CEO/CFO, mayor, or governor who used these assumptions for their pension funds would not survive the next election or shareholders meeting. Cities and states like Dallas/Illinois are going to be facing hard decisions soon. I think state/local pensions are going to be a major issue over the next decade as people look at potential places to move to for jobs or retirement. Those current low local tax rates may not survive, or maintaining them may require eliminating core services. Most financial planners would also probably not survive their clients’ expectations either with these assumptions.
The only long-term pension-type payments we expect to receive are the NYS Teacher’s pension, which seems to have ok funding levels so that much or all of the promises can be kept, and Social Security which is the third rail of politics. For our worst case scenarios, I am using the returns mentioned above for our portfolio and 25% haircuts on NYS pension and Social Security promises. So I am fairly comfortable with our “worst case” scenarios of portfolio returns and “guaranteed income” for planning purposes, but I don’t think they match at all what society in general is expecting. If they come to pass, the unrest in the recent federal election may be just the beginning as the bills come home to roost.
This indicator’s usefulness is nearly finished now that Mark Hulbert has discovered it: http://www.marketwatch.com/story/equity-allocation-indicator-flashes-bear-market-warning-2017-06-16
I expect the ETPs based on it to start cascading out soon. Hedge funders will market quant models based on it to poor hapless pension funds. High frequency traders will develop models to trade ETFs based on new data on household finances breathlessly awaited. Soon there should be a conference to discuss it and tweak it to “improve” it with proprietary models (available for a fee) and to develop entire retirement plans based on it to justify 2%/year fees.
The end is nigh…..
A guess about the pattern of errors ….
As you note early on, the model doesn’t predict the depths of bear markets that well. So suppose bear markets are extremes, outside the bounds of the model. Then when valuations are very high (and a bear market comes in the next ten years) the plunge will be farther than the model predicts. When valuations are very low, at the depths of an extreme bear market, the snap back will be sharper than the model accounts for.
Just a guess.