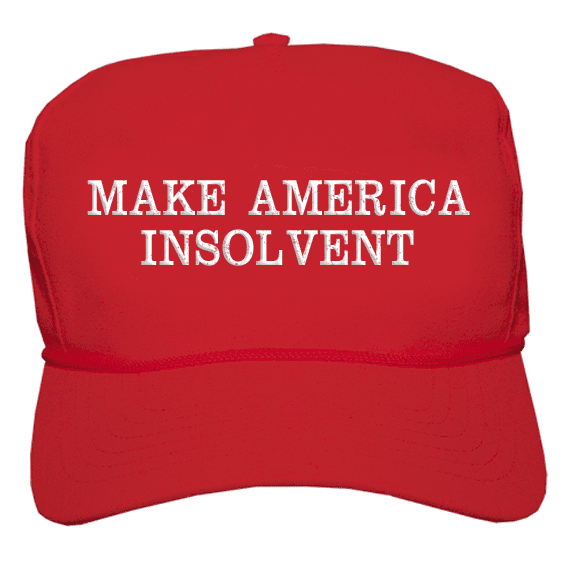
Returns on Equity Amid the Financial Crisis, Redux
Tuesday, December 20th, 2011To have a full version of my article, with the equations that explain my reasoning, Returns on Equity amid the Financial Crisis. Thanks to all who read it.
To have a full version of my article, with the equations that explain my reasoning, Returns on Equity amid the Financial Crisis. Thanks to all who read it.
I wrote the following for the 2012 Baltimore Business Review. When it is publicly available on the web, I will highlight it. For now, I will offer you the unedited version of my paper that will be published there:
-==-=-=-=-=-=-=-=–==-=–=-=-=-==–==-=–=-=-==-=-=-=-=-=-=-=-=-=-=-=-=-
Returns on Equity amid the Financial Crisis
Abstract
From 2005-2010, the change in public company returns on book equity [ROE] was wrenching during the financial crisis. The results were uneven by sectors, and even by geography, for stocks traded in US equity markets. This paper looks at the differences, and attempts to explain why there was so much variation by sector and geography. After that, the paper attempts to explain the correlation between changes in ROE and stock returns, by year, sector, and geography.
Introduction
Since 2005, equity markets have seen a boom, a bust, and a tepid recovery. Financial stocks seem to have had the worst of it, but is that really true?
This paper attempts to disaggregate the differing effects of geography (countries/US states), and economic sector over time to try to understand how the boom, bust and recovery have affected public companies.
Part 1 – Return on Equity
Method
This study excluded stocks with market capitalizations under $100 million at the end of the study period. It also excluded miscellaneous financial companies such as exchange-traded products, closed-end funds, and special-purpose acquisition companies, because they don’t have operating businesses. That left 3,796 companies that trade on US exchanges available for the analysis.
Given the tendency for businesses in states and countries to be concentrated in one or two sectors, a minimum was imposed for states and countries to be analyzed individually. Countries with fewer than four companies trading on US exchanges were placed in the “other” country category, and states with fewer than four companies trading on US exchanges were placed in the “other” state category.
Over the years 2005-2010, data regarding book equity, net income, market capitalization, market price, share count, and total returns were gathered, and aggregated by geography (Country if non-US, state if US), sector, and year.
Using Ordinary Least Squares Regression, the following relationship was estimated:
Where:
The reasons for using this sort of equation is twofold: first, by using dollar figures rather than earnings per share and book value per share, large companies are given their proper weight versus smaller companies. Second, it allows for the effects of ROE changes by geography, sector and year to be separated.
In an analysis where there are multiple groups of dummy variables, at most one set of dummy variables can be complete if there is no intercept term, and no set can be complete if there is an intercept term. If not, the regression will fail. The choice of what to omit is arbitrary, and does not affect the relative relationships within a set of dummy variables. For the purposes of this paper the sector dummy variables were left complete, and the coefficients on the first geographic area (Argentina) and the first year (2005) were set to zero.
Results
The R-squared of the regression was 55.7%, which has a prob-value of greater than 99.9%.
Here are the results of contribution to ROE by country:
18.1% | Mexico |
16.9% | Chile |
15.4% | Other Nations |
15.1% | Brazil |
14.1% | Australia |
13.4% | Spain |
13.2% | India |
10.6% | Bermuda |
10.6% | Hong Kong |
7.3% | Greece |
7.1% | Russia |
6.5% | Taiwan |
6.3% | Netherlands |
6.3% | Italy |
6.3% | Switzerland |
6.1% | China |
5.9% | Norway |
5.8% | Canada |
5.1% | Sweden |
5.1% | Germany |
4.1% | France |
3.7% | United Kingdom |
2.8% | United States |
1.9% | Singapore |
1.9% | Israel |
1.0% | Cayman Islands |
0.6% | Japan |
0.1% | South Korea |
0.0% | Argentina |
-0.2% | Puerto Rico |
-1.4% | Finland |
-3.1% | Ireland |
-3.2% | Luxembourg |
-6.3% | South Africa |
The United States is included for comparison purposes as the weighted average of the contribution to ROE by states. There was not a separate variable for the US in the analysis.
As Latin America moved toward freer markets, with growing middle classes, their contributions to ROE were relatively high. In general, resource rich nations tended to have higher contributions to ROE.
Mexico’s contribution to ROE was led by communication companies Telmex, America Movil, and Grupo Televisa and consumer-oriented companies like Coca-cola Femsa, FEMSA, and Wal-Mart de Mexico. A growing middle class pushed up demand for these companies.
Chile’s contribution to ROE was led by the utilities Enersis and Empresa Nacional de Electricidad, the banks Banco Santander Chile and Banco de Chile, and chemical company Sociedad Quimica y Minera de Chile. A growing economy boosted demand for electrical power, their banks didn’t make the mistakes made by most of the rest of the developed world, and Sociedad Quimica y Minera was in the “sweet spot” for the chemicals it produced, particularly fertilizers, and lithium which goes into rechargeable batteries.
Brazil’s contribution to ROE was led by the energy giant Petrobras, the diversified mining company Vale, and the banks Banco Santander (Brasil), Itau Unibanco Holding, and Banco Bradesco. Global demand for crude oil, iron ore, and other resources boosted the contributions to ROE with Petrobras and Vale. Brazil’s banks also didn’t make the mistakes made by most of the rest of the developed world.
On the negative side, contributions to ROE in Finland were held down by Nokia, where they fell behind consumer trends with cell phones and other portable wireless devices. Ireland was held back by banking sector, which lent too much on Irish residential property, amid other errors. Luxembourg had ArcelorMittal, which slumped with the global steel industry as prices for coking coal and iron ore rose. South Africa had the worst contribution to ROE as a country because of the heavy weight their economy has in basic materials. Basic materials was a strong sector, but South Africa was concentrated in one the weakest ROE industries in that sector, gold mining.
Here are the results of contribution to ROE by US state:
18.6% | Washington |
16.9% | Arkansas |
13.0% | District of Columbia |
11.3% | Minnesota |
10.0% | Connecticut |
10.0% | Oregon |
8.9% | Rhode Island |
8.2% | New Jersey |
7.8% | Kentucky |
6.7% | Nebraska |
6.6% | Indiana |
6.2% | California |
6.1% | Georgia |
5.5% | Wisconsin |
5.4% | Missouri |
5.1% | Iowa |
5.0% | Texas |
4.4% | Tennessee |
3.2% | Illinois |
3.1% | Florida |
2.9% | Maryland |
2.8% | US Average |
2.5% | North Carolina |
1.2% | New York |
1.2% | Pennsylvania |
1.1% | South Carolina |
0.8% | Other |
0.6% | Ohio |
-0.4% | Utah |
-0.5% | Nevada |
-1.3% | Louisiana |
-2.3% | Arizona |
-3.6% | Colorado |
-4.6% | Massachusetts |
-5.6% | Alabama |
-7.9% | Oklahoma |
-10.3% | Virginia |
-31.9% | Kansas |
-83.6% | Michigan |
To some degree, historical accidents help explain why some states have high contributions to returns on equity, and others low contributions. Washington State has Microsoft, Amazon, and Costco, all of which started out there. Michigan has General Motors, Ford, and Chrysler; the automobile industry has long been a big part of the state economy.
The contribution to ROE of Arkansas can be entirely attributed to Wal-Mart. Washington, DC can largely be attributed to Danaher, though Fannie Mae pulled the contribution to ROE down considerably as it failed in 2008.
The results of Kansas are dominated by Sprint Nextel, which has been a weak competitor in wireless telephony, though YRC Worldwide also had some impact on the low contribution to ROE as it was too acquisitive heading into a major recession. Virginia has many strong companies, but Freddie Mac pulled the contribution to ROE down with it failure in 2008.
Companies don’t move often, so attributing the differing contributions to ROE to state policies is unlikely. In the extreme cases listed above, all of the companies listed had been headquartered in their respective states for a long time, and most had been started there.
Here are the results of contribution to ROE by sector:
25.91% | Consumer Non-Cyclical |
23.31% | Basic Materials |
20.20% | Energy |
18.10% | Health Care |
14.59% | Utilities |
14.24% | Capital Goods |
14.07% | Technology |
10.56% | Services |
10.20% | Consumer Cyclical |
9.52% | Financial |
4.72% | Transportation |
-5.58% | Conglomerates |
The end of the first decade of the new millennium was characterized by strong development around the world, with many nations clamoring for resources and non-cyclical consumer goods, which why the contribution to ROE by sector was led by Consumer Non-Cyclicals, Basic Materials, and Energy.
Conglomerates are the smallest sector, at 0.3% of total book equity, so it is difficult to draw conclusions about why it had the lowest contribution to ROE. That said, it is difficult to manage disparate enterprises for organic operating returns. Increases in energy costs hurt transportation ROEs, which unlike utilities, have a harder time passing the price increases through.
Financial stocks saw their contribution to ROE drop because of the financial crisis. The contribution to ROE includes two great years 2005-2006, two horrible years 2007-2008, and two years of recovery. The contributions to ROE in the financial sector in 2007-2008 more than erased the gains made earlier in the decade.
Contribution to ROE for Consumer Cyclicals were damaged by bad results in the Automobile industry and slumping demand as the economy went into a recession in 2008, and had a rather weak recovery in 2009-2010.
Here are the results of contribution to ROE by year:
0.00% | 2005 |
2.04% | 2006 |
-1.28% | 2007 |
-18.37% | 2008 |
-8.06% | 2009 |
-3.72% | 2010 |
Contribution to return on equity rose 2% over 2005 levels in 2006. In 2007, as the stock market reached new highs and began to fall in the fourth quarter of 2007, partially because the contribution to ROE fell below 2005 and 2006 levels.
In 2008, as the financial crisis arrived, the contribution to ROE plummeted. Much of the effect was concentrated in financial stocks, but the contribution to ROE for the market as a whole fell 17%. In 2009 and 2010, as the recovery from the crisis progressed contribution to ROE rose each year, but still remained below the contribution to ROE that existed during the boom years 2005-2007.
Part 2 – Total Returns
Method
The same stocks as in the first section, and the same methods were used to estimate the following relationship, using Ordinary Least Squares:
Where:
The dollar value of gains or losses is calculated by the change in market capitalization, plus dividends, less the proceeds of shares issued, plus the cost of shares bought back.
Results
The R-squared of the regression was 76.7%, which has a prob-value of greater than 99.9%.
Here are the results of contribution to total return by country:
216.77% | Israel |
24.53% | Chile |
17.34% | Singapore |
12.44% | Other Nations |
11.99% | China |
11.34% | Australia |
10.37% | Hong Kong |
8.32% | Mexico |
7.62% | Bermuda |
7.15% | Brazil |
4.14% | Netherlands |
3.41% | Germany |
3.24% | Greece |
2.32% | Spain |
1.93% | Norway |
1.72% | Italy |
1.62% | United Kingdom |
1.61% | Cayman Islands |
1.30% | US Average |
1.24% | Taiwan |
1.08% | India |
0.86% | France |
0.76% | Switzerland |
0.74% | Puerto Rico |
0.13% | Finland |
0.00% | Argentina |
-1.44% | Russia |
-3.46% | South Korea |
-4.16% | Canada |
-4.32% | Japan |
-4.44% | Ireland |
-6.19% | South Africa |
-8.72% | Sweden |
-17.49% | Luxembourg |
The United States is included for comparison purposes as the weighted average of the contribution to ROE by states. There was not a separate variable for the US in the analysis.
Looking at the countries at the top and the bottom, Israel benefitted from Teva Pharmaceutical, Check Point Software Technologies, and a scad of little technology companies that soared in value. Singapore was led by Avago Technologies which has been seeing strong growth in demand for their analog semiconductor devices.
Chile, as mentioned above, contribution to total return was led by the utilities Enersis and Empresa Nacional de Electricidad, the banks Banco Santander Chile and Banco de Chile, and chemical company Sociedad Quimica y Minera de Chile. In addition, Lan Airlines grew their net income by 150% over the whole of the study period, as a growing middle class flew more often.
Ireland, Luxembourg and South Africa were low on the contribution to ROE by countries. Ireland’s contribution to total returns was held back by its banking sector, as mentioned previously. The same applies to Luxembourg with ArcelorMittal. And again, South Africa had a low contribution to total returns as a country because of the heavy weight their economy has in basic materials. Basic materials was a strong sector, but South Africa was concentrated in one the weakest industries for total returns in that sector, gold mining.
Sweden had three large companies Ericcson (Telecommunications Equipment), Volvo (Automobiles) and Swedbank (Banking) that underperformed. Volvo and Swedbank were in weak industries given the financial crisis, while Ericcson underperformed versus competitors in its industry.
Note that the order of the lists of contribution to ROE and contribution to total return across are similar. The correlation of the two sets of coefficients is 1.8% — statistically indistinguishable from zero, but the rank correlation of the two sets is 62.7%, which is significantly greater than zero with 95% certainty. The high coefficient on Israel’s contribution to total returns throws the ordinary correlation coefficient off; without Israel, the correlation would be 64.5%.
Thus it seems that contribution to ROE and contribution to total return are related across countries.
Here are the results of contribution to total return by US state:
19.12% | Oregon |
15.18% | Kentucky |
13.85% | Iowa |
13.28% | Michigan |
12.77% | Nebraska |
12.53% | Arizona |
11.52% | Rhode Island |
9.35% | Colorado |
9.24% | Texas |
8.10% | Alabama |
7.18% | Louisiana |
7.02% | Oklahoma |
6.26% | Illinois |
5.58% | California |
5.01% | New Jersey |
4.58% | Massachusetts |
3.49% | Missouri |
2.62% | Maryland |
2.21% | South Carolina |
2.17% | Minnesota |
1.56% | Utah |
1.40% | Washington |
1.30% | US Average |
-0.02% | Wisconsin |
-0.49% | Connecticut |
-1.11% | New York |
-1.39% | Arkansas |
-2.02% | Indiana |
-3.13% | Pennsylvania |
-4.49% | Florida |
-5.21% | Ohio |
-7.04% | Tennessee |
-7.76% | North Carolina |
-8.19% | Kansas |
-8.42% | Nevada |
-12.06% | Georgia |
-19.45% | Other |
-21.02% | Virginia |
-33.73% | District of Columbia |
Oregon’s contribution to total return was high because of Nike and Precision Castparts. Both have been based in Oregon since their founding. The same can be said of Yum! Brands, Humana, and Brown Forman in Kentucky. Yum Brands began with Pepsi’s purchase of Kentucky Fried Chicken, which was founded by Colonel Sanders out of home in Corbin, Kentucky in 1930. Brown Forman was started in Kentucky in 1870 by George Garvin Brown.
Terra Nitrogen, LP was an Iowa firm from its founding until its parent company was acquired by CF industries in mid-2010. It is counted as an Iowa firm for this study, but is now based in Illinois.
DC and Virginia have the lowest contributions to total returns because of Fannie Mae and Freddie Mac, respectively. Georgia had a low contribution to total returns, largely due to SunTrust Banks, which holds the dubious distinction of receiving four installments of bailout cash. Nevada had a low contribution to total returns because of their high exposure to the casino/gaming industry, which did poorly during and after the financial crisis.
All of these companies are historical accidents. They were based in their states since their founding.
The state lists on contribution to ROE and contribution to total return across are not similar. The correlation of the two sets of coefficients is -10.68% — statistically indistinguishable from zero. The rank correlation of the two sets is 26.68%, which is also not significantly greater than zero with 95% certainty.
It seems there is no relationship at the state level between contribution to ROE and contribution to total return.
Here are the results of contribution to total return by Sector:
34.22% | Basic Materials |
33.86% | Consumer Non-Cyclical |
33.13% | Conglomerates |
30.87% | Transportation |
27.49% | Utilities |
24.38% | Technology |
23.69% | Consumer Cyclical |
22.88% | Services |
21.94% | Energy |
19.80% | Health Care |
19.51% | Capital Goods |
15.49% | Financial |
The lists between contribution to ROE and contribution to total return by sector are different. The correlation coefficient between them is -0.50%, which is virtually zero. But excluding the two smallest sectors, Conglomerates and Transportation, which have noisy data with only 2% of the total market capitalization, the correlation would be 71.51%, which would be statistically different from zero with 95% probability. Thus it seems that contribution to ROE and contribution to total return are related across sectors.
The low contributors to total return by sector are led by Financials and Capital Goods, both of which did poorly in the recent crisis and the aftermath. Basic Materials and Consumer Non-Cyclicals led the high contributors to total return by sector, as a growing global middle class created demand for commodities and staple consumer goods.
Here are the results of contribution to total return by year:
0.00% | 2005 |
-5.35% | 2006 |
-11.15% | 2007 |
-67.18% | 2008 |
5.51% | 2009 |
-12.47% | 2010 |
The contributions to ROE and contributions to total return by year are very similar, though the contribution to total return is far more volatile. Also, total return anticipates changes in ROE, exacerbating the fall in 2007 and 2008, and anticipating tougher market conditions in 2011 in the results of 2010.
Without adjustment for leading effects, the correlation of the two series is 80.83%, which is different from zero with greater than 95% probability. Thus it seems that contribution to ROE and contribution to total return are related across years.
In a regression of the two series, where ROE contribution by year is the independent variable, and total return contribution by year is the dependent variable, the beta of the regression was 2.86, with a 94% prob-value for the coefficient and the regression as a whole.
That total returns should be levered 2.86 times to changes in ROE should surprise no one. Markets anticipate, and change disproportionately, because they can’t tell whether changes are temporary or permanent, and so a multiple near 3 splits the difference.
Avenues for Further Study and Conclusion
The researcher did not use the CRSP database, because he had no easy access to it. This study could be done over far more years and with greater precision.
The markets during 2005-2010 rewarded companies the served the growing global middle class, and aided the growth of the developing world. It punished financial companies, and cyclical companies that did not have significant markets in the developing world.
In general, US state policies did not directly affect the financial results. The best and worst companies by state were generally long term residents of the state in question. Historical accidents dominate over companies that choose to move to other jurisdictions.
In general, contributions to ROE and total returns are related, but contributions to total returns lead contributions to ROE. Markets anticipate changes in future profits.
Disclosure: David Merkel and clients of Aleph Investments own shares of Wal-Mart and Petrobras, as of the date this was originally written.
This is one area where I would like feedback from my readers. My view is that the repeal of Glass-Stegall had little impact on the crisis. Most of the crisis occurred as a result of ordinary failures in investment banking, and commercial banking, with little change from combining them.
I would argue that the overall model for investment banking failed. No major investment bank survived the crisis intact. Goldman Sachs and Morgan Stanley had to seek banking charters to survive and receive help from the Treasury/Fed (one entity, but like Janus, two faces). Everyone else needed help from the Feds, or failed, or merged.
I would also argue that the overall model for commercial banking failed, with many making loans that were horrendously underwritten.
So, what aspects of the crisis stemmed from the repeal of Glass-Stegall? Remember, the Fed was chipping away at it for some time. Feel free to comment below, but if you don’t want to do that, email me. Thanks.
What I write here will not be rigorous. We’ve heard about “peak oil.” We’ve heard about other resources, and how production will decline over time.
But what of credit? It isn’t that hard to create, but it is hard to create well, particularly when debt levels are high, as in this environment.
It’s not just the US, debtor-friendly as it has been for most of its existence. Most of the rest of the world has debt problems.
China has indebted municipalities and banks, and debts to many projects from Party members that will not pay off. The EU is overly indebted everywhere, not just the PIIGS, and finds its overall borrowing rates rising as lenders wonder what a Euro will be worth if the Eurozone dies.
In the US, government debt rises more than corporate and consumer debt falls. We’ll pay the government debt off later. Don’t worry. ![]()
The simple solution to every problem is to say the it is a liquidity problem, not a solvency problem. How do does one solve a liquidity problem? Get a loan. If the assets are really worth more than the liabilities, there should be some unencumbered assets that you can secure a loan with, and pay off the liquidity squeeze. But absent that, it’s insolvency, regardless of what notional price one places on the assets.
But what if the problem is really a solvency problem? Will a loan help cure that? No. You can’t solve a debt problem with debt.
There are generally few liquidity problems relative to solvency problems. As an example, most corporate bonds don’t default on principal payments, but on interest payments. For individuals, balloon payments on loans might be relatively more of a problem, but since most people finance their homes, etc., on relatively thin ratios of income to debt service, interruptions of income lead to insolvency more often than balloon payments.
Consider for a moment that every liability is the asset of someone else, but not vice-versa, because some assets are owned free and clear. Now pretend that we take everything in the world (the same could be applied to a nation), and put it on a single balance sheet, but we don’t net out the liabilities that would cancel out.
Which system would be more stable? One where the liabilities are roughly equal to the net worth, or one where they are roughly five times the net worth? The former, of course. Now, not all liabilities are the same — long-dated claims like pensions only claim a little bit of the assets of the world at a time, whereas a large number of short-dated liabilities would make the system less stable, or perhaps lead to inflation. Many dollars chasing few goods, or assets, or both.
I’m not sure exactly where the boundary line is for “peak credit.” It would depend on the structure of the liabilities in question. But once the fuzzy limits get exceeded:
In general, if we were starting over again, there are a lot of things that we should have done differently:
Banks would be a lot less profitable under such an arrangement, but it would prevent debt bubbles. Besides, the banks would make up for it by charging for deposit/checking accounts.
Summary
We may be near “peak credit” at present, and that is true of much of the world. Better we should have had a smaller financial sector, and avoided the financialization of the economy. As it is, we face many years of slower growth ahead as we bleed debt out of the economy, or a number of years of inflation ahead, as we inflate away debts. I suspect the former, but I can’t ignore the latter.
| November 2011 | December 2011 | Comments |
| Information received since the Federal Open Market Committee met in September indicates that economic growth strengthened somewhat in the third quarter, reflecting in part a reversal of the temporary factors that had weighed on growth earlier in the year. | Information received since the Federal Open Market Committee met in November suggests that the economy has been expanding moderately, notwithstanding some apparent slowing in global growth.
| Getting more optimistic about growth. I think they are going to get surprised on the downside again. |
| Nonetheless, recent indicators point to continuing weakness in overall labor market conditions, and the unemployment rate remains elevated. | While indicators point to some improvement in overall labor market conditions, the unemployment rate remains elevated. | The unemployment rate is down, but jobs aren’t being created, as people drop out of the labor force. This is improvement? |
| Household spending has increased at a somewhat faster pace in recent months. Business investment in equipment and software has continued to expand, but investment in nonresidential structures is still weak, and the housing sector remains depressed. | Household spending has continued to advance, but business fixed investment appears to be increasing less rapidly and the housing sector remains depressed. | Shades down their view on business investment. Shades up their view on consumer spending. |
| Inflation appears to have moderated since earlier in the year as prices of energy and some commodities have declined from their peaks. Longer-term inflation expectations have remained stable. | Inflation has moderated since earlier in the year, and longer-term inflation expectations have remained stable. | Gets more definite about inflation moderating, except that it hasn’t moderated. |
| Consistent with its statutory mandate, the Committee seeks to foster maximum employment and price stability. | Consistent with its statutory mandate, the Committee seeks to foster maximum employment and price stability. | No change. |
| The Committee continues to expect a moderate pace of economic growth over coming quarters and consequently anticipates that the unemployment rate will decline only gradually toward levels that the Committee judges to be consistent with its dual mandate. | The Committee continues to expect a moderate pace of economic growth over coming quarters and consequently anticipates that the unemployment rate will decline only gradually toward levels that the Committee judges to be consistent with its dual mandate. | No change. |
| Moreover, there are significant downside risks to the economic outlook, including strains in global financial markets. | Strains in global financial markets continue to pose significant downside risks to the economic outlook. | Focuses the risks on the financial sector, particularly as the risks in Europe & China could affect the US. “Not our fault!” |
| The Committee also anticipates that inflation will settle, over coming quarters, at levels at or below those consistent with the Committee’s dual mandate as the effects of past energy and other commodity price increases dissipate further. However, the Committee will continue to pay close attention to the evolution of inflation and inflation expectations. | The Committee also anticipates that inflation will settle, over coming quarters, at levels at or below those consistent with the Committee’s dual mandate. However, the Committee will continue to pay close attention to the evolution of inflation and inflation expectations. | Drops language on commodity prices. |
| To support a stronger economic recovery and to help ensure that inflation, over time, is at levels consistent with the dual mandate, the Committee decided today to continue its program to extend the average maturity of its holdings of securities as announced in September. The Committee is maintaining its existing policies of reinvesting principal payments from its holdings of agency debt and agency mortgage-backed securities in agency mortgage-backed securities and of rolling over maturing Treasury securities at auction. The Committee will regularly review the size and composition of its securities holdings and is prepared to adjust those holdings as appropriate. | To support a stronger economic recovery and to help ensure that inflation, over time, is at levels consistent with the dual mandate, the Committee decided today to continue its program to extend the average maturity of its holdings of securities as announced in September. The Committee is maintaining its existing policies of reinvesting principal payments from its holdings of agency debt and agency mortgage-backed securities in agency mortgage-backed securities and of rolling over maturing Treasury securities at auction. The Committee will regularly review the size and composition of its securities holdings and is prepared to adjust those holdings as appropriate. | No change. |
| The Committee also decided to keep the target range for the federal funds rate at 0 to 1/4 percent and currently anticipates that economic conditions–including low rates of resource utilization and a subdued outlook for inflation over the medium run–are likely to warrant exceptionally low levels for the federal funds rate at least through mid-2013. | The Committee also decided to keep the target range for the federal funds rate at 0 to 1/4 percent and currently anticipates that economic conditions–including low rates of resource utilization and a subdued outlook for inflation over the medium run–are likely to warrant exceptionally low levels for the federal funds rate at least through mid-2013. | No change. |
| The Committee will continue to assess the economic outlook in light of incoming information and is prepared to employ its tools to promote a stronger economic recovery in a context of price stability. | The Committee will continue to assess the economic outlook in light of incoming information and is prepared to employ its tools to promote a stronger economic recovery in a context of price stability. | No change. |
| Voting for the FOMC monetary policy action were: Ben S. Bernanke, Chairman; William C. Dudley, Vice Chairman; Elizabeth A. Duke; Richard W. Fisher; Narayana Kocherlakota; Charles I. Plosser; Sarah Bloom Raskin; Daniel K. Tarullo; and Janet L. Yellen. | Voting for the FOMC monetary policy action were: Ben S. Bernanke, Chairman; William C. Dudley, Vice Chairman; Elizabeth A. Duke; Richard W. Fisher; Narayana Kocherlakota; Charles I. Plosser; Sarah Bloom Raskin; Daniel K. Tarullo; and Janet L. Yellen. | No change. Won’t miss the hawks that weren’t. |
| Voting against the action was Charles L. Evans, who supported additional policy accommodation at this time. | Voting against the action was Charles L. Evans, who supported additional policy accommodation at this time. | No change. Won’t miss Evans. |
Comments
Questions for Dr. Bernanke:
I have long thought that Defined Benefit plans are the best retirement plans for workers. They are also the worst for employers. Why?
Employees are incapable of making intelligent investment decisions in aggregate, much as they like the feeling of “control.” Far better to have professionals choose investments where they don’t give in (as much) to fear and greed, and lose a lot of money in the process.
Defined benefits give retirees a fixed budget, which is good; they are not capable of managing a lump sum over a lifetime. Indeed that would tax most “professionals.” The pensions are also judgment-proof, aside from QDROs.
The cost of providing fixed benefits amid low interest rates is tough for most employers, who have seen their liabilities expand dramatically. It takes a lot more assets to provide a pension if you are investing in safe bond investments.
This is particularly true for public pensions, since they had the greatest tendency to defer making contributions to avoid raising taxes. Now they are in the soup. It will be interesting to see what the municipalities do with the pensions. There may be compromises driven over retirement benefits for future employees, current employees, and even current retirees. Then again, maybe taxes will be raised to cover the expense.
That will vary by state; some will accept more taxes, and some won’t… beyond that, some will move out of high taxation states, creating a “death spiral” for taxes, or a default/compromise on pension payments.
All that said, I can simply say that in a period of low interest rates and low returns from risk assets, it is unlikely that pension payments will be maintained in many states, unless taxes are raised, and many will oppose that, because their own retirements so not look so promising.
This is not likely to be a popular post. Just warning you.
I have a bias that modernity is more fragile than commonly believed. One aspect of that is income/wealth distributions. Inequality was far more pronounced in the past, and was fairly stable in being so. So why should the last 150 or so years not be viewed as a possible aberration?
Let me give you five or so reasons why the middle class should shrink:
1) Education — middle classes in the developed world were relatively large when the education systems produced a large portion of the educated people of the world. That is no longer so, and relative education levels have tipped against the US. Any surprise that we fall behind?
2) Lazy choices for majors/jobs — “follow your bliss” is stupid advice if no one wants to fund your bliss. All prosperity comes through serving the needs of others. Follow their bliss, not yours, and you will do well.
3) Technology — some technological advances aid equality, and some aid inequality — we have been getting more of the latter lately. If a technology aids one person to serve many at low marginal costs, it will aid inequality, unless the technology is broadly shared and used.
4) Global Conditions — Resources are scarce. Capital is somewhat scarce. Unskilled labor is not scarce. Skilled labor is somewhat scarce. For those that have not prepared themselves to be productive by having needed skills, it is a tough time. You won’t be carried along by the prosperity of your nation, because there are many others competing against you overseas, which was not true in the 50s, 60s, and 70s. (Nor even the 80s and 90s, in degree…)
5) Personal Ethics — Societies that tolerate many children conceived out of wedlock, and no-fault divorce create an underclass of poor women with children, and the children are far less able to compete because they have no father figure.
6) Politics won’t change things — this is yet another hard reality. People may vote, but money/resources “vote” more. Especially in societies where education has slumped, power gravitates to those that will better the whole, even if it means the elites get more.
Someone please send the memo to the “Occupy” crowd, and tell them that have succeeded at being the “freak show” amid changing times, but utterly irrelevant to the changes happening around the globe. If they have jobs, get to them, if not, go find one. You might be relevant then.
One thing to search for in the markets, is what entities are being unrealistic. We have a bevy of them now:
In the present environment, creditors are the unrealistic dreamers. They imagine that they will be paid back at par, when they made loans that were less than creditworthy.
In most cases, the right solution is to offer no more loans, and compromise on existing loans. The wrong solution is to extend more credit, hoping that the situation will turn, and that you will eventually be paid back at par. The result of extending more credit is that you will take much bigger losses later. Tough love produces better results than compassion, for all parties.
Yes, there may be more short-run pain, but there will be better recoveries after the crisis is over. Think of Eastern Europe — those that took the “Big Bang” did better. In this environment, creditors need to take their losses sooner, and the system will do better thereafter. To seek full payment is unrealistic.
I wrote about the thoughts of others Wednesday as I took notes on their talks. I don’t type that fast, so my notes gives synopses of the talks given.
Now for my own thoughts. I have a sympathy for anyone that wants to take monetary policy out of the hands of the government, because they don’t do it well. Some sort of hard money standard is necessary, whether gold, silver, or a commodity basket.
Ideals
I have one major ideal here, and I don’t care as much how it is accomplished: get the government out of the monetary policy business. My secondary ideal is regulating banks properly.
A gold standard could do the job, but I am not wedded to the idea. Gold standards can be inflationary or deflationary. It depends on the price at which you link the currency to gold. Post-WWI, Britain pegged it too high, and got deflation. France pegged it too low and got inflation. Getting the right level would be important. Fortunately, we know where it trades now relative to the dollar, and that would be pretty close to the right level, if the stated gold levels of the Fed and the Treasury are accurate.
Practical
A full audit of the Fed is a minimum, as is an audit of the gold at Fort Knox. Do it once, so that all doubts can be dispelled.
I think that bank regulation for leverage and asset-liability management is more critical than monetary policy itself. Banking crises stem from inadequate asset-liability management. As James Grant pointed out from the historical example that he gave, deposits should back only self-liquidating assets. Longer term assets must be backed by matching funding, or equity.
Unseasoned asset classes (i.e., asset classes for which we have no real loss statistics because they have never had failure as a group) should be disallowed as investments for banks except against surplus. After that, risk based capital should be based off of strict actuarial studies, with a significant provision against adverse deviation, and no credit for diversification. And, don’t allow banks to score their own riskiness, a la Basel. That is ridiculous; the fox guards the henhouse. If a bank has superior risk control, they will earn the results over time; they should not as a result lever up more.
Now, I really don’t care if it makes banks unprofitable, or earn less than their cost of capital. In that case, we will get fewer banks, the margins of the remainder will rise, and you end up with a genuinely stable system with occasional bank failures that don’t threaten the system as a whole.
There was one idea that I thought could be put into practice immediately, Treasury Trust Bonds optionally backed by gold. If nothing else, like TIPS, it would give the Fed another indicator on how credible their monetary policy is.
Conference Zeitgeist
The Taylor Rule got some respect. Many suggested that if it had been followed, we would not have gotten into this crisis. I’m a little less optimistic there, because bank regulation was co-opted allowing for too much risk to be taken relative to liquidity and capital.
Most felt that the Fed was the major player in causing the crisis, with the GSEs playing a lesser role. The overpromotion of home ownership, and the constant provision of liquidity to the markets led borrowers to become reckless amid asset price inflation.
Incentives also played a role. Managerial and shareholder liability at banks would help prevent reckless behavior. Wall Street worked better when it was a bunch of partnerships, rather than limited liability corporations.
Most thought that things are worse now than the ’70s. The debt levels are higher, which makes demand punk, and businessman more skittish to expand and hire. Government policy is less predictable as well.
The speakers largely expect more inflation; more debt monetization is the path of least resistance. Politicians get what they want without a vote being taken. On the question of where to invest, everyone was an inflationist. Gold, silver, TBT, were trotted out. Personally, I’ll stick with my stock investing.
People
Jeffrey Lacker showed courage in coming to the conference. He made a really good point that the Fed should focus on its liability policies, and limit itself to investing in Treasuries. The Fed gets bad press and popular dislike when it uses its assets for special lending programs and bailouts, leading to charges of favoritism.
Zoellick was a reasonable guy regarding the problems in the Eurozone. Germany has to figure out what it wants. To me, it boils down to this:
Personally, I would choose #2, because people in Europe identify themselves with their nations, not as Europeans. Political and economic systems must derive from cultural systems or they will not work in the long haul.
It was fun seeing my old professor, Dr. Steven Hanke. I reminded him of nine years earlier, when he gave a talk to the (then called) Baltimore Security Analysts Society, and we discussed why we thought the Euro would have a tough time surviving. Most of that discussion is now taking place.
Ron Paul was Ron Paul. He doesn’t change much — that’s one of his apolitical virtues.
John A. Allison was entertaining; he argued that capital levels are too low, and regulation too high. He thinks that you can’t expect much, and don’t get much from regulation. Especially interesting were the discrimination in lending allegations by the regulators that BB&T fought and won twice.
Conferences like this attract cranks. Lots of people with odd political agendas hoping to get noticed, others with odd business propositions.
Other
As a final note, the concept of free banking and/or competitive currency issuance, I think invites more problems than it solves. Think of it this way: people aren’t very good at evaluating financial promises. The fewer the better, and the lower level of complexity, the better as well. There has to be some monitoring of financial promises, some intelligent regulation of banks, or things can go badly wrong. US history backs such an idea up, regardless of whether we have a gold-, silver-, or commodity-backed currency, or a fiat currency as we do now.
Update — thanks to Eddy Elfenbein for catching a typo/thoughtless mistake in paragraph 4. For France, it was inflation, not deflation.
CLOSING ADDRESS
John A. Allison
Former Chairman and CEO, BB&T, and Distinguished Professor of Practice, Wake Forest University
Problems primarily caused by government policy, loose Fed policy, GSE policies.
Fed jobs: payment systems, bank regulator and monetary policy
Payment system monopoly benefits inefficient small banks.
Regulation: FDIC insurance destroys market discipline. Financing using FDIC-insured deposits to make real estate loans.
Fed failed to oversee other regulators.
Private deposit insurance a la Bert Ely was possible. (?!)
Now-discredited study Boston Fed on discrimination in lending. Loosened loan standards as a result.
BB&T fought it and was found not to discriminate. Still fought it, until Republicans were elected and the investigations was dropped. Same under Obama administration, until Republicans were elected and the investigations was dropped.
CRA eliminate redlining — banks don’t do well with low-quality lending. Worked so long as home prices were rising, but gave the rating agencies the wrong loss factors that blew up when the bust happened.
Grossly misregulated during Bush, Jr. Administration — Privacy, Patriot Act, etc. Only Spitzer caught. Wasted a lot of management time which lead to less true risk control.
Would eliminate regulations before taxes. (DM: of course, taxes are easier to fuddle)
Regulators don’t catch things proactively. No surprise, because regulators don’t act during the boom phase because everything is going well. Describes a junky bank that BB&T passed on, until it went bankrupt.
In the bad times, regulators irrationally tighten. BB&T no longer will make good loans that they used to. FDIC was worse now than the early 80s & 90s. Affects small banks most.
Price controls: no one at Fed believes in it, yet the FOMC triues to regulate interest rates.
Greenspan most regularly ran policy with negative real interest rates, helping to create a bubble, until he finally began his last tightening. Bernanke inverted the yield curve, banks took more credit risk to compensate, worst loans were made then.
Fed held prices up in the ’20s by holding prices up when they should have been falling. Hidden asset bubble. Prices should have been falling in the 2000s with the addition of new labor to the capitalist system from China and India. The process of inflating incented jobs overseas, aside from home construction jobs.
Fed policy today is destructive and lowering productivity. Private equity guys he talked to are not changing their hurdle rates.
Current policy robs savers for borrowers. Humiliating many older savers (DM: makes them take too much risk also).
If Congress can print money via the Fed, they will do so.
Who do enslave via regulation?
Short-term versus the long-term, we pick the short run… leading to inflation away of debts, and loss of responsibility.
Life, liberty and the pursuit of happiness… takes a dig indirectly at the gift and estate taxes… free to give it away. (DM: perhaps it should have been pursuit of virtue, or serving Christ, but that wouldn’t have fit the Founders)
Self-esteem mainly comes from work? (?!) An encouragement to do your best. Welfare lowers self-worth.
Q&A
Why should intervention not have occurred in the credit markets?
After making so many mistakes creating too much credit and a pseudo-boom, it was required after that. After that, the bailouts were not predictable. The losses were not going to be so big.
Makes a mistake saying the insurance industry would not have been affected by the failure of AIG.
Disses Paulson (investment bank unsystematic), Bernanke (Academic) and Geithner.
Should bank executives have personal liability?
No. Thinks capital ratios should be 25%.
Why did they bail out Bear Stearns?
No good reason, thought it would be one-time.
Big rise in the monetary base?
Inflation, Stagflation coming. No unemployment in a truly free economy. (?!)
Page optimized by WP Minify WordPress Plugin