Category: Quantitative Methods

Avoid Complexity in Limiting Risk

Picture Credit: Olivier ROUX || Simplicity almost always beats complexity.

I’m not a fan of EIAs. I’m not a fan of variable annuities, unless they’re really simple with rock-bottom expenses and no surrender charges. I’m not a fan of ETNs. I hate structured notes. I’m also not a fan of ETFs that are filled with derivatives.

Ten years ago, I wrote a piece called The Good ETF. It is still as valid now as before, along with its companion piece The Good ETF, Part 2 (sort of). And for Commodity ETFs, there was: Fusion Solution: The Stable Value Fund Guide to Commodity ETF Management. If you are rolling futures in an ETF, it had better be done like a short bond ladder.

You can add in the pieces that I wrote before and when the short volatility ETFs imploded. What did it say in The Good ETF?

Good ETFs are:

* Small compared to the pool that they fish in
* Follow broad themes
*
Do not rely on irreplicable assets
*
Storable, they do not require a ?roll? or some replication strategy.
*
not affected by unexpected credit events.
*
Liquid in terms of what they represent, and liquid it what they hold.

The last one is a good summary.? There are many ETFs that are Closed-end funds in disguise.? An ETF with liquid assets, following a theme that many will want to follow will never disappear, and will have a price that tracks its NAV.

The Good ETF

But tonight I have another complex investment to avoid, and a simple one to embrace. First the avoid…

There was a piece at Bloomberg Businessweek called ETFs With Downside Protection? It?s Complicated. These are called defined outcome ETFs. Basically they are a bundle of equity options that cut your losses, while limiting your gains on a given equity index. (Also, you don’t get dividend income, and have to pay manager fees.) In-between the cap on gains, and where losses kick in, your returns should move 1:1 with the index. The same will be true with losses after the first N% get eaten — below N% losses, you begin taking losses.
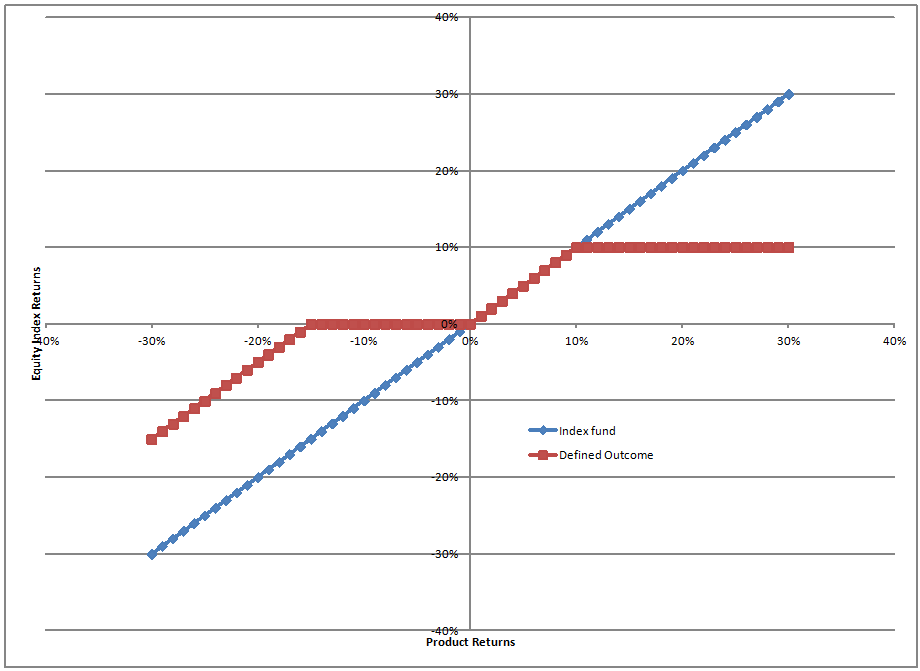
Illustration of Defined Outcome ETF returns as compared to an index fund using the same index as the Defined Outcome ETF

I wanted to keep the illustration simple. This hypothetical defined outcome ETF caps gains at 10%, and absorbs the first 15% of losses. This example assumes no fees, which would likely be lower on the index fund. This example assumes no dividends, which would get paid to you in the index fund, but not on the defined outcome ETF.

Defined outcome ETFs purchase and sell tailored options that are backed by the central counterparty the Options Clearing Corporation — a very strong, stable institution. Credit risk still exists, but if the OCC goes down, many things will be in trouble. The options exist for one year, after which gains are paid to and losses absorbed by ETF shareholders. The ETF then resets to start another year following the same strategy with slightly different levels because the relative amounts of the cap and the loss buffering rely on where equity volatility is for a given index at the start of the year.

Unlike an index fund, your gains cannot grow tax-deferred, though if you have gains, you can roll them over into the next year.

I’ve read the offering documents, including the sections on risk. My main argument with the product is that you give up too much upside for the downside protection. The really big up years are the places where you make your money. There aren’t so many “average” years. The protection on the downside is something, but in big down years it could be cold comfort.

The second part is the loss of dividends and paying higher fees. Using the S&P 500 as a proxy, a 2% dividend lost and a 0.5% added fee adds up to quite a cost.

There are implementation risks and credit risks but these risks are small. I ran a medium-sized EIA options book for a little more than a year. This is not rocket science. The investor who is comfortable with options could create this on his own. They list more risks in the offering documents, but they are small as well. What gets me are the costs, and the upside/downside tradeoff.

A Better, if Maligned Investment

Recently Bank of America declared ?the end of the 60-40? standard portfolio. I think this was foolish, and maligns one of the best strategies around — the balanced fund.

Yes, interest rates are low. Yields on some stocks are higher than the yields on the Barclays’ Aggregate [bond] Index. But if you only bought those bonds, you would have a rather unbalanced portfolio from a sector standpoint — heavy on utilities and financials. The Barclays’ Aggregate still outyields the S&P 500, if not by much, like 0.8%/yr.

The real reason that you hold bonds and cash equivalents is not the income; it is risk reduction. I’m assuming no one is thinking of buying the TLT ( 20+ Year Treas Bond Ishares ETF), which is more of a speculator’s vehicle, but something more like AGG ( US Aggregate Bond Ishares Core ETF), which yields 0.3% more, but the overall volatility is a lot less.

With AGG, fixed income claims of high investment grade entities will make it through a deflationary crisis. In an inflationary situation like the 70s, the bonds are short enough that over a five year period, you should make money, just not in real terms.

It’s good to think long term, and have a mix of fixed and variable claims. The bonds (fixed claims) lower your volatility so that you don’t get scared out of your stocks (variable claims) in a serious downdraft.

The models I have run have returns max out in an 80/20 balanced fund, and the trade-off of risk for return is pretty good down to a 60/40 balanced fund. In my personal investing, I have always been between 80/20 and 60/40.

As it is, if you are looking the likely returns on the S&P 500 over the next ten years, it’s about the same return available on a A3/A- corporate bond, but with a lot more volatility.

Thus the need for bonds. In a bad scenario, stocks will fall more than bonds, and the balanced fund will buy stocks using proceeds of the bonds that have fallen less to buy stocks more cheaply. And if the stock market rises further, the balanced fund will sell stocks and use the proceeds to bank the gains by buying bonds that will offer future risk reduction, and some income.

As such, consider the humble balanced fund as a long-term investment vehicle that is simple and enduring, even when rates are low. And avoid complexity in your investment dealings. It is almost never rewarded.

ETFs Increase Correlations, but not Overall Amplitude

Photo Credit: Steve @ the alligator farm

Recently in a tweet, I said:

Index Fund Investment Strategy: Michael Burry Warns of Bubble @Bloomberg https://bloomberg.com/news/articles/2019-09-04/michael-burry-explains-why-index-funds-are-like-subprime-cdos? The most this would do is increase the correlation of the movements. Unit creation & liquidation serve the same role as futures arbitrage programs that have existed since the mid-80s

https://twitter.com/AlephBlog/status/1179927420884983809

I am not in the crowd that thinks that indexing or ETFs will create a crisis. As I have said before, long-term performance of assets relies on the underlying productivity of the businesses issuing the assets. Short-term performance is also affected by the behavior of secondary market traders, but those effects get eventually washed out by the underlying productivity of the businesses issuing the assets.

And there you have it in slightly different garb: Ben Graham’s weighing machine versus the voting machine. The voting machine is transitory. The weighing machine is permanent. After all, think of a private business — it only has the weighing machine, and it does well enough producing cash flow for the owners, creditors, etc., without the sideshow of the price of its stock and bonds being publicly estimated each day.

In this case, the voting machine has people buying and selling bundles of stocks. But what does that replace? People owning equivalent amounts of individual stocks. People have varying propensities toward panic and greed. Those who would have sold their stocks in a panic or bought stocks in a bullish frenzy will do the same with the ETFs that they hold. It will be the same amount of selling pressure in aggregate.

Now, it is possible that some stocks are misrepresented in the ETFs in which they reside. My favorite example is refiners in the Energy Select Sector SPDR Fund (XLE) . The economics of most stocks in XLE are positively geared off of crude oil and natural gas prices. Refiners, unless they are gambling on their hedges, usually don’t hedge fully, and the economics are negatively geared to energy prices. Ever since XLE became popular, the refiners often trade in tandem in the short run with the rest of the Energy stock complex.

So what happens? Refiners then correct after a bull run of energy prices when their earnings don’t reflect the stock price. Vice-versa for positive earnings surprises in a bear phase for energy prices.

Summary

ETFs do present some anomalies for the markets, but they are localized to the sectors or strategies that are being pursued. For the market as a whole, they are simply pass-through vehicles that have little to no macro effects, aside from increasing short-run price correlation between stocks in the largest ETFs.

The Balance: Considering Event-Driven Investing

The Balance: Considering Event-Driven Investing

Photo credit: miltarymark2007

===========================

I published another article at The Balance:?Considering Event-Driven Investing.? This is one place where writing in the third person leaves a lot out.? I’ve done a lot with some types of event-driven investing.

  • Speculating on hurricanes — I did that successfully at the hedge fund 2004, 2005 and 2006.? 2006 because I thought the risk of another strong hurricane year was overplayed.? 2004 and 2005 because I had a good idea of who was underreporting claims after disasters.? That was the only time in my life that I went from long a company to short without stopping, and I covered on the day the CEO resigned, and caught the bottom tick.
  • Bond deal arbitrage — well, sort of.? I would buy target company bonds and sell the bonds of the parent.? I had to be certain that the deal would go through, but it was a tremendous yield enhancement is the right situations.
  • From the prior article, speculating on Lula’s non-impact on Brazil qualifies as event-driven.
  • Stock arbitrage — did a lot with it when I was younger.? Didn’t do so well.
  • Index arbitrage — did a neutral trade where we shorted one company out of the Russell 2000, and bought another one in.? Made no money on the trade.? We had a good fundamental justification for the trade, but it just goes to show you that this isn’t as easy as it looks.
  • I buy a decent number of spinoffs.? Most succeeded as investments for me.

Now, all that said, most areas where there are simple arbitrages typically boil down to a simple credit risk: will the deal get completed? Will the company not take an action that changes its capital structure in a way that hurts me?

Since these are relatively simple trades, the returns are relatively low like that on a short-term junk bond — at present, like the yield on T-bills plus 2-3%.? It’s not very compelling given the risks involved.? Most of the mutual funds that do that type of arbitrage have not done so well.

Thus, aside from spinoffs, at present, I don’t do that much with event-driven investing.? Many of the forms of it are too crowded, and I prefer simplicity in investing.

Estimating Future Stock Returns, December 2017 Update

Estimating Future Stock Returns, December 2017 Update

The future return keeps getting lower, as the market goes higher

=================

Jeff Bezos has a saying, “Your margin is my opportunity.”? He has found ways to eat the businesses of others by providing the same goods and services at a lower cost.? Now, that makes Amazon more productive and others less productive.? The same is true of other internet-related businesses like Google, Netflix, etc.

And, there is a slight net benefit to the economy from the creative destruction.? Old capital gets recycled.? Malls that are no longer so useful serve lower-margin businesses for locals, become homes to mega-churches, other area-intensive human gatherings, or get destroyed, and the valuable land so near many people gets put to alternative uses that are better than the mall, but not as profitable as the mall prior to the internet.

Laborers get released to other work as well.? They may get paid less than they did previously, but the system as a whole is more productive, profits rise, even as wages don’t rise so much.? A decent part of that goes to the pensions of oldsters — after all, who owns most of the stock?? Indirectly, pension plans and accounts own most of it.? As I have sometimes joked, when there are layoffs because institutional investors representing pension plans? are forcing companies to merge, or become more efficient in other ways, it is that the parents are laying off their children, because there are cheaper helpers that do just as well, and the added profits will aid their deservedly lush retirement, with little inheritance for their children.

It is a joke, though seriously intended.? Why I am mentioning it now, is that a hidden assumption of my S&P 500 estimation model is that the return on assets in the economy as a whole is assumed to be constant.? Some will say, “That can’t be true.? Look at all of the new productive businesses that have been created! The return on assets must be increasing.”? For every bit of improvement in the new businesses, some of the old businesses are destroyed.? There is some net gain, but the amount of gain is not that large in aggregate, and these changes have been happening for a long time.? Technological progress creates and destroys.

As such, I don’t think we are in a “New Era.”? Or maybe we are always in a “New Era.”? Either way, the assumption of a constant return on assets over time doesn’t strike me as wrong, though it might seem that way for a decade or two, low or high.

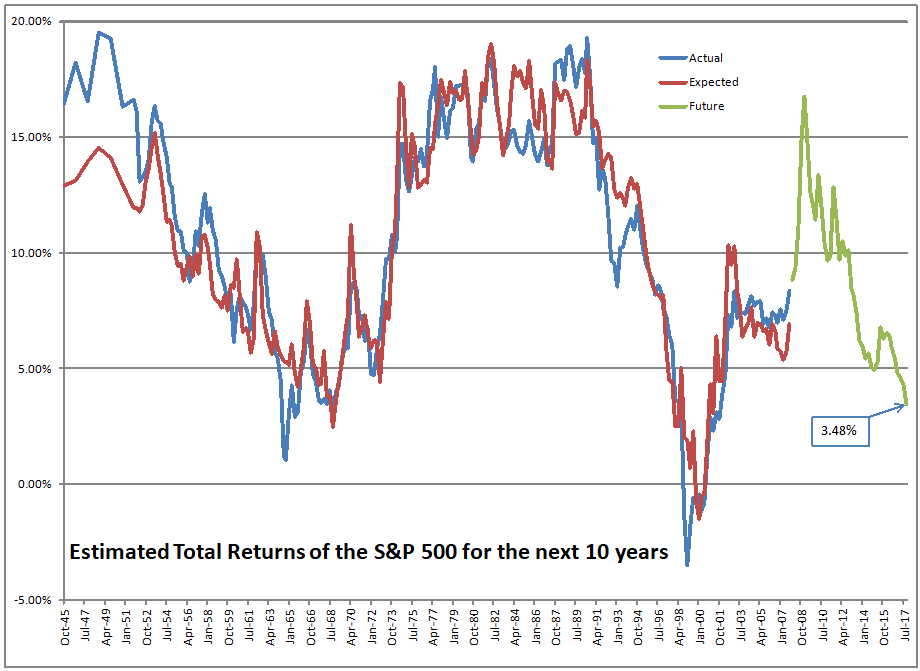
As it is today, the S&P 500 is priced to deliver returns of 3.24%/year not adjusted for inflation over the next ten years.? At 12/31/2017, that figure was 3.48%, as in the graph above.

We are at the 95th percentile of valuations.? Can we go higher?? Yes.? Is it likely?? Yes, but it is not likely to stick.? Someday the S&P 500 will go below 2000.? I don’t know when, but it will.? There are enough imbalances in the world — too many liabilities relative to productivity, that crises will come.? Debt creates its own crises, because people rely on those payments in the short-run, unlike stocks.

There are many saying that “there is no alternative” to owning stocks in this environment — the TINA argument.? I think that they are wrong.? What if I told you that the best you can hope for from stocks over the next 10 years is 4.07%/year, not adjusted for inflation?? Does 1.24%/year over the 10-year Treasury note really give you compensation for the additional risk?? I think not, therefore bonds, low as they may be, are an alternative.

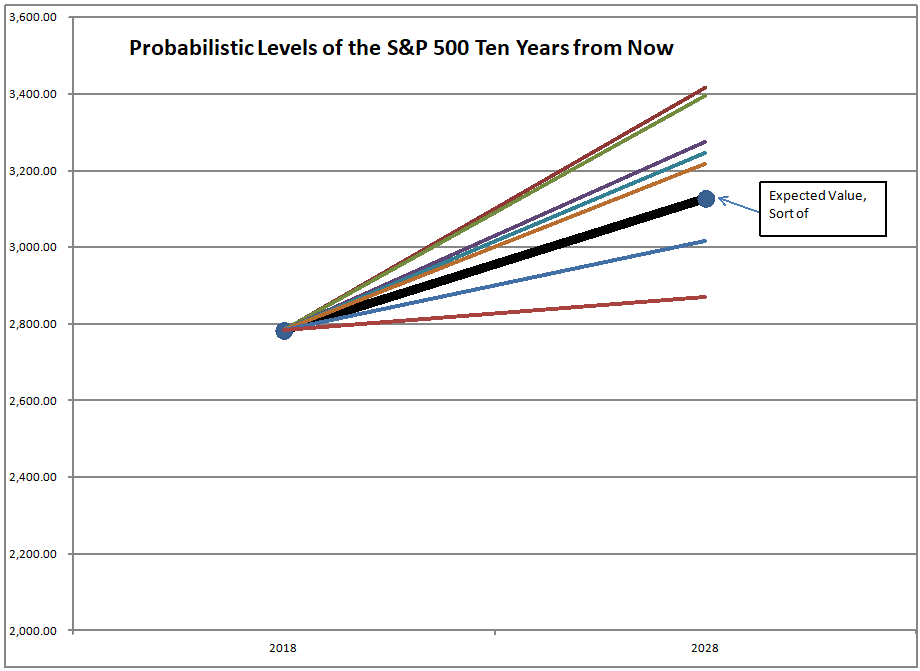
The top line there is a 4.07%/year return, not adjusted for inflation

If you are happy holding onto stocks, knowing that the best scenario from past history would be slightly over 3400 on the S&P 500 in 2028, then why not buy a bond index fund like AGG or LQD that could virtually guarantee something near that outcome?

Is there risk of deflation?? Yes there is.? Indebted economies are very susceptible to deflation risk, because wealthy people with political influence will always prefer an economy that muddles, to higher taxes on them, inflation, or worst of all an internal default.

That is why I am saying don’t assume that the market will go a lot higher.? Indeed, we could hit levels over 4000 on the S&P if we go as nuts as we did in 1999-2000.? But the supposedly impotent Fed of that era raised short-term rates enough to crater the market.? They are in the process of doing that now.? If they follow their “dot plot” to mid-2019 the yield curve will invert.? Something will blow up, the market will retreat, and the next loosening cycle will start, complete with more QE.

Thus I am here to tell you, there is an alternative to stocks.? At present, a broad market index portfolio of bonds will likely outperform the stock market over the next ten years, and with lower risk.? Are you ready to make the switch, or at least, raise your percentage of safe assets?

On a Letter from an Old Friend

On a Letter from an Old Friend

Photo Credit: jessica wilson {jek in the box}

David:

It’s been a while since we last corresponded.??I hope you and your family are well.

Quick investment question. Given the sharp run-up in equities and stretched valuations, how are you positioning your portfolio?

This in a market that seemingly doesn’t?go down, where the risk of being cautious is missing out on big gains.

In my portfolio, I’m carrying extra cash and moving fairly aggressively into gold.?Also, on the fixed income side, I’ve been selling HY [DM: High Yield, aka “Junk”] bonds, shortening duration, and buying floating rate bank loans.

Please let me know your thoughts.

Regards

JJJ

Dear JJJ,

Good to hear from you.? It has been a long time.

Asset allocation is always a marriage between time horizon (when is the money needed for spending?) and expected returns, with some adjustment for risk.? I suspect that you are like me, and play for a longer horizon.

I’m at my lowest equity allocation in 17 years.? I am at 65% in equities.? If the market goes up another 4-5%, I am planning on peeling of 25% of that to go into high quality bonds.? Another 20% will go if the market rises 10% from here.? At present, the S&P 500 offers returns of just 3.4%/year for the next ten years unadjusted for inflation.? That’s at the 95th percentile, and reflects valuations of the dot-com bubble, should we rise that far.

The stocks that I do have are heading in three directions: safer, cyclical and foreign.? I’m at my highest level for foreign stocks, and the companies all have strong balance sheets.? A few are cyclicals, and may benefit if commodities rise.

The only thing that gives me pause regarding dropping my stock percentage is that a lot of “friends” are doing it.? That said, a lot of broad market and growth investors are making “new era” arguments.? That gives me more comfort about this.? Even if the FAANG stocks continue to do well, it does not mean that stocks as a whole will do well.? The overall productivity of risk assets is not rising.? People are looking through the rearview mirror, not the windshield, at asset returns.

I can endorse some gold, even though it does nothing.? Nothing would have been a good posture back in the dot-com bubble, or the financial crisis.? Commodities are undervalued at present.? I can also endorse long Treasuries, because I am not certain that inflation will run in this environment.? When economies are heavily indebted they tend not to inflate, except as a last resort.? (The wealthy want to protect their claims against the economy.? The Fed generally helps the wealthy.? Those on the FOMC are all wealthy.)

I also hold more cash than normal.? The three of them, gold, cash and long Treasury bonds form a good hedge together against most bad situations.

The banks are in good shape, so the coming troubles should not be as great as during the financial crisis, as long as nothing bizarre is going on in the repo markets.

That said, I would be careful about bank debt.? Be careful about the covenants on the bank debt; it is not as safe as it once was.? I don’t own any now.

Aside from that, I think you are on the right track.? The most important question is how much you have invested in risk assets.? Prudent investors should be heading lower as the market rises.? It is either not a new era, or, it is always a new era.? Build up your supply of safe assets.? That is the main idea.? Preserve capital for another day when risk assets offer better opportunities.

Thanks for writing.? If you ever make it to Charm City or Babylon, let me know, and we can have lunch together.

Sincerely,

David

Since 1950, the S&P 500 in 2017 Ranks First, Fourth, Tenth or Twenty-third?

Since 1950, the S&P 500 in 2017 Ranks First, Fourth, Tenth or Twenty-third?

Credit: Roadsidepictures from The Little Engine That Could By Watty Piper Illustrated By George & Doris Hauman c. 1954

=========================================

I wish I could have found a picture of Woodstock with a sign that said “We’re #1!”? Snoopy trails behind carrying a football, grinning and thinking “In this corner of the backyard.”

That’s how I feel regarding all of the attention that has been paid to the S&P being up every month in 2017, and every month for the last 14 months.? These have never happened before.

There’s a first time for everything, but I feel that these records are more akin to the people who do work for the sports channels scaring up odd statistical facts about players, teams, games, etc.? “Hey Bob, did you know that the Smoggers haven’t converted a 4th and 2 situation against the Robbers since 1998?”

Let me explain.? A month is around 21 trading days.? There is some variation around that, but on average, years tend to have 252 trading days.? 252 divided by 12 is 21.? You would think in a year like 2017 that it must? have spent the most time where 21-day periods had positive returns, as it did over each month.

Since 1950, 2017 would have come in fourth on that measure, behind 1954, 1958 and 1995.? Thus in one sense it was an accident that 2017 had positive returns each month versus years that had more positive returns over every 21 day period.

How about streaks of days where the 21-day trialing total return never dropped below zero (since 1950)?? By that measure, 2017 would have tied for tenth place with 2003, and beaten by the years 1958-9, 1995, 1961, 1971, 1964, 1980, 1972, 1965, and 1963.? (Note: quite a reminder of how bullish the late 1950s, 1960s and early 1970s were.? Go-go indeed.)

Let’s look at one more — total return over the whole year.? Now 2017 ranks 23rd out of 68 years with a total return of 21.8%.? That’s really good, don’t get me wrong, but it won’t deserve a mention in a book like “It Was a Very Good Year.”? That’s more than double the normal return, which means you’ll have give returns back in the future. 😉

So, how do I characterize 2017?? I call it?The Little Market that Could.? Why?? Few drawdowns, low implied volatility, and skepticism that gave way to uncritical belief.? Just as we have lost touch with the idea that government deficits and debts matter, so we have lost touch with the idea that valuation matters.

When I talk to professionals (and some amateurs) about the valuation model that I use for the market, increasingly I get pushback, suggesting that we are in a new era, and that my model might have been good for an era prior to our present technological innovations.? I simply respond by saying “The buying power has to come from somewhere.? Our stock market does not do well when risk assets are valued at 40%+ of the share of assets, and there have been significant technological shifts over my analysis period beginning in 1945, many rivaling the internet.”? (Every era idolizes its changes.? It is always a “new era.”? It is never a “new era.”)

If you are asking me about the short-term, I think the direction is up, but I am edgy about that.? Forecast ten year returns are below 3.75%/year not adjusted for inflation.? Just a guess on my part, but I think all of the people who are making money off of low volatility are feeding the calm in the short-run, while building up a whiplash in the intermediate term.

Time will tell.? It usually does, given enough time.? In the intermediate-term, it is tough to tell signal from noise.? I am at my maximum cash for my equity strategy accounts — I think that is a prudent place to be amid the high valuations that we face today.? Remember, once the surprise comes, and companies scramble to find financing, it is too late to make adjustments for market risk.

Classic: Wrecking Ball Looms for Big Housing Spec

Classic: Wrecking Ball Looms for Big Housing Spec

Photo Credit: Rhys A.

====================

I thought this old post from RealMoney.com was lost, never to be found again.? This was the important post made on November 22, 2006 that forecast some of the troubles in the subprime residential mortgage backed securities market.? I favored the idea that there there would be a crash in residential housing prices, and the best way to play it would be to pick up the pieces after the crash, because of the difficulties of being able to be right on the timing of shorting could be problematic.? In that trade, too early would mean wrong if you had to lose out the trade because of margin issues.

With that, here is the article:

====================

I have tried to make the following topic simple, but what I am about to say is complex, because it deals with the derivative markets. It is doubly or triply complex, because this situation has many layers to unravel. I write about this for two reasons. First, since residential housing is a large part of the US economy, understanding what is going on beneath the surface of housing finance can be valuable. Second, anytime financial markets are highly levered, there is a higher probability that there could be a dislocation. When dislocations happen, it is unwise for investors to try to average down or up. Rather, the best strategy is to wait for the trend to overshoot, and take a contrary position.


There are a lot of players trotting out the bear case for residential housing and mortgages. I’m one of them, but I don’t want overstate my case, having commented a few weeks ago on derivatives in the home equity loan asset-backed securities market. This arcane-sounding market is no small potatoes; it actually comprises several billions of dollars’ worth of bets by aggressive hedge funds — the same type of big bettors who blew up so memorably earlier this year, Amaranth and Motherrock.


A shift of just 10% up or down in residential housing prices might touch off just such another cataclysm, so it’s worth understanding just how this “arcane-sounding” market works.


I said I might expand on that post, but the need for comment and explanation of this market just got more pressing: To my surprise, one of my Googlebots dragged in a Reuters article and a blog post on the topic. I’ve seen other writeups on this as well, notably in Grant’s Interest Rate Observer (a fine publication) and The Wall Street Journal.

How a Securitization Works (Basically)


It’s difficult to short residential housing directly, so a market has grown up around the asset-backed securities market, in which bulls and bears can make bets on the performance of home equity loans. How do they do this?


First, mortgage originators originate home equity loans, Alt-A loans and subprime loans. They bring these loans to Wall Street, where the originator sells the loans to an investment bank, which dumps the loans into a trust. The investment bank then sells participation interests (“certificates”) in the trust.


There are different classes of certificates that have varying degrees of credit risk. The riskier classes receive higher interest rates. Typically the originator holds the juniormost class, the equity, and funds an overcollateralization account to give some security to the next most junior class.


Principal payments get allocated to the seniormost class. Once a class gets its full share of principal paid (or cancelled), it receives no more payments. Interest gets allocated in order of seniority. If, after paying interest to all classes, there is excess interest, that excess gets allocated to the overcollateralization account, until the account is full — that is, has reached a value equal to the value of the second most junior class of trust certificates — and then the excess goes to the equity class. If there’s not enough interest to pay all classes, they get paid in order of seniority.


If there are loan losses from nonpayment of the mortgages or home equity loans, the losses get funded by the overcollateralization account. If the overcollateralization account gets exhausted, losses reduce the principal balances of the juniormost certificates — those usually held by the originator — until they get exhausted, and then the next most junior gets the losses. There’s a little more to it than this (the prospectuses are often a half-inch thick on thin paper), but this is basically how a securitization works.


From Hedging to Speculation


The top class of certificates gets rated AAA, and typically the lowest class before the equity gets rated BBB-, though sometimes junk-rated certificates get issued. Most of the speculation occurs in securities rated BBB+ to BBB-.


The second phase of this trade involves credit default swaps (CDS). A credit default swap is an agreement where one party agrees to make a payment to another party when a default takes place, in exchange for regular compensation until the agreement terminates or a default happens. This began with corporate bonds and loans, but now has expanded to mortgage- and asset-backed securities.


Unlike shorting stocks, where the amount of shorting is generally limited by the float of the common stock, there can be more credit default swaps than bonds and loans. What began as a market to allow for hedging has become a market to encourage speculation.


With CDS on corporate debt, it took eight years for the notional size (amount to pay if everyone defaulted) of the CDS market to become 4 times the size of the corporate bond market. With CDS on home equity asset-backed securities, it took less than 18 months to get to the same point.


The payment received for insuring the risk is loosely related to the credit spread on the debt that is protected. Given that the CDS can serve as a hedge for the debt, one might think that the two should be equal. There are a couple reasons that isn’t so.


First, when a default happens, the bond that is the cheapest to deliver gets delivered. That option helps to make CDS trade cheap relative to credit spreads. But a bigger factor is who wants to do the CDS trading more. Is it those who want to receive payment in a default, or those who want to pay when a default occurs?

How It Impacts Housing


With CDS on asset-backed securities, the party writing protection makes a payment when losses get allocated to the tranche in question. Most protection gets written on tranches rated BBB+ to BBB-.


This is where shorting residential housing comes into the picture. There is more interest in shorting the residential housing market through buying protection on BBB-rated home equity asset-backed securities than there are players wanting to take on that risk at the spreads offered in the asset-backed market at present. So, those who want to short the market through CDS asset-backed securities have to pay more to do the trade than those in the cash asset-backed securities market receive as a lending spread.


One final layer of complexity is that there are standardized indices (ABX) for home equity loan asset-backed securities. CDS exists not only for the individual asset-backed securities deals, but also on the ABX indices as well. Those not wanting to do the credit work on a specific deal can act on a general opinion by buying or selling protection on an ABX index as a whole. The indices go down in quality from AAA to BBB-, and aggregate similar tranches of the individual deals. Those buying protection receive pro-rata payments when losses get allocated to the tranches in their index.


So, who’s playing this game? On the side of falling housing prices and rising default rates are predominantly multi-strategy and mortgage debt hedge funds. They are paying the other side of the trade around 2.5% per year for each dollar of home equity asset-backed securities protection bought. (Deals typically last four years or so.) The market players receiving the 2.5% per year payment are typically hedge and other investment funds running collateralized debt obligations. They keep the equity piece, which further levers up their returns. They are fairly yield-hungry, so from what I’ve heard, they’re none too picky about the risks that they take down.


Who wins and who loses? This is tricky, but if residential real estate prices fall by more than 10%, the buyers of asset-backed securities protection will probably win. If less, the sellers of protection probably win. This may be a bit of a sideshow in our overly leveraged financial markets, but the bets being placed here exceed ten billion dollars of total exposure. Aggressive investors are on both sides of this trade. Only one set of them will end up happy.


But how can you win here? I believe the safest way for retail investors to make money here is to play the reaction, should a panic occur. If housing prices drop severely, and home equity loan defaults occur, and you hear of hedge fund failures resulting, don?t act immediately. Wait. Watch for momentum to bottom out, or at least slow, and then buy the equities of financially strong homebuilders and mortgage lenders, those that will certainly survive the downturn.

If housing prices rise in the short run (unlikely in my opinion), and you hear about the liquidations of bearish hedge funds, then the best way to make money is to wait. Wait and let the homebuilders and mortgage finance companies run up, and then when momentum fails, short a basket of the stocks with weak balance sheets.

Why play the bounce, rather than try to bet on the success of either side? The wait could be quite long before either side loses? Do you have enough wherewithal to stay in the trade? Most players don?t; that?s why I think that waiting for one side or the other to prevail is the right course. Because both sides are levered up, there will be an overshoot. Just be there when the momentum fails, and play the opposite side. Personally, I?ll be ready with a list of homebuilders and mortgage lenders with strong balance sheets. Though prospects are not bright today, the best will prosper once the crisis is past.

Short-Term Rational, but Intermediate-Term Irrational

Short-Term Rational, but Intermediate-Term Irrational

Don’t look at the left side of the chart on an empty stomach

==================

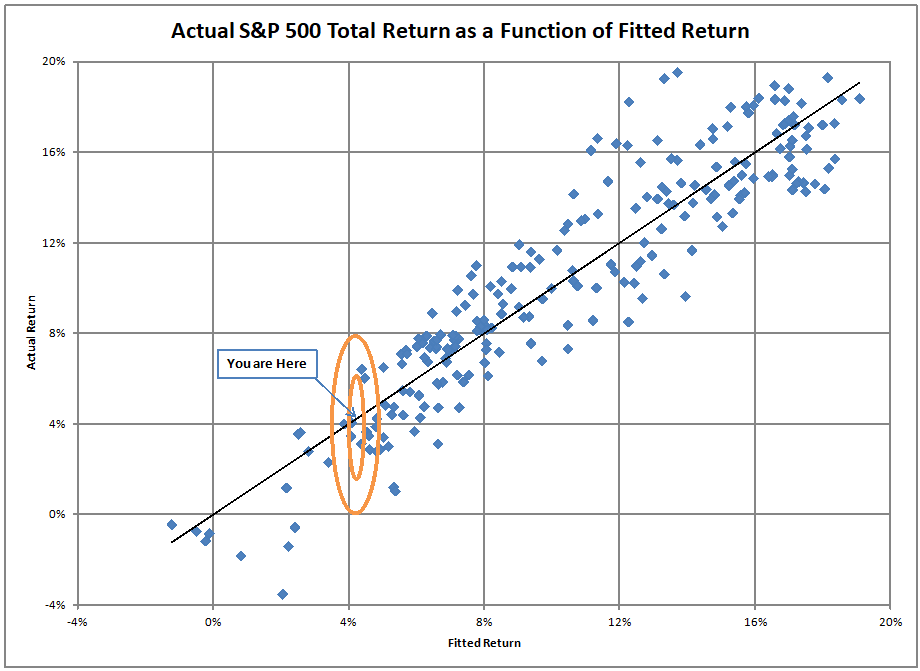
This will be a short post.? At present the expected 10-year rate of total return on the S&P 500 is around 4.05%/year.? We’re at the 94th percentile now.? The ovals on the graph above are 68% and 95% confidence intervals on what the actual return might be.? Truly, they should be two vertical lines, but this makes it easier to see.? One standard deviation is roughly equal to two percent.

But, at the left hand side of the graph, things get decidedly non-normal.? After the model gets to 2.5% projected returns, presently around 3100 on the S&P 500, returns in the past have been messy.? Of course, those were the periods from 1998-2000 to 2008-2010.? But aside from one stray period starting in 1968, that is the only time we have gotten to valuations like this.

My last piece hinted at this, but I want to make this a little plainer.? For sound effects while reading this, you could get your children or grandchildren to murmur behind you “We know it can’t. We know it can’t.” while you consider whether the market can deliver total returns of 7%/year over the next 10 years.

There are few if any things that remain permanently valid insights of finance.? Anything, even good strategies, can be overdone.? Even stable companies can be overlevered, until they are no longer stable.

In this case, it is buying the dips, buying a value-weighted cross section of the market, and putting your asset allocation on autopilot.? Set it and forget it.? Add in companies always using spare capital to buy back shares, and maxing out debts to fit the liberal edge of your preferred rating profile.

These have been good ideas for the past, but are likely to bite in the future.? Value is undervalued, safety is undervalued, and the US is overvalued.? A happy quiet momentum has brought us here, and for the most part it has been calm, not wild.? Individually prudent actions that have paid off in the past are likely to prove imprudent within three years, particularly if the S&P 500 rises 10-15% more in the next year.

People have bought into the idea that market timing never matters.? I agree with the idea that it usually doesn’t matter, and that it is usually is a fool’s game to time the market.? That changes when the 10-year forward forecast of market returns gets low, say, around 3%/year.

Remember, the market goes down double-speed.? Just because the 10-year returns don’t lose much, doesn’t mean that there might not be better opportunities 3-5 years out, when the market might offer returns of 6%/year or higher.

Also, remember that my data set begins in 1945.? I wish I had the values for the 1920s, because I expect they would be even further to the left, off the current graph, and well below the bottom of it.

This isn’t the most nuts that things can be.? In fact, it is very peaceful and steady — the cumulative effect of many rational decisions based off of what would have worked best in the past, in the short-run.

As a result, I am looking 10 years into the future, and slowly scaling back my risks as a result.? If the market moves higher, that will pick up speed.

Estimating Future Stock Returns, June 2017 Update

Estimating Future Stock Returns, June 2017 Update

I’d say this is getting boring, but it’s pretty fascinating watching the rally run. ?Now, this is the seventh time I have done this quarterly analysis. ?The first one was for December 2015. ?Over that time period, the expected annualized 10-year return went like this, quarter by quarter: 6.10%, 6.74%, 6.30%, 6.01%, 5.02%, 4.79%, and 4.30%. ?At the end of June 2017, the figure would have been 4.58%, but the rally since the end of the quarter shaves future returns down to 4.30%.

We are now in the 93rd percentile of valuations.

Wow.

This era will ultimately be remembered as a hot time in the markets, much like 1965-9, 1972, and 1997-2001.

The Internal Logic of this Model

I promised on of my readers that I would provide the equation for this model. ?Here it is:

10-year annualized total return = 32.77% – (70.11% * Percentage of total assets held in stocks for the US as a whole)

Now, the logic of this formula stems from the idea that the return on total assets varies linearly with the height of the stock market, and the return on debt (everything else aside from stocks) does not. ?After that, the formula is derived from the same formula that we use for the weighted average cost of capital [WACC]. ?Under those conditions, the total returns of the stock market can be approximated by a linear function of the weight the stocks have in the WACC formula.

Anyway, that’s one way to think of the logic behind this.

The Future?

Now, what are some of the possibilities for the future?

Above you see the nineteen scenarios for where the S&P 500 will be in 10 years, assuming a 2% dividend yield, and looking at the total returns that happen when the model forecasts returns between 3.30% and 5.30%. ?The total returns vary from 2.31%/year to 6.50%, and average out to 3.97% total returns. ?The bold line above is the 4.30% estimate.

As I have said before, this bodes ill for all collective security schemes that rely on the returns of risky assets to power the payments. ?There is no conventional way to achieve returns higher than 5%/year for the next ten years, unless you go for value and foreign markets (maybe both!).

Then again, the simple solution is just to lighten up and let cash build. ?Now if we all did that, we couldn’t. ?Who would be buying? ?But if enough of us did it such that equity valuations declined, there could be a more orderly market retreat.

The attitude of the market on a qualitative basis doesn’t seem nuts to me yet, so I am at maximum cash for ordinary conditions, but I haven’t hedged. ?When expected 10-year market returns get to 3%/year, I will likely do that, but for now I hold my stocks.

PS — the first article of this series has been translated into Chinese. ?The same website has 48 of my best articles in Chinese, which I find pretty amazing. ?Hope you smile at the cartoon version of me. 😉

The Crisis at the Tipping Point

The Crisis at the Tipping Point

Photo Credit: Fabio Tinelli Roncalli || Alas, there were so many signs that the avalanche was coming…

==================

Ten years ago, things were mostly quiet. ?The crisis was staring us in the face, with a little more than a year before the effects of growing leverage and sloppy credit underwriting would hit in full. ?But when there is a boom, almost no one wants to spoil the party. ?Yes a few bears and financial writers may do so, but they get ignored by the broader media, the politicians, the regulators, the bulls, etc.

It’s not as if there weren’t some hints before this. ?There were losses from subprime mortgages at HSBC. ?New Century was bankrupt. ?Two hedge funds at Bear Stearns, filled with some of the worst exposures to CDOs and subprime lending were wiped out.

And, for those watching the subprime lending markets the losses had been rising since late 2006. ?I was following it for a firm that was considering doing the “big short” but could not figure out an effective way to do it in a way consistent with the culture and personnel of the firm. ?We had discussions with a number of investment banks, and it seemed obvious that those on the short side of the trade would eventually win. ?I even wrote an article on it at RealMoney in November 2006, but it is lost in the bowels of theStreet.com’s file system.

Some of the building blocks of the crisis were evident then:

  • European banks in search of any AAA-rated structured product bonds that had spreads over LIBOR. ?They were even engaged in a variety of leverage schemes including leveraged AAA CMBS, and CPDOs. ?When you don’t have to put up any capital against AAA assets, it is astounding the lengths that market players will go through to create and swallow such assets. ?The European bank yield hogs were a main facilitator of the crisis that was to come, followed by the investment banks, and bullish mortgage hedge funds. ?As Gary Gorton would later point out, real disasters happen when safe assets fail.
  • Speculation was rampant almost everywhere. (not just subprime)
  • Regulators were unwilling to clamp down on bad underwriting, and they had the power to do so, but were unwilling, as banks could choose their regulators, and the Fed didn’t care, and may have actively inhibited scrutiny.
  • Not only were subprime loans low in credit quality, but they had a second embedded risk in them, as they had a reset date where the interest rate would rise dramatically, that made the loans far shorter than the houses that they financed, meaning that the loans would disproportionately default near their reset dates.
  • The illiquidity of the securitized Subprime Residential Mortgage ABS highlighted the slowness of pricing signals, as matrix pricing was slow to pick up the decay in value, given the sparseness of trades.
  • By August 2007, it was obvious that residential real estate prices were falling across the US. ?(I flagged the peak at RealMoney in October 2005, but this also is lost…)
  • Amid all of this, the “big short” was not a sure thing as those that entered into it had to feed the trade before it succeeded. ?For many, if the crisis had delayed one more year, many taking on the “big short” would have lost.
  • A variety of levered market-neutral equity hedge funds were running into trouble in August 2007 as they all pursued similar Value plus Momentum strategies, and as some fund liquidated, a self reinforcing panic ensued.
  • Fannie and Freddie were too levered, and could not survive a continued fall in housing prices. ?Same for AIG, and most investment banks.
  • Jumbo lending, Alt-A lending and traditional mortgage lending had the same problems as subprime, just in a smaller way — but there was so much more of them.
  • Oh, and don’t forget hidden leverage at the banks through ABCP conduits that were off balance sheet.
  • Dare we mention the Fed inverting the yield curve?

So by the time that BNP Paribas announced that three of their funds that bought?Subprime Residential Mortgage ABS had pricing issues, and briefly closed off redemptions, and Countrywide announced that it had to “shore up its funding,” there were many things in play that would eventually lead to the crisis that happened.

Some of us saw it in part, and hoped that things would be better. ?Fewer of us saw a lot of it, and took modest actions for protection. ?I was in that bucket; I never thought it would be as large as it turned out. ?Almost no one saw the whole thing coming, and those that did could not dream of the response of the central banks that would take much of the losses out of the pockets of savers, leaving bad lending institutions intact.

All in all, the crisis had a lot of red lights flashing in advance of its occurrence. ?Though many things have been repaired, there are a lot of people whose lives were practically ruined by their own greed, and the greed of others. ?It’s a sad story, but one that will hopefully make us more careful in the future when private leverage rises, creating an asset bubble.

But if I know mankind, the lesson will not be learned.

PS — this is what I wrote one decade ago. ?You can see what I knew at the time — a lot of the above, but could not see how bad it would be.

Theme: Overlay by Kaira