Category: Quantitative Methods

Perceived Versus Real Risk Tolerance

Perceived Versus Real Risk Tolerance

Picture Credit: Denise Krebs || What RFK said is not applicable to investing. ?Safety First! ?Don’t lose money!

=======

Investment entities, both people and institutions, often say one thing and mean another with respect to risk. ?They can keep a straight face with respect to minor market gyrations. ?But major market changes leading to the possible or actual questioning of whether they will have enough money to meet stated goals is what really matters to them.

There are six factors that go into any true risk analysis (I will handle them in order):

  1. Net Wealth Relative to Liabilities
  2. Time
  3. Liquidity
  4. Flexibility
  5. Investment-specific Factors
  6. Character of the Entity’s Decision-makers and their Incentives

Net Wealth Relative to Liabilities

The larger the surplus of assets over liabilities, the more relaxed and long-term focused an entity can be. ?For the individual, that attempts to measure the amount needed to meet future obligations where future investment earnings are calculated at a conservative level — my initial rule of thumb is no more than 1% above the 10-year Treasury yield.

That said, for entities with well defined liabilities, like a defined benefit pension plan, a bank, or an insurance company, using 1% above the yield curve should be a maximum for investment earnings, even for existing fixed income assets. ?Risk premiums will get taken into net wealth as they are earned. ?They should not be planned as if they are guaranteed to occur.

Time

The longer it is before payments need to be made, the more aggressive the investment posture can be. ?Now, that can swing two ways — with a larger surplus, or more time before payments need to be made, there is more freedom to tactically overweight or underweight?risky assets versus your normal investment posture.

That means that someone like Buffett is almost unconstrained, aside from paying off insurance claims and indebtedness. ?Not so for most investment entities, which often learn that their estimates of when they need the money are overestimates, and in a crisis, may need liquidity sooner than they ever thought.

Liquidity

High quality assets that can easily be turned into spendable cash helps make net wealth more secure. ?Unexpected cash outflows happen, and how do you meet those needs, particularly in a crisis? ?If you’ve got more than enough cash-like assets, the rest of the portfolio can be more aggressive. ?Remember, Buffett view cash as an option, because of what he can buy with it during a crisis. ?The question is whether the low returns from holding cash will get more than compensated for by capital gains and income on the rest of the portfolio across a full market cycle. ?Do the opportunistic purchases get made when the crisis comes? ?Do they pay off?

Also, if net new assets are coming in, aggressiveness can increase somewhat, but it matters whether the assets have promises attached to them, or are additional surplus. ?The former money must be invested coservatively, while surplus can be invested aggressively.

Flexibility

Some liabilities, or spending needs, can be deferred, at some level of cost or discomfort. ?As an example, if retirement assets are not sufficient, then maybe discretionary expenses can be reduced. ?Dreams often have to give way to reality.

Even in corporate situations, some payments can be stretched out with some increase in the cost of financing. ?One has to be careful here, because the time you are forced to conserve liquidity is often the same time that everyone else must do it as well, which means the cost of doing so could be high. ?That said, projects can be put on hold, realizing that growth will suffer; this can be a “choose your poison” type of situation, because it might cause the stock price to fall, with unpredictable second order effects.

Investment-specific Factors

Making good long term investments will enable a higher return over time, but concentration of ideas can in the short-run lead to underperformance. ?So long as you don’t need cash soon, or you have a large surplus of net assets, such a posture can be maintained over the long haul.

The same thing applies to the need for income from investments. ?investments can shoot less for income and more for capital gains if the need for spendable cash is low. ?Or, less liquid investments can be purchased if they offer a significant return for giving up the liquidity.

Character of the Entity’s Decision-makers and their Incentives

The last issue, which many take first, but I think is last, is how skilled the investors are in dealing with panic/greed situations. ?What is your subjective “risk tolerance?” ?The reason I put this last, is that if you have done your job right, and properly sized the first five factors above, there will be enough surplus and liquidity that does not easily run away in a crisis. ?When portfolios are constructed so that they are prepared for crises and manias, the subjective reactions are minimized because the call on cash during a crisis never gets great enough to force them to move.

A: “Are we adequate?”

B: “More than adequate. ?We might even be able to take advantage of the crisis…”

The only “trouble” comes when almost everyone is prepared. ?Then no significant crises come. ?That theoretical problem is very high quality, but I don’t think the nature of mankind ever changes that much.

Closing

Pay attention to the risk factors of investing relative to your spending needs (or, liabilities). ?Then you will be prepared for the inevitable storms that will come.

The Doubling Rule, Redux

The Doubling Rule, Redux

This is a small update of my last piece. ?I wish that I had put this graph in that piece, because it completes it.

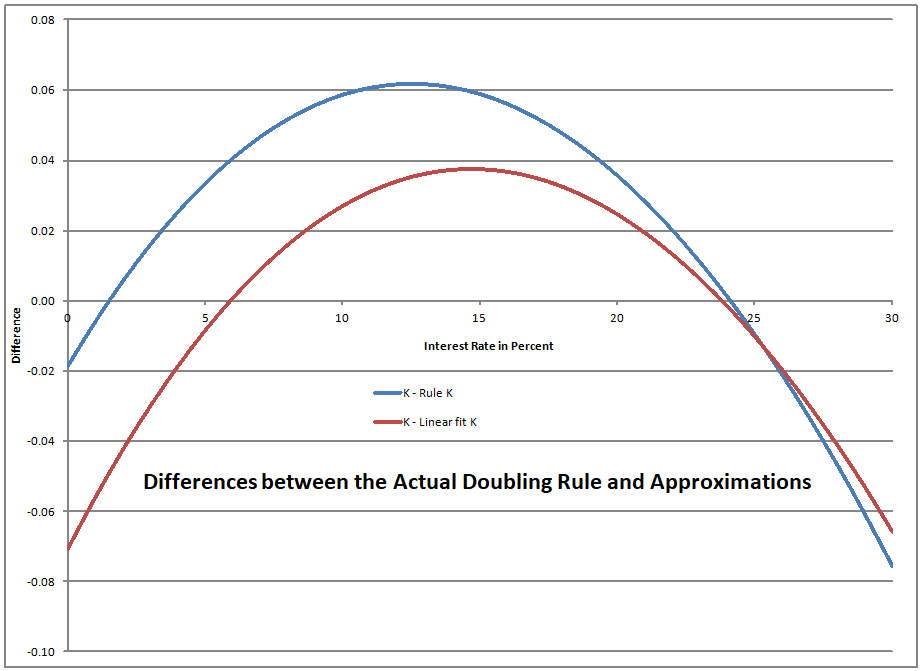
Over the interest rate range of 0% to 30%, the average absolute deviations from perfect doubling using the Rule of 72 was 2.794%. ?Given the simplicity of the Rule of 72, that is wonderful.

But the “Rule of K” is virtually exact. ?The average absolute deviations from perfect doubling using the Rule of K was 0.036%.

Is this great? ?Well, with modern computers, exactitude is easy to come by. ?But if you are in a pinch to figure out the time to double, and all you have is a pencil and paper, the rule of K can do it with addition, subtraction and division. ?No fancy powers or logarithms. ?A four-function calculator will handle it, which, if you are using a rate that does divide into 72 easily, you will still need for the calculation.

At 8% the two are equal. ?Near 8%, the Rule of 72 is pretty good. ?The Rule of K gives an almost exact answer at the cost of a little complexity. ?Your choice depends on whether you need exactness or simplicity when all you have to work with is a four function calculator.

The Rule of K: If R is the interest rate multiplied by 100, money doubles in K/R years, where K = 70 + (R – 2)/3

The Doubling Rule

The Doubling Rule

Picture Credit: Vincent Brown || Einstein never said this, either…

=======================

If you are famous and dead, many people will attribute clever sayings to you that you never said. ?As Yogi Berra said:

I really didn?t say everything I said.

Except that Yogi did say that.? Now, if Einstein didn’t do enough for us, he supposedly made many statements praising compound interest, but the articles I have seen haven’t been able to trace it back to an original source. ?Personally, I think compound interest is overrated, because business processes can’t forever compound wealth at a steady rate.

But some also have tried to credit Einstein with the Rule of 72. ?You know, the rule that says the time it takes to double your money in years is equal to 72 divded by the annual compound interest rate expressed as as an integer. ?E.g., at 8% your money doubles in 9 years. ?At 9% you money doubles in 8 years.

Pretty nice, and easy to remember. ?It is an approximation though. ?If Einstein ever did look at the rule of 72, he would have noticed that the approximation is pretty good between 3% and 13%. ?Outside that it gets further away.

One advantage of the rule of 72 is that it is simple. ?The second one is that 72 = 3 x 3 x 2 x 2 x 2. ?That makes it divide more intuitively by many integral interest rates, e.g., 3, 4, 6, 8, 9, 12 — allowing for some intuitive interpolation to aid it.

There is a more complex version of the doubling rule though:

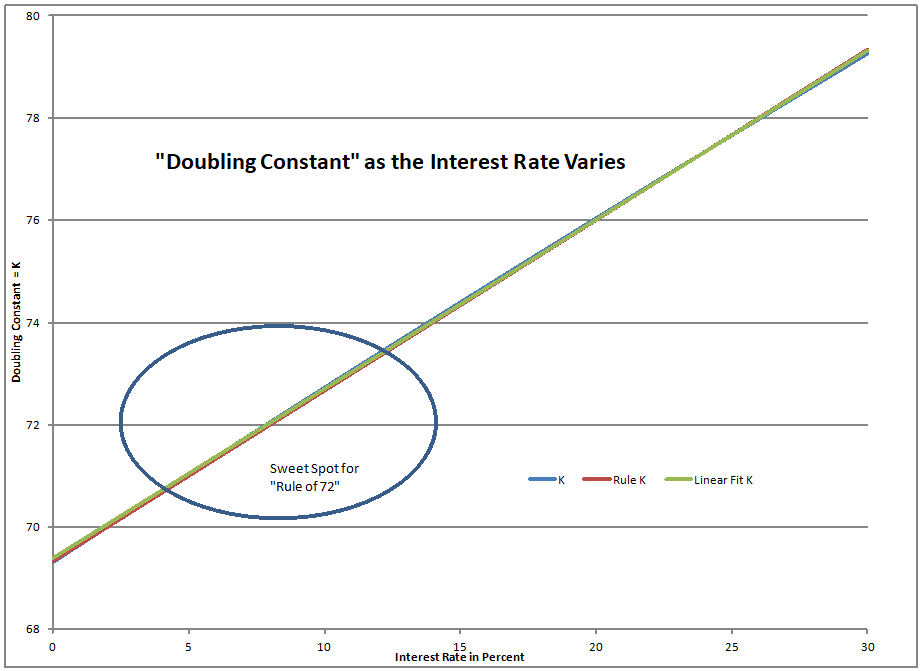
The doubling constant starts (in the limit) at 100 times the natural logarithm of 2 [69.3147], and increases almost linearly from there. ?If you estimate a “best linear fit” line on the observations where the interest rate is between 0 and 30, the R-squared will be over 99.98%. ?The equation would be:

K = 69.3856 + 0.3313 * interest rate ?[Linear Fit K]

To make it a little more memorable rule, it can be turned into:

K = 70 + (interest rate – 2)/3 ?[Rule K]

Thus at 2% the doubling constant would be 70 — money doubles in 35 years. ?At 5%, 71, money doubles in 14.2 years. ?8% is the rule of 72 — nine years to double. ?At 11%, 73, 6.6 years to double. ?At 14%, 74, 5.3 years to double. 17%, 75, 4.4 years to double. 20%, 76, 3.8 years to double. ?I did those in my head.

As you can see from the graph above, the actual doubling constant and its two approximations lie on top of each other. ?Not that I hope we see ultrahigh interest rates, but Rule K does quite well over a long span of rates. ?Here’s how small the deviations are:

Now, almost no one will use “Rule K” because the two advantages of the Rule of 72 are huge, and if interest rates get really high, someone could create an easy smartphone app to calculate the doubling period. (and constant if they wanted)

This is interesting for me, because I ran across what I call the “Rule of K” earlier in my career, and I was able to reproduce it on my own after reading the WSJ article that I cited above. ?Who knows, maybe Einstein took the doubling rule and did a first order Taylor expansion around 2% — that would have produced something very close to the “Rule of K” back when regressions were hard to do.

That’s all, and if you made it this far, thanks for bearing with me.

Estimating Future Stock Returns, March 2017 Update

Estimating Future Stock Returns, March 2017 Update

26 paths, and all of them wrong

========================

I lost this post once already, hopefully it will be better-written this time. ?I’ve been playing around with the stock market prediction model in order to give some idea of how the actual results could vary from the forecasts.

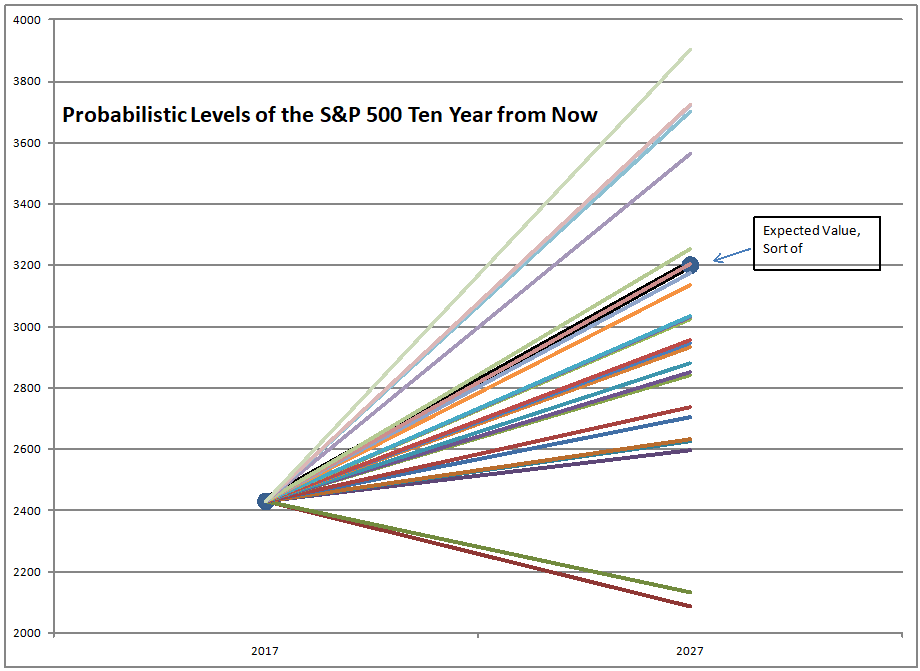
Look at the graph above. ?it shows potential price returns that vary from -1.51%/year to 4.84%/year, with a most likely value of 2.79%, placing the S&P 500 at 3200 in March 2027. ?Add onto this a 2% dividend yield to get the total returns.

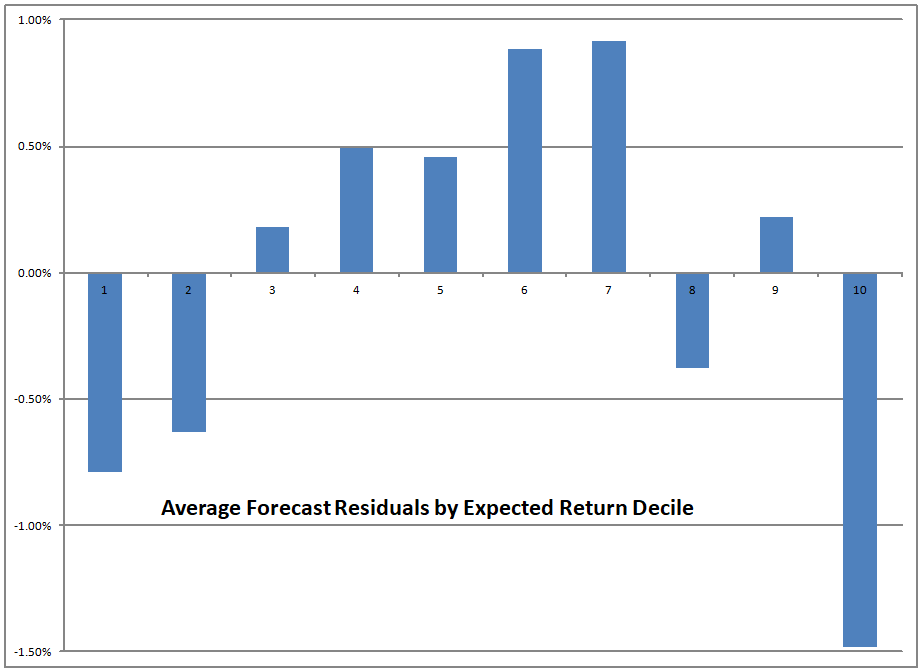
The 26 paths above come from the 26 times in the past that the model forecast total returns within 1% of 4.79%. ?4.79% is at the 90th percentile of expected returns. ?Typically in the past, when expected returns were in the lower two deciles, actual returns were lower still. ?For the 26 scenarios, that difference was 0.63%/year, which would imply 10-year future returns in the 4.16%/year area.

The pattern of residuals is unusual. ?The model tends to overestimate returns at the extremes, and underestimate when expected returns are “normal.” ?I can’t think of a good reason for this. ?If you have a good explanation please give it in the comments.

Now if errors followed a normal distribution, a 95% confidence interval on total returns would be plus or minus 3.8%, i.e., from 1.0% to 8.6%. ?I find the non-normal confidence interval, from 0.5% to 6.8% to be more plausible, partly because valuations would be a new record in 2027 if we had anything near 8.6%/year for the next ten years. ?Even 6.8%/year would be a record. ?That”s why I think a downward bias on results makes sense, with high valuations.

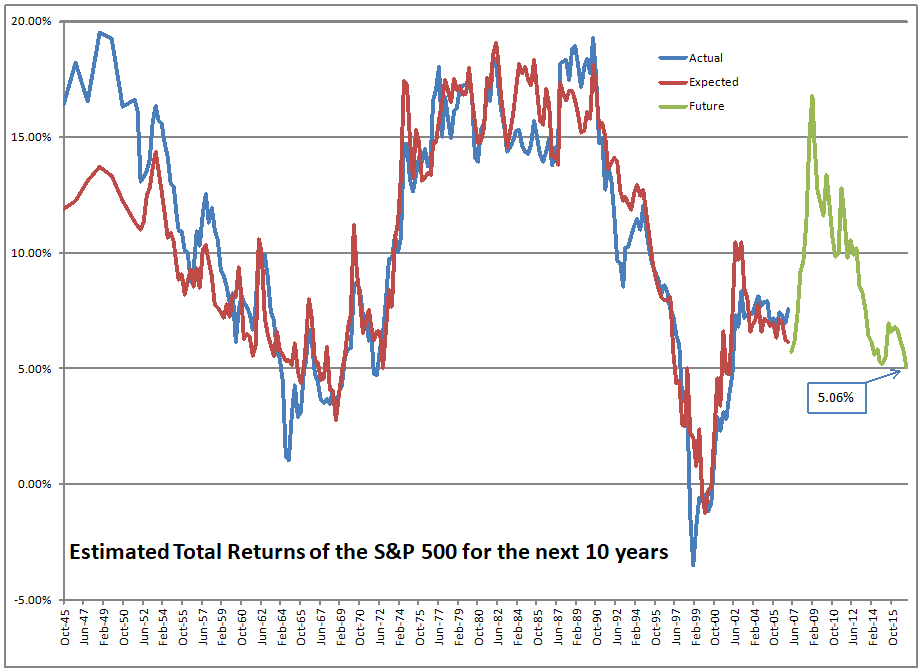
At the end of the first quarter, the model forecast total returns of 5.06%/year for the next ten years. ?With the recent rally, that figure is now 4.79%/year. ?Now, how excited should we be about these returns? ?Not very? ?I can buy that.

But what if you were a financial planner and thought this argument to be plausible? ?Maybe you can get 3.5%/year out of bonds over the next ten years. ?With 4.79% on stocks, and a 60/40 mix of stocks/bonds, that means returns of 4.27%. ?Not many financial planning models are considering levels like that.

But now think of pension plans and endowments. ?How many of them have assumptions in the low 4% region? ?Some endowments are there as far as a spending rule goes, but they still assume some capital gains to preserve the purchasing power of the endowment. ?Pension plans are nowhere near that, and if they think alternative investments will bail them out, they don’t know what they are doing. ?Alternatives are common enough now that the face the same allocative behavior from institutional investors, which then correlates their returns with regular investments in the future, even if they weren’t so in the past.

I don’t have much more to say, so I will close with this: if you want to study this model more, you need to read the articles in this series, and the articles referenced at the Economic Philosopher blog. ?Move your return expectations down, and diversify away from the US; there are better returns abroad — but remember, there are good reasons for home bias, so choose your foreign investments with care.


Goes Down Double-Speed (Update 4)

Goes Down Double-Speed (Update 4)

Photo Credit: eric lynch

Markets always find a new way to make a fool out of you. ?Sometimes that is when the market has done exceptionally well, and you have been too cautious. ? That tends to be my error as well. ?I’m too cautious in bull markets, but on the good side, I don’t panic in bear markets, even the most severe of them.

The bull market keeps hitting new highs. ?It’s the second longest bull market in the last eighty years, and the third largest in terms of cumulative price gain. ?Let me?show you a graph that simultaneously shows how amazing it is, and how boring it is as well.

The amazing thing is how long the rally has been. ?We are now past 3000 days. ?What is kind of boring is this — once a rally gets past two years time, price return results fall into a range of around 1.1-2.0%/month for the rally as a whole, averaging around 1.4%/month, or 18.5% annualized. ?(The figure for market falling more than 200 days is -3.3%/month, which is slightly more than double the rate at which it rises. ?Once you throw in the shorter time frames, the ratio gets closer to double — presently around 2.18x. ?Note that the market rises are 3.2x as long as the falls. ?This is roughly similar to the time spans on the credit cycle.)

That price return rate of 1.4%/month isn’t boring, of course, and is?close to?where the stock market prediction model would have predicted back in March 2009, where it forecast total returns of around 16%/year for 10 years. ?That would have implied a level a little north of 2500, which is only 3% away, with 21 months to go.

Have you missed the boat?

If you haven’t been invested during this rally, you’ve most like missed more than 80% of the?gains of this rally. ?So yes, you have missed it.

?The Moving Finger writes; and, having writ,
Moves on: nor all thy Piety nor Wit
Shall lure it back to cancel half a Line,
Nor all thy Tears wash out a Word of it.?

? Omar Khayy?m?from The Rubaiyat

In other words, “If ya missed the last bus, ya missed the last bus. ?Yer stuck.”

We can only manage assets for the future, and only our decrepit view of the future is of any use. ?We might say, “I have no idea.” and maintain a relatively constant asset allocation policy. ?That’s mostly what I do. ?I limit my asset allocation changes because it is genuinely difficult to time the market.

If you are tempted to add more money now, I would tell you to wait for better levels. ?If you can’t wait, then do half of what you want to do.

A wise person knows that the past is gone, and can’t be changed. ?So aim for the best in the future, which at present means having at least your normal percentage of safe assets in your asset allocation.

(the closing graph shows the frequency and size of market gains since 1928)

Estimating Future Stock Returns, December 2016 Update

Estimating Future Stock Returns, December 2016 Update

What a difference a quarter makes! ?As I said one quarter ago:

Are you ready to earn 6%/year until 9/30/2026? ?The data from the Federal Reserve comes out with some delay. ?If I had it instantly at the close of the third quarter, I would have said 6.37% ? but with the run-up in prices since then, the returns decline to 6.01%/year.

So now I say:

Are you ready to earn 5%/year until 12/31/2026? ?The data from the Federal Reserve comes out with some delay. ?If I had it instantly at the close of the fourth?quarter, I would have said 5.57% ? but with the run-up in prices since then, the returns decline to 5.02%/year.

A one percent drop is pretty significant. ?It stems from one main factor, though — investors are allocating a larger percentage of their total net worth to stocks. ?The amount in stocks moved from 38.00% to 38.75%, and is probably higher now. ?Remember that these figures come out with a 10-week delay.

Remember that the measure in question covers both public and private equities, and is market value to the extent that it can be, and “fair value” where it can’t. ?Bonds and most other assets tend to be a little easier to estimate.

So what does it mean for the ratio to move up from 38.00% to 38.75%? ?Well, it can mean that equities have appreciated, which they have. ?But corporations buy back stock, pay dividends, get acquired for cash which reduces the amount of stock outstanding, and places more cash in the hands of investors. ?More cash in the hands of investors means more buying power, and that gets used by many long-term institutional investors who have fixed mandates to follow. ?Gotta buy more if you hit the low end of your equity allocation.

And the opposite is true if new money gets put into businesses, whether through private equity, Public IPOs, etc. ?One of the reasons this ratio went so high in 1998-2001 was the high rate of business formation. ?People placed more money at risk as they thought they could strike it rich in the Dot-Com bubble. ?The same was true of the Go-Go era in the late 1960s.

Remember here, that average returns are around 9.5%/year historically. ?To be at 5.02% places us in the 88th percentile of valuations. ?Also note that I will hedge what I can if expected 10-year returns get down to 3%/year, which corresponds to a ratio of 42.4% in stocks, and the 95th percentile of valuations. ?(Note, all figures in this piece are nominal, not inflation-adjusted.) ?At that level, past 10-year returns in the equity markets have been less than 1%, and in the short-to-intermediate run, quite poor.)

You can also note that short-term and 10-year Treasury yields have risen, lowering the valuation advantage versus cash and bonds.

I have a few more small things to add. ?Here’s an article from the Wall Street Journal:?Individual Investors Wade In as Stocks Soar. ?The money shot:

The investors? positioning suggests burgeoning optimism, with TD Ameritrade clients increasing their net exposure to stocks in February, buying bank shares and popular stocks such as Amazon.com Inc. and sending the retail brokerage?s Investor Movement Index to a fresh high in data going back to 2010. The index tracks investors? exposure to stocks and bonds to gauge their sentiment.

?People went toe in the water, knee in the water and now many are probably above the waist for the first time,? said JJ Kinahan, chief market strategist at TD Ameritrade.

This is sad to say, but it is rare for a rally to end before the “dumb money” shows up in size. ?Running a small asset management shop like I do, at times like this I suggest to clients that they might want more bonds (with me that’s short and high quality now), but few do that. ?Asset allocation is the choice of my clients, not me. ?That said, most of my clients are long-term investors like me, for which I give them kudos.

Then there is this piece over at Bloomberg.com called:?Wall Street’s Buzz Over ‘Great Leader’ Trump Gives Shiller Dot-Com Deja Vu. ?I want to see the next data point in this analysis, which won’t be available by mid-June, but I do think a lot of the rally can be chalked up to willingness to take more risk.

I do think that most people and corporations think that they will have a more profitable time under Trump rather than Obama. ?That said, a lot of the advantage gets erased by a higher cost of debt capital, which is partly driven by the Fed, and partly by a potentially humongous deficit. ?As I have said before though, politicians are typically limited in what they can do. ?(And the few unlimited ones are typically destructive.)

Shiller’s position is driven at least partly by the weak CAPE model, and the rest by his interpretation of current events. ?I don’t make much out of policy uncertainty indices, which are too new. ?The VIX is low, but hey, it usually is when the market is near new highs. ?Bull markets run on complacency. ?Bear markets plunge on revealed credit risk threatening economic weakness.

One place I will agree with Shiller:

What Shiller will say now is that he?s refrained from adding to his own U.S. stock positions, emphasizing overseas markets instead.

That is what I am doing. ?Where I part ways with Shiller for now is that I am not pressing the panic button. ?Valuations are high, but not so high that I want to hedge or sell.

That’s all for now. ?This series of posts generates more questions than most, so feel free to ask away in the comments section, or send me an email. ?I will try to answer the best questions.

=========================

Late edit: changed bolded statement above from third to fourth quarter.

We Get New Highs More Frequently After New Highs

We Get New Highs More Frequently After New Highs

This post may fall into the “Dog bites Man” bucket, but I will see if I can’t shed a little more light on the phenomenon. ?Here’s the question: “When do we see new highs in the stock market most often?” ?The punchline: “After a recent new high.”

The red squares above show the probability of hitting a new high so many days after a new high. ?The black line near it is a best fit power curve. ?The blue diamonds?above show the probability of hitting a new high so many days after not hitting a new high. ?The green triangles?above show the ratio of those two probabilities, matching up against the right vertical axis. The black line near it is a best fit power curve.

As time goes to infinity, both probabilities converge to the same number, which is presently estimated to be 6.8%, the odds that we would hit a new high on any day between 1951 and 2015. ?Here’s the table that corresponds to the above graph:

Probability of a new high after Days after no new high Days after new high Probability Ratio
1st day 3.1% 57.3% 18.29
2nd day 4.2% 43.3% 10.39
3rd day 4.6% 36.7% 7.90
4th day 4.8% 33.8% 6.99
5th day 5.1% 30.0% 5.87
6th day 5.2% 28.2% 5.37
7th day 5.5% 24.2% 4.36
8th day 5.7% 22.5% 3.97
9th day 5.6% 23.4% 4.18
10th day 5.6% 22.6% 4.00
11-15 5.9% 19.0% 3.22
16-20 6.0% 17.2% 2.86
21-30 6.1% 16.4% 2.71
31-40 6.2% 14.5% 2.35
41-50 6.2% 15.2% 2.47
51-60 6.3% 14.2% 2.28
61-75 6.3% 13.9% 2.21
76-90 6.3% 13.6% 2.16
91-105 6.3% 12.8% 2.02
106-120 6.4% 12.5% 1.96
121-140 6.4% 12.0% 1.87
141-160 6.5% 11.3% 1.75
161-180 6.4% 11.5% 1.79
181-200 days 6.4% 11.8% 1.84


E.g., as you go down the table the probability 43.3% represents the probability that you get a new high?on the second day after a new high.

Here’s an intuitive way to think about it: if you are not at a new high, you are further away from a new high than if you were at a new high recently. ?Thus with time the daily probability of hitting a new high gets higher. ?If you were at a new high recently, you daily odds of hitting a new high are quite high, but fall over time, because?the odds of drifting lower at some point increase. ?Valuation is a weak daily force, but a strong ultimate force.

That said, the odds of hitting new highs a long time away from a new high are significantly higher than the odds of hitting a new high where there has been no new high for the same amount of time.

Closing Thoughts

I could segment the data another way, and this could be clearer: If you are x% away from a new high, what is?the odds you will hit a new high n days from now? ?As x gets bigger, so will the numbers for n. ?Be that as it may, when you have had new highs recently, you tend to have more of them. ?New highs clump together.

The same is true of periods with no new highs — they tend to clump together and persist even more.

Valuation and momentum are hidden variables here — momentum aids persistence, and valuation is gravity, eventually causing markets that don’t fairly price likely future cash flows to revert to pricing that is more normal. ?Valuation is powerful, but takes a long while to act, often waiting for a credit cycle to do its work. ?Momentum works in the short-run, propelling markets to heights and depths that we can only reach from human mimickry.

That’s all.

Good, Not Average, Not Great

Good, Not Average, Not Great

I was reading through The Wall Street Journal’s Daily Shot column, done by the estimable @SoberLook, and saw the following graph and text:

The S&P 500 move this year is completely outside the historical seasonal trends.

Graph Credit: Deutsche Bank via @SoberLook at The Wall Street Journal

Averages reveal, but they also conceal. ?When I look at a graph like this, I know that any given year is highly likely to look different than an average of years. ?So, no surprise that the returns on the S&P 500 are different than the averages of the prior 11 or 19 years.

But how has the S&P 500 fared versus the last 68 years? ?At present this year is 20th out of 68, which is good, but not great or average. ?But look at the graph at the top of this article: up until the close of the 25th trading day of the year (February 7th) the market had performance very much like a median year. ?All of the higher performance has come out of the last nine days. ?(For fun, it is the ninth best out of 68 for that time of year; even that is not top decile.)

I can tell you something easy: you can have a lot of different occurrences over nine days in the market. ?The distribution of returns would be quite wide. ?Therefore, don’t get too excited about the returns so far this year — they aren’t that abnormal. ?You can be concerned as you like about valuation levels — they are high. ?But 2017 at present is a “high side of normal” year compared to past price performance.

And, if you want to be concerned about a melt-up, it is this kind of low positive momentum that tends to persist, at least for a while. ?Trading behavior isn’t nuts, even if valuations are somewhat steamy.

I’m around 83% invested in equity accounts, so I am conservative, but I’m not thinking of hedging yet. ?Let the rally run.

Problems with Constant Compound Interest (6)

Problems with Constant Compound Interest (6)

Doctored Photo Credit: Marvin Isidore Macatol || And I say this is heresy!

=================================

My last post produced the following question:

What if your time horizon was 60 years? Would a 5% real return be achievable?

I am answering this as part of an irregular “think deeper” series on the problems of modeling investment over the very long term… the last entry was roughly six years ago. ?It’s a good series of five articles, and this is number six.

On to the question. ?The model forecasts over a ten-year period, and after that returns return to the long run average — about 9.5%/year nominal. ?The naive answer would then be something like this: the model says over a 60-year period you should earn about 8.85%/year, considering that the first ten years, you should earn around 5.63%/year. ?(Nominally, your initial investment will grow to be 161x+ as large.) ? If you think this, you can earn a 5% real return if inflation over the 60 years averages 3.85%/year or less. ?(Multiplying your capital in real terms by 18x+.)

Simple, right?

Now for the problems with this. ?Let’s start with the limits of math. ?No, I’m not going to teach you precalculus, though I have done that for a number of my kids. ?What I am saying is that math reveals, but it also conceals. ?In this case the math assumes that there is only one variable that affects returns for ten years — the proportion of investor asset held in stocks. ?The result basically says that over a ten-year period, mean reversion will happen. ?The proportion of investor asset held in stocks will return to an average level, and returns similar to the historical average will come?thereafter.

Implicitly, this assumes that the return series underlying the regression is the perfectly normal return series, and the future will be just like it, only more so. ?Let me tell you about some special things involved in the history of the last 71 years:

  • We have not lost a war on our home soil.
  • We have not had socialism to the destructive levels experienced by China under Mao, the USSR. North Korea, Cuba, etc. ?(Ordinary socialism isn’t so damaging, though there are ethical reasons for not going that way. ?People deserve freedom, not guarantees. ?Note that stock returns in moderate socialist countries have been roughly as high as those in the US. ?See the book Triumph of the Optimists.)
  • We have continued to have enough children, and they have become moderately productive workers. ?Also, we have welcomed a lot of hard working and creative people to the US.
  • Technology has continued to improve, and along with it, labor productivity.
  • Adequate energy to multiply force and distribute knowledge is inexpensively available.
  • We have not experienced hyperinflation.

There are probably a few things that I have missed. ?This is what I mean when I say the math conceals. ?Every mathematical calculation abstracts quantity away from every other attribute, and considers it to be the only one worth analyzing. ?Qualitative analysis is tougher and more necessary than quantitative analysis — we need it to give meaning to mathematical analyses. ?(What are the limits? ?What is it good for? ?How can I use it? ?How can I use it ethically?)

If you’ve read me long enough, you know that I view economies and financial markets as ecosystems. ?Ecosystems are stable within limits. ?Ecosystems also can only develop so quickly; there may be no limits to growth, but there are limits to the speed of growth in mature economies and financial systems.

Thus the question: will these excellent conditions continue? ?My belief is that mankind never truly changes, and that history teaches us that all governments and most cultures eventually die. ?When they do, most or all economic arrangements tend to break, especially complex ones like financial markets.

But here are three more limits, and they are more local:

  • Can you really hold for 60 years, reinvesting and never taking a material amount?out?
  • Will the number investing in the equity markets remain small?
  • Will stock be offered and retired at ordinary prices?


Most people can’t lock money away for that long without touching it to some degree. ?Some of the assets?may get liquidated because of panic, personal emergency needs, etc. ?Besides, why be a miser? ?Warren Buffett, one of the greatest compounders of all time, might have ended up happier if he had spent less time compounding, and more time on his family. ?It would have been better to take a small?part of it, and use it to make others happy then, and not wait to be the one of the most famous philanthropists of the 21st century before touching it.

Second, returns may be smaller in the future because more pursue them. ?One reason?the rewards for being a capitalist are large on average is that?there are relatively few of them. ?Also, I have sometimes wondered if stock returns will fall when the whole world is employed, and there is no more cheap labor to be had. ?Should that bold scenario ever come to pass, labor would have more bargaining power in aggregate, and profits would likely fall.

Finally, you have to recognize that the equity return statistics are somewhat overstated. ?I’m not sure how much, but I think it is enough to reduce returns by 1%+. ?Equity tends to be offered for initial purchase expensively, and tends to get retired inexpensively. ?Businessmen are rational and tend to go public when stock valuations are high, pay employees in stock when valuations are high, and do stock deals when valuations are high. ?They tend to go private when stock valuations are low, pay employees cash in ordinary times, and do cash?deals when valuations are low.

As a result, though someone that buys and holds the stock index does best, less money is in the index when stocks are low, and a lot more when stocks are high.

Inflation Over 60 Years?

I mentioned the risk of hyperinflation above, but who can tell what inflation will do over 60 years? ?If the market survives, I feel confident that stocks would outperform inflation — but how much is the open question. ?We haven’t paid the price for loose monetary policy yet. ?A 1% rise in inflation tends to cut stock returns by 2% for a year in real terms, but then businesses adjust and pass through higher prices. ?Vice-versa when inflation falls.

Right now the 30-year forecast for inflation is around 2.1%/year, but that has bounced around considerably even within a calm environment. ?My estimate of inflation over a 60-year period would be the weakest element of this analysis; you can’t tell what the politicians and central bankers will do, and they aren’t sure themselves.

Summary

Yes, you could earn 5% real returns on your money over a 60-year period… potentially. ?It would take hard work, discipline, cleverness, frugality, and a cast iron stomach for risk. ?You would need to be one of the few doing it. ?It would also require the continued prosperity of the US and global economies. ?We don’t prosper in a vacuum.

Thus in closing I will tell you that yes, you could do it, but there is a large probability of failure. ?Don’t count on buying that grand villa on the Adriatic Sea in your eighties, should you have the strength to enjoy it.

The Band Marches On

The Band Marches On

Photo Credit: Mike Morbeck?|| On Wisconsin! On Wisconsin!

=============================================================

It was shortly after the election when I last moved my trading band. ?Well, time to move it again, this time up 4%, with a small twist. ?I’m at my cash limit of 20%, with a few more stocks knocking on the door of a rebalancing sale, and none near a rebalancing buy. ?(To decode this, you can read my article on portfolio rule seven.) ?Here is portfolio rule seven:

Rebalance the portfolio whenever a stock gets more than 20% away from its target weight. Run a largely equal-weighted portfolio because it is genuinely difficult to tell what idea is the best. Keep about 30-40 names for diversification purposes.

This is my interim trading rule, which helps me make a little additional money for clients by buying relatively low and selling relatively high. ?It also reduces risk, because higher prices are riskier than lower prices, all other things equal.

There are two companies that are double-weights in my portfolio, one half-weight, and 32 single-weights. ?The half-weight is a micro-cap that is difficult to buy or sell. (Patience, patience…) ?With cash near 20%, a?single-weight currently runs around 2.2% of assets, with buying happening near 1.75%, and selling near 2.63%.

But, I said there was a small twist. ?I’m going to add another single-weight position. ?I don’t know what yet. ?Also, I’m leaving enough in reserve to turn one of the single-weights into a double-weight. ?That company is a well-run Mexican firm that has ?had a falling stock price even though it is still performing well. ?If it falls another 10%, I will do more than rebalance. ?I will rebalance and double it.

Part of the reason for the move in both number of positions and position size at the same time is that both the half-weight and one single-weight that is at the top of its band are being acquired for cash, and so they (3.5% of assets) behave more like cash than stocks.

Thus, amid a portfolio that has been performing well, I am adjusting my positioning so that if the market continues to do well, the portfolio doesn’t lag much, or even continues to outperform. ?I’m not out to make big macro bets; I will make a small bet that the market is high, and carry above average cash, but it will all get deployed if the market falls 25%+ from here.

I keep the excess cash around for the same reason Buffett does. ?It gives you more easy options in a bad market environment. ?Until that environment comes, you’ll never know how valuable is is to keep some extra cash around. ?Better safe, than sorry.

Theme: Overlay by Kaira