Search Results for: Estimating Future Stock Returns

Estimating Future Stock Returns, March 2021 Update

Image Credit: Aleph Blog || Recently I was talking with a younger pastor friend of mind who is pretty bright. I have known him since he was a teenager. He said to me, “I have concluded the the stimulus actions of the Fed and the Government benefit the rich predominantly.” I told him that he was certainly correct.

Sorry for being late with this update. Have you ever considered the idea that trying to avoid depressions encourages cronyism — the government favors the rich through QE and deficit spending? QE inflates assets and commodity prices. The rich benefit from the first, and the poor are hurt by the second. The same applies to most government spending programs. The rich employ accountants and lawyers, and find ways to benefit from changes in the law, and lobby for exceptions to policies that seem to favor “soak the rich.”

The main thing supporting the market as a whole is low interest rates. And as the Fed suggested they are thinking of tightening policy two years from now, short rates rose and long rates fell. Markets anticipate. I can tell you that if the yield curve gets very flat, the Fed won’t do much tightening, unless they are nuts, which is occasionally true.

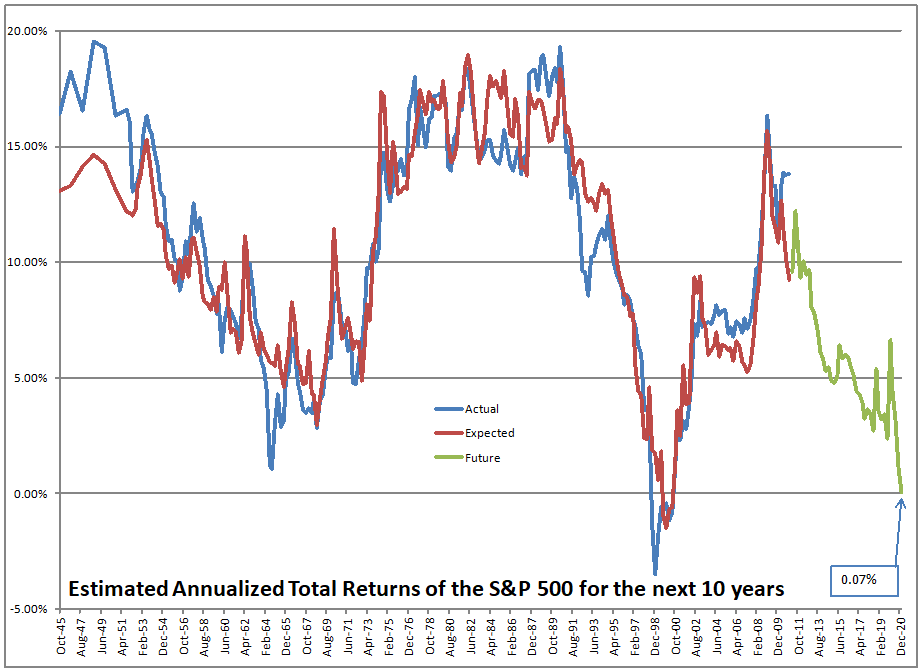
On March 31st, the S&P 500 was priced to return 0.07%/year over the next 10 years. Today, that figure is -0.67%. At the close on Monday, that figure was -1.03%. These figures do not take account of inflation, so it indicates real annual returns between negative 2 and negative 3 percent.

The only period that compares with this is the dot-com bubble. If we want to hit new valuation records, 4450 on the S&P would exceed the valuations of the dot-com bubble. Thus when I hear investment banks call for 4800 on the S&P 500 in 2022, I think they are just doing what profits them. They push people to take on more risk, particularly near market tops. If ordinary people get more aggressive here, some of the investment banks will take the opposite side of the trade, so they can profit as the market falls. Those at r/wallstreetbets are being the dumb money that the investment banks will eventually profit from.

Investment banks make a lot of money from offering the shares of speculative firms during a bull market. Then they run for cover faster than retail clients can during the transition to a bear market.
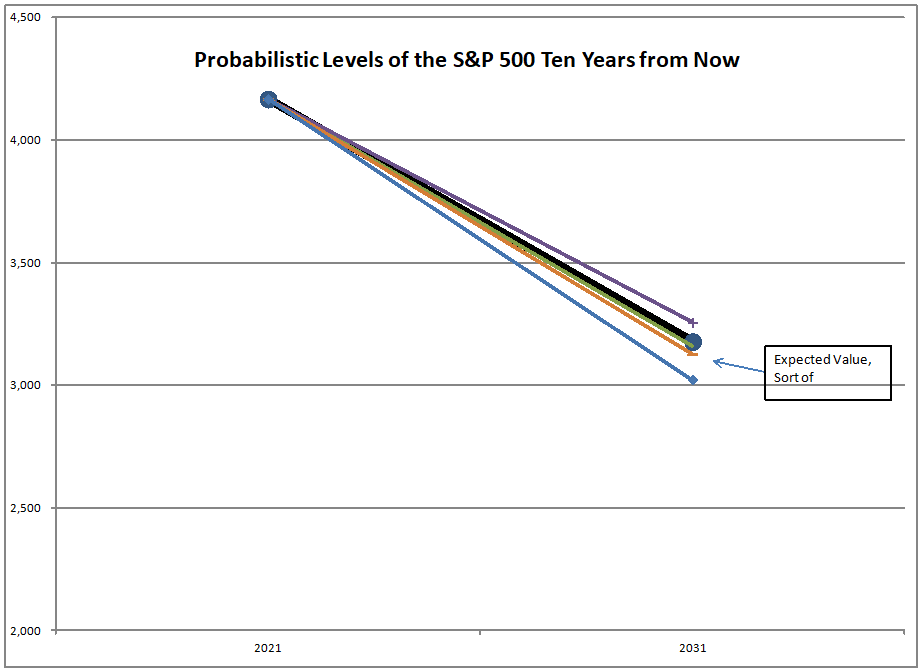
Image credit: Aleph Blog

In he past, valuation levels like the present have always led to losses 10 years out. Unless your portfolio is vastly different from the market as a whole, you will suffer these losses. Only if you buy the stocks that have not done well over the past 5 years do you have a chance of producing positive returns. It is exactly parallel to the dot-com bubble. You must avoid large cap growth.

At some point in time the S&P 500 will have a value under 3000. The more interesting question is whether it will have a value under 2000. I don’t think it will ever reach three digits again, unless we get significant deflation.

This is an ugly situation. Pare back risk positions. Focus on undervalued companies in industries that will not go out of fashion. Add investment grade bonds to your portfolio to lose less in real terms than you will get from investing in the S&P 500 index.

Just as no one thought they would lose in late 1999, so it is now. Be aware, and reduce exposure to large cap growth stocks. Replace them with value stocks or investment grade bonds.

Estimating Future Stock Returns, December 2020 Update

Image Credit: Aleph Blog || Running on empty, running dry… what will happen when obligations can’t be met?

Welcome to Blunderland, boys and girls. At the end of the fourth quarter, the S&P 500 was priced to return 1.29%/yr for the next ten years, with no adjustment for inflation. You might say, “But David, you’ve reported levels that low in the past, and you were concerned, but you never said ‘Blunderland.’”

True, but the market has rallied further since the end of the quarter, and the level of the S&P 500 now is priced to return 0.54%/yr for the next ten years, with no adjustment for inflation. That’s in the 98th percentile of valuations. Another reason I didn’t say ‘Blunderland’ in the past was that we did not have a situation before where the only values comparable came from core of the the dot-com bubble. Thus, welcome to Blunderland.

Now, the valuation levels of the Blunderland era lasted for 2 years and 3 months, from the beginning of the fourth quarter of 1998 to the end of the fourth quarter of 2000. It was a period where monetary policy was extremely loose, before tightening enough to send the market into a tailspin, even as many claimed that interest rates have no effect on growth stocks.

Okay, I’m done imitating my last article on the topic. We are in the midst of a full-fledged mania. What is different no versus the dot-com bubble was that value only took off as the market began to implode. At present, value is outperforming even as valuations are at nosebleed levels. And for any who care, you would be better off buying a 10-year Treasury Note than buying the S&P 500 at present. There is an alternative… to lose less in purchasing power terms.

Of course, you could do what I did in mid-2000, and what I am doing now… own a bunch of cheap stocks that have been neglected over the last ten years, and hold them through the coming disaster. Many of them are cyclicals so they like inflation. Others are life insurers — they want long term interest rates to rise.

But will that be the path? Who can tell? And even with that path, I had gains in 2000 and 2001, and bruising losses in 2002, before rocketing out of it in 2003.

It will be different this time. It is always different. That said, valuations are very high. If you are wealthy and can pay on credit default swaps, no is the time to do it. If you are at the low end of the 1% like me, it is time to own more bonds and safer equities.

Yes, there are other possibilities. You could:

  • Short SPY
  • Buy puts on SPY
  • Buy puts on HYG and JNK
  • Short QQQ
  • Buy puts on QQQ

You get the idea. If I were to do any of the above I would buy puts on HYG and JNK. I’m not doing that at present. This is the poor man’s way of paying on credit default swaps.

Yes, this is one of those rare times where you will lose is you own the broad market indexes like the S&P 500. note that the above is prices only, and does not include dividends. I think anyone invested in the S&P 500 will earn a tiny amount over the next ten years, and less than the ten-year Treasury Note or the CPI.

I can make this “advice” which is not investment advice in the technical sense simple: sell growth stocks and move to value. Sell stocks generally, and move to bonds.

Now I am not doing that. I am sticking with my cheap stocks with strong balance sheets, in industries that have lagged. And i have roughly 30% of my portfolio in investment grade bonds.

This is a good position to be in amid a mania. Maybe you should imitate me, lest you find that accidentally you became a financial maniac.

Estimating Future Stock Returns, September 2020 Update

Image Credit: Aleph Blog || No, abnormal monetary has many significant costs, not the least of which is an asset bubble that feeds a debt bubble.

Welcome to Wonderland, boys and girls. At the end of the third quarter, the S&P 500 was priced to return 2.92%/yr for the next ten years, with no adjustment for inflation. You might say, “But David, you’ve reported levels that low in the past, and you were concerned, but you never said ‘Wonderland.'”

True, but the market has rallied further since the end of the quarter, and the level of the S&P 500 now is priced to return 1.79%/yr for the next ten years, with no adjustment for inflation. That’s in the 97th percentile of valuations. Another reason I didn’t say ‘Wonderland’ in the past was that there were a few values in the 1960s that were comparable to valuations. Now the only comparables are from the dot-com bubble. Thus, welcome to Wonderland.

Now, the valuation levels of the Wonderland era lasted for 3 years and 3 months, from the end of the first quarter of 1998 to the end of the second quarter of 2001. It was a period where monetary policy was extremely loose, before tightening enough to send the market into a tailspin, even as many claimed that interest rates have no effect on growth stocks.

Let me post the rest of my graphs, and I will finish my thoughts.

Image Credit: Aleph Blog

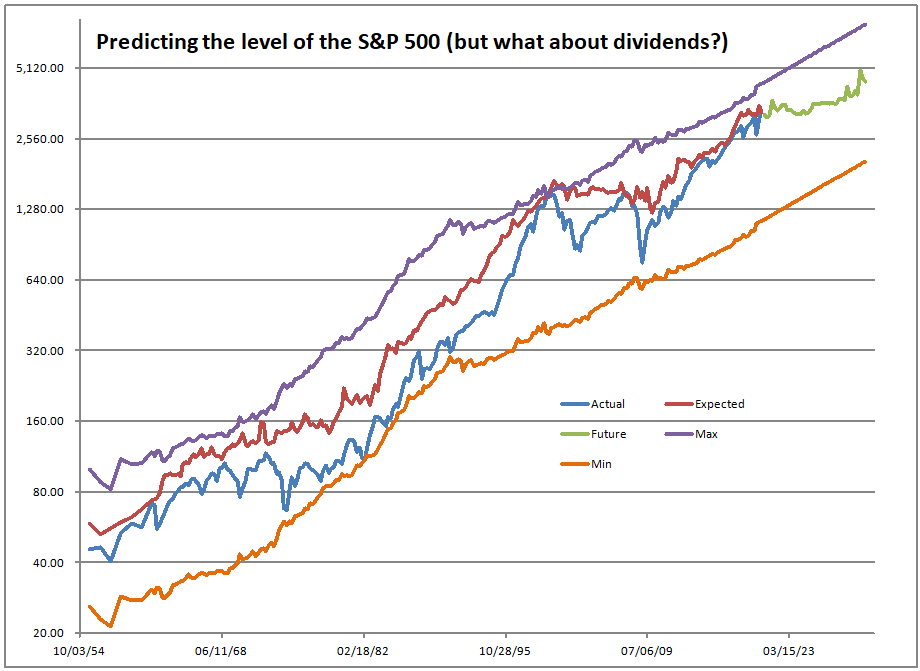
Note that we are considerably closer to the maximum valuation levels than to the minimum levels. If we wanted to create a new maximum level, we would have to rally 19.4% from present levels.

Image Credit: Aleph Blog

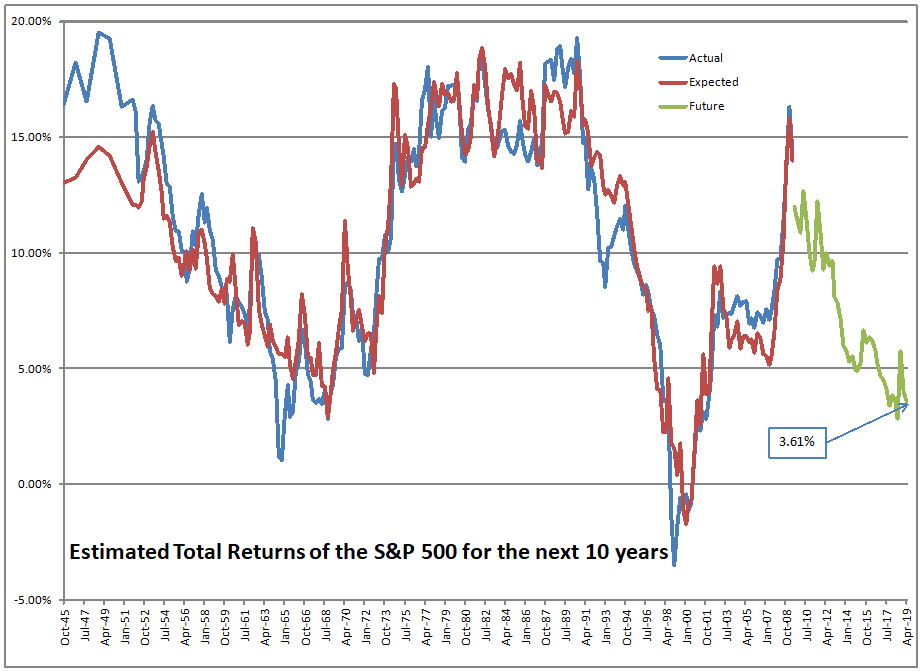
Note: this model fits reality a lot more tightly than most models… but it is not a short run model. It is very accurate over ten years. My, but this model seems to be forecasting another “lost decade.”

Image Credit: Aleph Blog

There are only seven values from history that compare with present levels. I choose scenarios where the expected return then was within 1%/year of the expected return now. Now, the estimate for where the S&P 500 will be 10 years from now is 3,555, which is lower than today, but given a 2% dividend yield, that still gives a 1.79%/year total return.

But empirically, the seven comparable scenarios give a lower total return of 0.92%/year for the next ten years. Admittedly, this is the “Law of Small Numbers.” (Would that academic finance writers would have that humility when analyzing models that have only twenty years of data, which means their results might just be an anomaly of the short period — which is true of most ESG studies.)

So now that you have had a tour of Wonderland, what should you do? Perhaps you should buy some 10-year single-A corporate bonds. You will likely get more return and your risk will be a lot lower. And who knows? If there is another market crisis, which is likely given abnormal monetary and fiscal policy, with high valuations, you might get a chance to buy stocks a lot lower. The same logic applies to gold, or even T-bills.

I’m not saying move everything immediately. After all, there is momentum, so things can go higher still. The odds of getting new highs are highest near new highs. Besides, we haven’t had any significant bankruptcies that weren’t C19-related.

But eventually, the tide will turn. Me? I’ve already lightened up, and have dry powder to buy good companies at moderate prices. As in the dot-com bubble, value investing finally turned after so many threw in the towel. I own companies that make good earnings relative to their prices, and have strong balance sheets. They will prosper better than most through tough scenarios.

They do ring a bell during the topping process. The trouble is that most put in earplugs as a result of the festivities so that they can ignore the naysayers. As such, I say to you, make adjustments before you get scared and wish you had done it earlier.

That’s all for now.

Estimating Future Stock Returns, June 2020 Update

Image Credit: Aleph Blog || Really, do you want to earn 3 1/2% for the next 10 years?

At present, the S&P 500 is priced to return 3.51%/year over the next ten years. Now if you were buying some ten-year investment grade corporate bonds, you might expect something around 2%. Is that 1.5% over corporates worth it?

Truly, I don’t know. That said, you have choices. The most overpriced segment of the market now is the large cap growth FANGMAN stocks, which accounts for around 25% of the S&P 500. You can choose safer areas:

  • Small cap stocks
  • Value stocks
  • Cyclical stocks
  • Foreign stocks, including emerging markets
  • Financial stocks, and maybe if you dare, energy stocks

Now I know that what I said here embeds an idea that GDP will start to grow again. Even with the lousy economic policy at present, over the next twelve months, under most conditions, the economy will grow as government reactions to the C19 virus decrease.

That said, the actions of the Fed in providing credit zoomed through the markets, and pushed stock prices up. Good for the wealthy, less good for ordinary people. Remember, I don’t think it is proper for the Fed to target the stock market. But that is what they are doing through QE.

Image Credit: Aleph Blog

The graph above shows what returns typically come when expected return level are as low as they are today. You shouldn’t be expecting much here. What?! You think the market will rise to the heights of the dot-com bubble and beyond?

Look, even if the big tech companies are profitable, having the S&P 500 in the mid-4000s is not sustainable. The companies will never grow into those valuations even if the economy recovers.

This is a time to lighten risk positions, or at least to move to stocks that have not been the leaders. Take this opportunity, and lessen your risks. Don’t drive through the rear-view mirror. Look to the mean-reversion that will come, as it did in 2000-2001.

Estimating Future Stock Returns, March 2020 Update

Graphic Credit: Aleph Blog, natch… same for the rest of the graphs here. Data is from the Federal Reserve and Jeremy Siegel

As I said last time, a lot can happen in 3 months. At the end of March 2020, a rally was starting that would become a new bull market. At that time, the market was poised to deliver a return over the next 10 years of 6.84%/year. As I write this evening, after the rally the likely return over the next ten years is 4.63%/year.

Hee are a few more graphs, and then I will come to my main point for this post.

25 scenarios — one down, 24 up over ten years, with an average likely return of 4.63$/year.

In general, this model fits the data well, but who can tell for the future? This is likely the best estimate over a ten-year horizon.

So, do you go for stocks here with a likely return of 4.63%/year, versus the Barclays’ Aggregate at around 2.5%/year or cash at around 0.2%/year? You can hear the siren call of TINA (There Is No Alternative) loud and clear.

Let me peel this back a bit for a moment, as one who once managed a large portfolio of bonds. Why not always buy the highest yielding bonds? The answer that would come back from the bright students would be: don’t the highest yielding bonds default more?

The bond manager that buys without question the higher yielding names presumes stability in the financial markets, and likely the economy as well. Defaults can affect the realized yield a lot. You might be getting more yield today, but will you be able to realize those yields? In addition to losses from defaults, many managers lose value during times of credit stress because they are forced to sell marginal bonds that they are no longer sure will survive at distressed prices.

I think the estimate of returns that I have given on the S&P 500 is a reasonable estimate — it’s not a yield, but an estimate of dividend yield and capital gains. 4.63%/year over 10 year certainly beats bond handily. But do you have the fortitude, balance sheet, and time horizon to realize it?

More say they have it than actually do have it. The account application form at my firm stresses the risks of investing, and talks about stock investors needing a long time horizon. I still get people who panic. The present situation, given the novelty of a virus “crowning” (idiom for a whack to the head) the market, and the market largely ignores it makes many panic, assuming that there must be a big fall coming soon.

Eh? There might be such a fall. The S&P 500 could reach a new high in July. Who cares — that is why I run a 10-year model — to take the emotion out of this. If you are afraid of the market now, you should do one of three things:

  1. Sell your stock now — you are not fit for stock investing.
  2. Sell your stock now, and choose two points where you will reinvest. What is the lower S&P 500 that would give you comfort to invest? Second, if after an amount of time the market doesn’t fall to the level that you dream of, at what date would you admit that you were wrong, and reinvest then.
  3. Do half — sell half of your risk away, moving it to safety. Again, try to set a rule for when you would reinvest.

In general, I don’t believe that there is no alternative to stocks, and I don’t think stocks are cheap, but in general, the optimists triumph in investing. I have been shaving down risk positions, but with the Fed doing nutty things like QE infinity (whatever it takes), buying corporate bonds and doing direct lending, I don’t see how the markets fall hard now. The dollar may be worth less when it is done, but I think it is likely that you will have more ten years from now by investing in stocks and risky assets like stocks, than to invest in safe assets.

When the Fed shifts, things will be different. As Chuck Prince, infamous former CEO of Citigroup once said:

“When the music stops, in terms of liquidity, things will be complicated,” Prince said. “But as long as the music is playing, you’ve got to get up and dance.”

What we have learned 10 years after Chuck Prince told Wall St to keep dancing

As I wrote in my Easy In, Hard Out pieces, the Fed will have a hard time removing stimulus. They tried and the market slapped them. Now they live in a “Brave New World” where they wonder what will ever force them to change from a position from a position of ever increasing liquidity. They try to not let it leak into the real economy, so there is little inflation for now.

But there is no free lunch. Something will come to discipline the Fed, whether it is inflation, a currency crisis — who knows? At that point, “things will be complicated.”

So what do I do? I own assets that will survive bad scenarios, I raise a little cash, but I am largely invested in stocks. To me, that is something that balances offense and defense, and doesn’t just focus on one scenario, whether it is a disaster, or the Goldilocks scenario of TINA.

Estimating Future Stock Returns, December 2019 Update

Graphic Credit: Aleph Blog, natch… same for the rest of the graphs here. Data is from the Federal Reserve and Jeremy Siegel

Here’s my once a quarter update. If you owned the S&P 500 at the end of 2019, it was priced to give you a return of 2.26%/year over the next 10 years. That said, the market has changed a lot in the last 2.6 months –as of the close of business on March 18th the market was priced to give you a return of 7.28%/year over the next 10 years. Finally, you have a chance to double your money over the next ten years, while a 10-year Treasury would give you 1.5%/year over the same horizon. To match the expected returns on stocks at this point in bonds, you would have to invest in junk debt, but junk typically doesn’t go longer than 10 years, and who knows what the defaults will be over the next two years?

Now, actual returns from similar levels have varied quite a bit in the past, so don’t take the 7.28%/year as a guarantee. WIth a 2%/year dividend yield, price returns have ranged from -0.95%/year to 6.89%/year, with most scenarios being near the high end.

At the end of 2019, valuations were higher than any other time in the past 75 years, excluding late 1964, and the dot-com bubble. It is not surprising there was a bear market coming. Because “there was no alternative” to stocks, though, it took an odd external event or two (COVID-19, oil price war) to kick bullish investors into bear mode. This was not a supply and demand issue in the primary markets. This was a shift in estimates of investors regarding the short-term effects of the two problems extended to a much longer time horizon.

Two more graphs, and then some commentary on portfolio management. First, the graph on the channel the market travels in, subject to normal conditions:

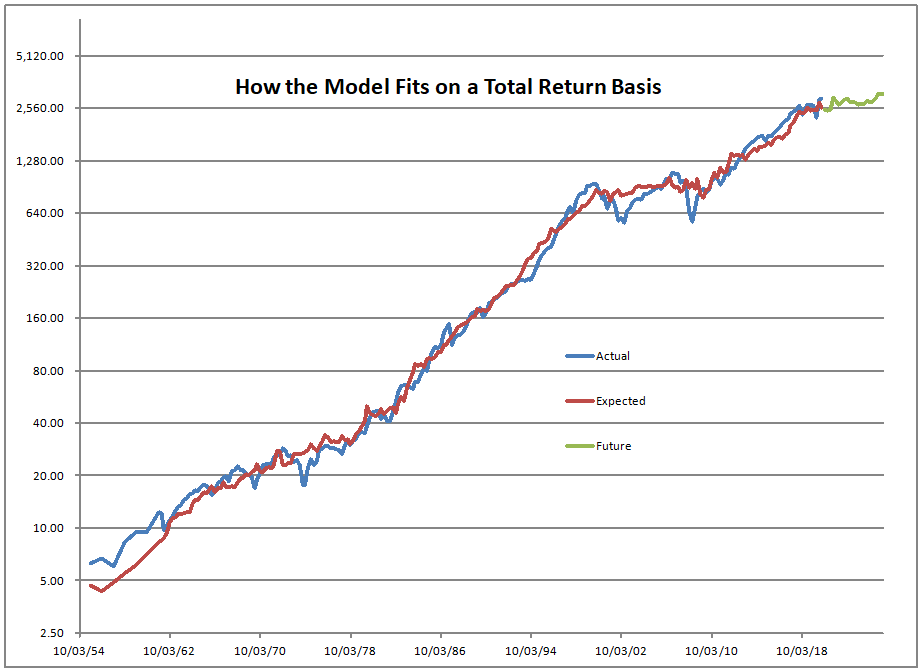
This graph shows how the model estimates the price level of the S&P 500. It is most accurate at the present, because the model works off of total returns, not just the price level. The gap between the red and blue lines is mostly the effect of the present value of future dividends, which are reflected in the red line and not the blue.

The maximum and minimum lines have hindsight bias baked into them, but it gives you a visual idea of how high the market was at any given point in time — note the logarithmic scale though. If you are in the middle using linear distance, you are a little closer to the bottom than the top.

And finally, that’s how well the model fits on a total return basis. Aside from the early years, it’s pretty tight. The regression explains more than 88% of the total variation in returns.

Implications for Asset Allocation

If you haven’t read it, take a look at my article from yesterday. I am usually pretty disciplined about rebalancing, but this bear market I waited a while, and created two schedules for my stock and balanced fund products to adjust my cash and bond versus stock levels. I decided that I would bring my cash levels to normal if the market is priced to give its historical return, i.e. 9.5%/year over the next ten years. That would be around 2100 on the S&P 500. Then I would go to maximum stock when the market is offering a 16%/year return, which is around 1300 on the S&P 500.

The trouble is this is psychologically tough to do when the market is falling rapidly. I am doing it, but when I rebalance at the end of the day I sometimes wonder if I am throwing my money into the void. Remember, I am the largest investor in my strategies, and if my ideas don’t work, I will lose clients, so this is not an idle matter for me. I’m doing my best, though my call on the market was better during the first decade of the 2000s, not the second decade.

In the process, I bought back RGA at prices at which I love to have it, and have been reinvesting in many of the companies I own at some really nice levels… but for now, things keep going down. That’s the challenge.

In summary, we have better levels to invest at today. Stocks offer better returns, but aren’t screaming cheap. Some stocks look dirt cheap. Most people are scared at the speed of the recent fall. I view my job as always doing my best for clients, and that means buying as the market falls. I will keep doing that, but I have already lost a few clients as a result of doing that, even though I tell them in advance that I will do that. So, I will soldier on and do my best.

Full disclosure: long RGA for clients and me

Estimating Future Stock Returns, September 2019 Update

Estimating Future Stock Returns, September 2019 Update

As I have been writing about this topic for 3+ years, I want you to understand what my greatest doubt is regarding this theory. I can’t predict the ratio of the value of equities to the value of all assets well. Thus, each quarter when I write, I have a surprise, because the ratio changes in ways that I can’t explain.

Is the difference that big? No, but I would like to be able to track the differences better, so that I can have a better explanation for what is going on.

The variable of the ratio of the value of equities to the value of all assets is composed of two separate variables:

  • The value of equities
  • The value of everything else

To understand the ratio, I needed to understand how the two underlying variables behaved. I had two hypotheses:

  1. The value of equities would track the S&P 500.
  2. The value of everything else would track the returns on T-bills and 10-year T-notes.

My first hypothesis was not falsified. The regression that I ran of increases in the value of equities against the returns on the S&P 500 had an intercept near zero, and a beta coefficient near one. The joint hypothesis test did not falsify the idea of the intercept being zero and the slope coefficient being one. The R-squared was 83%.

The second hypothesis validated the idea that T-bill returns were correlated with the growth of all other assets, but not 10-year T-notes. The sign on the T-notes was negative and insignificant. The upshot of the regression was that all other assets grew at roughly (5% + 0.5 * T-bill yield) per year. The R-squared was 27%.

Now over the last 10 years, the value of all equities was drawn down by 0.82%/quarter. So, with the growth in “all other assets” and the diminution of the value of all equities net of unrealized capital gains, the ratio variable has always tended to decline versus a forecast that naively applies the appreciation of the S&P 500 to the ratio.

So, now I have two “facts:”

  • The value of equities appreciates at the rate of the S&P 500 less 0.82%/quarter. On net, people take money out of stocks.
  • The value of everything else appreciates at the rate of (1.25% + half the T-bill rate) per quarter. It’s as if half of the money is in the bank, earning nothing, and the other half is in T-bills. On net people add money to their non-risk assets.

As such, I have a good idea as to how the ratio should track over time. It’s not perfect. There will be surprises. But it should minimize the differences period to period.

With the run in the markets since September 30th, the estimated return on the S&P 500 over the next ten years has fallen from 3.92%/year to 2.97%/year. Expected return levels like that are in the lowest 5% of returns.

That said, return regimes often last longer than they should, and result in larger mis-valuations than should ordinarily occur. Part of the misvaluation here is that interest rates are low, and there is no alternative to stocks.

My view is that cash will not lose. Bonds will lose a little. Stocks may lose a lot. I am not yet trading out of stocks, but I am getting closer to doing so.

Be wary. Valuations are elevated. Reduce equity exposure as you get the opportunity. If valuations rise further, I will reduce my own stock holdings. I only write about this quarterly, so this is my warning to you. Consider selling some of your stocks.

Estimating Future Stock Returns, June 2019 Update

Mmmm… it’s been 18 months since I did an update on this model. Here was the last one. The old article was written on 14 March 2018, and it said:

As it is today, the S&P 500 is priced to deliver returns of 3.24%/year not adjusted for inflation over the next ten years.? At 12/31/2017, that figure was 3.48%, as in the graph above.

https://alephblog.com/2018/03/14/estimating-future-stock-returns-december-2017-update/

And so now I say to you: As it is today, the S&P 500 is priced to deliver returns of 3.39%/year not adjusted for inflation over the next ten years.? At 6/30/2019, that figure was 3.61%, as in the graph above.

It’s fascinating how little changed over that period of time. SInce the last article, the S&P 500 returned 8.8% on a price basis with around 3% of dividends over the 18 month period. The ratio of their assets the US investors keep in stocks has also barely changed, going from 43,8% to 44,2%, (Geek note: the Fed’s estimate of that for prior periods shifts over time — today they estimate that ratio for 12/31/2017 to be 44.6%. This makes comparability of results and backtesting difficult.)

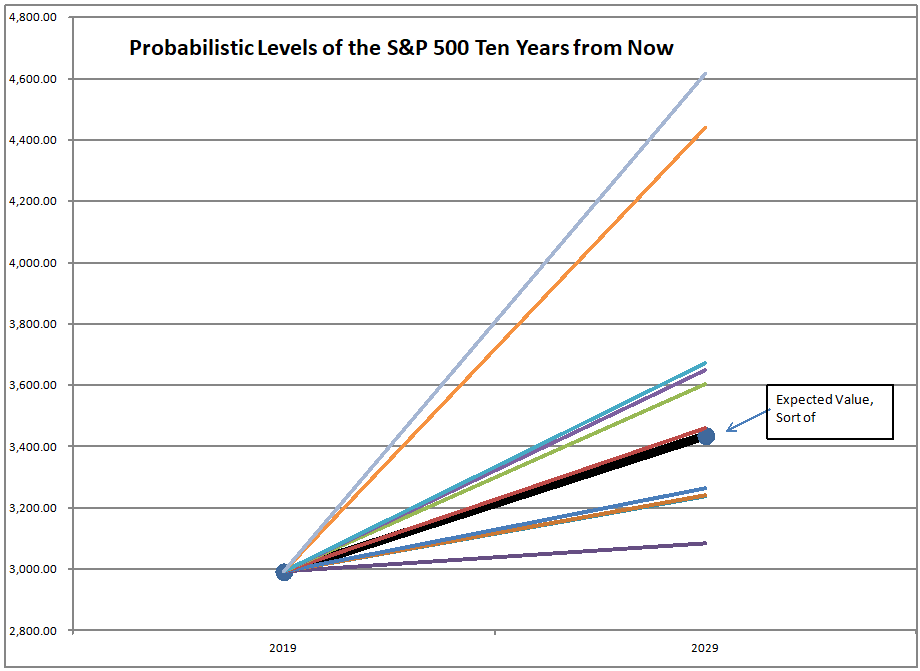
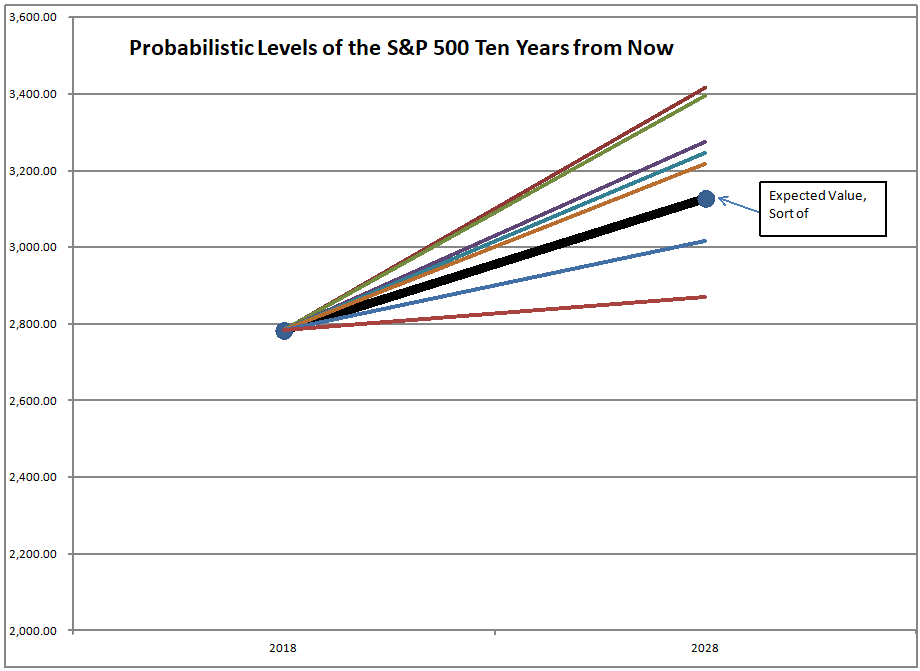
Using the ten scenarios from the past where the model was expecting returns between 2.39% and 4.39%, here’s what the results look like for the future on a probabilistic basis:

Will you be excited in mid-2029 if the S&P 500 is around 3400?

The ten scenarios came from the following years: 1968, 1969, 1997, 2001 and 2002. The high scenarios are 1997. The low scenarios come from 2001-2002.

My point forecast and the median value are close to each other. That is usually true.

So, should we be excited to earn 3.39%/yr for 10 years? Preserving capital would be a good thing, but many pension systems need a lot more than that. 3.39%. 3.39% is what an average low Single-A or High-BBB/Baa would yield in this environment.

Not knowing what inflation or deflation will be like, it would be difficult to tell whether the bond or stock would be riskier, even if I expected 3.39% from each on average. Given the large debts of our world, I lean to deflation, favoring the bond in this case.

Still, it’s a tough call because with forecast returns being so low, many entities will perversely go for the stocks because it gives them some chance of hitting their overly high return targets. If this is the case, there could be some more room to run for now, but with nasty falls after that. The stock market is a weighing machine ultimately, and it is impossible to change the total returns of the economy. Even if an entity takes more risk, the economy as a whole’s risk profile doesn’t change in the long run.

In the short run it can be different if strongly capitalized entities are taking less risk and and weakly capitalized entities are taking more risk — that’s usually bearish. Vice-versa is usually bullish.

Anyway, give this some thought. Maybe things have to be crazier to put in the top. At least in this situation, bonds and stocks are telling the same story, unlike 1987 or 2000, where bonds were more attractive. Now, alternatives are few.

Estimating Future Stock Returns, December 2017 Update

Estimating Future Stock Returns, December 2017 Update

The future return keeps getting lower, as the market goes higher

=================

Jeff Bezos has a saying, “Your margin is my opportunity.”? He has found ways to eat the businesses of others by providing the same goods and services at a lower cost.? Now, that makes Amazon more productive and others less productive.? The same is true of other internet-related businesses like Google, Netflix, etc.

And, there is a slight net benefit to the economy from the creative destruction.? Old capital gets recycled.? Malls that are no longer so useful serve lower-margin businesses for locals, become homes to mega-churches, other area-intensive human gatherings, or get destroyed, and the valuable land so near many people gets put to alternative uses that are better than the mall, but not as profitable as the mall prior to the internet.

Laborers get released to other work as well.? They may get paid less than they did previously, but the system as a whole is more productive, profits rise, even as wages don’t rise so much.? A decent part of that goes to the pensions of oldsters — after all, who owns most of the stock?? Indirectly, pension plans and accounts own most of it.? As I have sometimes joked, when there are layoffs because institutional investors representing pension plans? are forcing companies to merge, or become more efficient in other ways, it is that the parents are laying off their children, because there are cheaper helpers that do just as well, and the added profits will aid their deservedly lush retirement, with little inheritance for their children.

It is a joke, though seriously intended.? Why I am mentioning it now, is that a hidden assumption of my S&P 500 estimation model is that the return on assets in the economy as a whole is assumed to be constant.? Some will say, “That can’t be true.? Look at all of the new productive businesses that have been created! The return on assets must be increasing.”? For every bit of improvement in the new businesses, some of the old businesses are destroyed.? There is some net gain, but the amount of gain is not that large in aggregate, and these changes have been happening for a long time.? Technological progress creates and destroys.

As such, I don’t think we are in a “New Era.”? Or maybe we are always in a “New Era.”? Either way, the assumption of a constant return on assets over time doesn’t strike me as wrong, though it might seem that way for a decade or two, low or high.

As it is today, the S&P 500 is priced to deliver returns of 3.24%/year not adjusted for inflation over the next ten years.? At 12/31/2017, that figure was 3.48%, as in the graph above.

We are at the 95th percentile of valuations.? Can we go higher?? Yes.? Is it likely?? Yes, but it is not likely to stick.? Someday the S&P 500 will go below 2000.? I don’t know when, but it will.? There are enough imbalances in the world — too many liabilities relative to productivity, that crises will come.? Debt creates its own crises, because people rely on those payments in the short-run, unlike stocks.

There are many saying that “there is no alternative” to owning stocks in this environment — the TINA argument.? I think that they are wrong.? What if I told you that the best you can hope for from stocks over the next 10 years is 4.07%/year, not adjusted for inflation?? Does 1.24%/year over the 10-year Treasury note really give you compensation for the additional risk?? I think not, therefore bonds, low as they may be, are an alternative.

The top line there is a 4.07%/year return, not adjusted for inflation

If you are happy holding onto stocks, knowing that the best scenario from past history would be slightly over 3400 on the S&P 500 in 2028, then why not buy a bond index fund like AGG or LQD that could virtually guarantee something near that outcome?

Is there risk of deflation?? Yes there is.? Indebted economies are very susceptible to deflation risk, because wealthy people with political influence will always prefer an economy that muddles, to higher taxes on them, inflation, or worst of all an internal default.

That is why I am saying don’t assume that the market will go a lot higher.? Indeed, we could hit levels over 4000 on the S&P if we go as nuts as we did in 1999-2000.? But the supposedly impotent Fed of that era raised short-term rates enough to crater the market.? They are in the process of doing that now.? If they follow their “dot plot” to mid-2019 the yield curve will invert.? Something will blow up, the market will retreat, and the next loosening cycle will start, complete with more QE.

Thus I am here to tell you, there is an alternative to stocks.? At present, a broad market index portfolio of bonds will likely outperform the stock market over the next ten years, and with lower risk.? Are you ready to make the switch, or at least, raise your percentage of safe assets?

Estimating Future Stock Returns, September 2017 Update

Estimating Future Stock Returns, September 2017 Update

Another quarter goes by, the market rises further, and the the 10-year forward return falls again.? Here are the last eight values:?6.10%, 6.74%, 6.30%, 6.01%, 5.02%, 4.79%, and 4.30%, 3.99%. ?At the end of September 2017, the figure would have been 4.49%, but the rally since the end of the quarter shaves future returns down to 3.99%.

At the end of June the figure was 4.58%.? Subtract 29 basis points for the total return, and add back 12 basis points for mean reversion, and that would leave us at 4.41%.? The result for September month-end was 4.49%, so the re-estimation of the model added 8 basis points to 10-year forward returns.

Let me explain the adjustment calculations.? In-between quarterly readings, price movements shave future returns the same as a ten-year zero coupon bond.? Thus, a +2.9% move in the total return shaves roughly 29 basis points off future returns. (Dividing by 10 is close enough for government work, but I use a geometric calculation.)

The mean-reversion calculation is a little more complex.? I use a 10-year horizon because that is the horizon the fits the data best.? It is also the one I used before I tested it.? Accidents happen.? Though I haven’t talked about it before, this model could be used to provide shorter-run estimates of the market as well — but the error bounds around the shorter estimates would be big enough to make the model useless. It is enough to remember that when a market is at high valuations that corrections can’t be predicted as to time of occurrence, but when the retreat happens, it will be calamitous, and not orderly.

Beyond 10-years, though, the model has no opinion.? It is as if it says, past mean returns will occur.? So, if we have an expectation of a 4.58% returns, we have one 4.58%/yr quarter drop of at the end of the quarter, and a 9.5% quarter added on at the end of the 10-year period. That changes the quarterly average return up by 4.92%/40, or 12.3 basis points.? That is the mean reversion effect.

Going Forward

Thus, expected inflation-unadjusted returns on the S&P 500 are roughly 3.99% over the next ten years.? That’s not a lot of compensation for risk versus investment-grade bonds.? We are at the 94th percentile of valuations.

Now could we go higher?? Sure, the momentum is with us, and the volatility trade reinforces the rise for now.? Bitcoin is an example that shows that there is too much excess cash sloshing around to push up the prices of assets generally, and especially those with no intrinsic value, like Bitcoin and other cryptocurrencies.

Beyond that, there are not a lot of glaring factors pushing speculation, leaving aside futile government efforts to stimulate an already over-leveraged economy.? It’s not as if consumer or producer behavior is perfectly clean, but the US Government is the most profligate actor of all.

And so I say, keep the rally hats on.? I will be looking to hedge around an S&P 500 level of 2900 at present.? I will be watching the FOMC, as they may try to invert the yield curve again, and crash things.? They never learn… far better to stop and wait than make things happen too fast.? But they are omnipotent fools.? Maybe Powell will show some non-economist intelligence and wait once the yield curve gets to a small positive slope.

Who can tell?? ?Well, let’s see how this grand experiment goes as Baby Boomers arrive at the stock market too late to save for retirement, but just in time to put in the top of the equity market.? Though I am waiting until S&P 2900 to hedge, I am still carrying 19% cash in my equity portfolios, so I am bearish here except in the short-run.

PS — think of it this way: it should not have gone this high, therefore it could go higher still…

Theme: Overlay by Kaira