One of my Finacorp colleagues pointed me to some Fed funds data yesterday, and it made me want to write an article. He pointed out something that looked anomalous about the way Fed funds is trading, namely, that on many days in the last month, that some trades are going on where some banks out there are accepting almost zero for the rate on investing excess reserves.
Let me back up. We talk about Fed funds all the time, but we don’t often stop to talk about what it means. Banks and thrifts have to keep non-interest bearing reserve funds at the Fed. Those funds can be deposited by the depositary institution at the Fed, or, they can borrow the funds from another institution that has excess funds deposited at the Fed. Thus there is an active lending market between banks for reserves deposited at the Fed. The weighted average rate at which these overnight loans get done is called the effective federal funds rate.
The Fed influences where Fed funds trades through open market operations, where they lower the Fed funds rate by increasing the supply of reserves to the system through temporary repurchase transactions, and outright purchases of securities through the creation of new credit, thus expanding its balance sheet (a permanent injection of liquidity). The Fed raises the Fed funds rate by decreasing the supply of reserves to the system through temporary reverse repurchase transactions, and outright purchases of securities which reduces credit, and shrinks the balance sheet of the Fed (a permanent reduction of liquidity — rare).
All the guessing games that go on around FOMC meetings today, revolve around the Fed funds target rate. That’s the rate the the Fed in the short run says that it will try to keep the effective Fed funds rate at, primarily through temporary measures using repurchase and reverse repurchase transactions.
Back to the Present
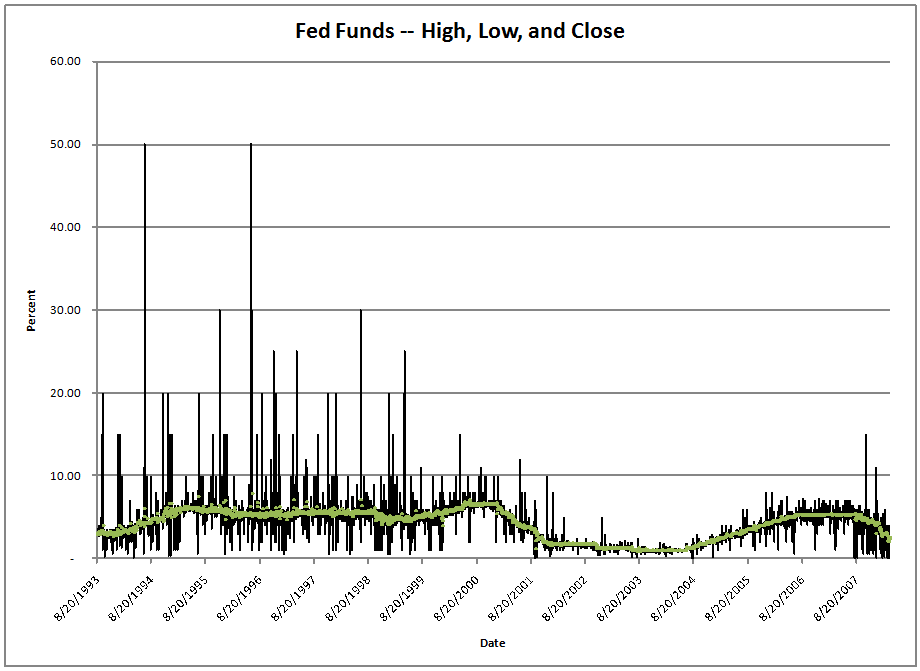
Since August 1993, the high and low transaction yields for Fed funds each day have been recorded. The following graph shows the high, low, and effective Fed funds rate from then until the present.

As you can see, the difference between the high and low for Fed funds on a given day can be substantial.? Most commonly the big ranges happen near the end of accounting periods, or at minor financial panics, whether for legitimate reasons (LTCM, 9/11), or dubious reasons (Y2K).? In any case, there can be a scramble for overnight fed funds, leading to a very large high rate for the day.? Conversely, there can be a very small low rate for the day when enough institutions have significant excess funds to lend at Fed funds, and few takers at some point during the day.
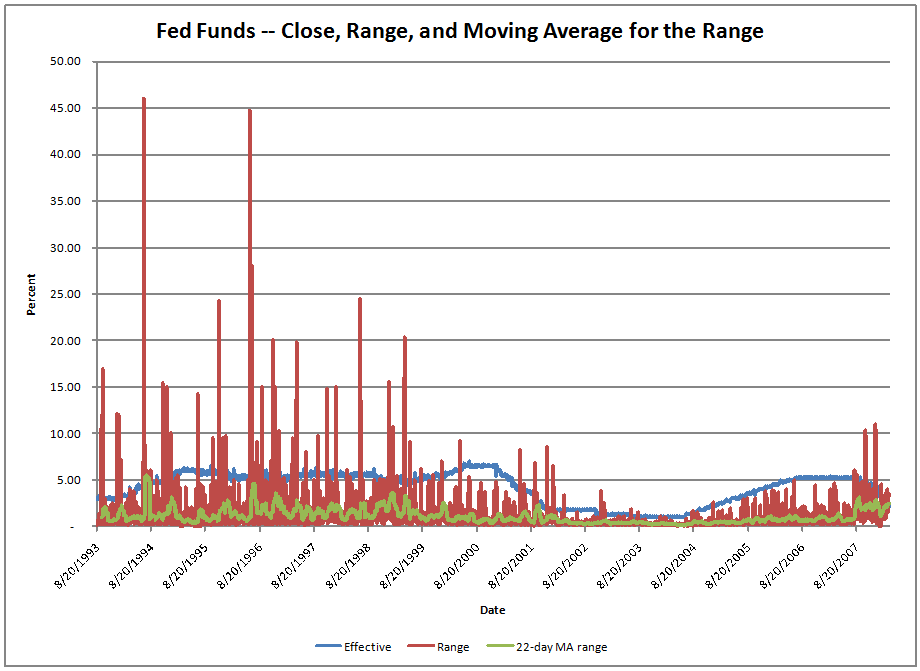
That range between high and low Fed funds can be quite large, as you can see in the following graph.? In order to show the persistence of the range, to flatten out the influence of disasters, and quarter- and year-ends, I threw in a 22-day moving average, which is meant to approximate the rolling monthly average.

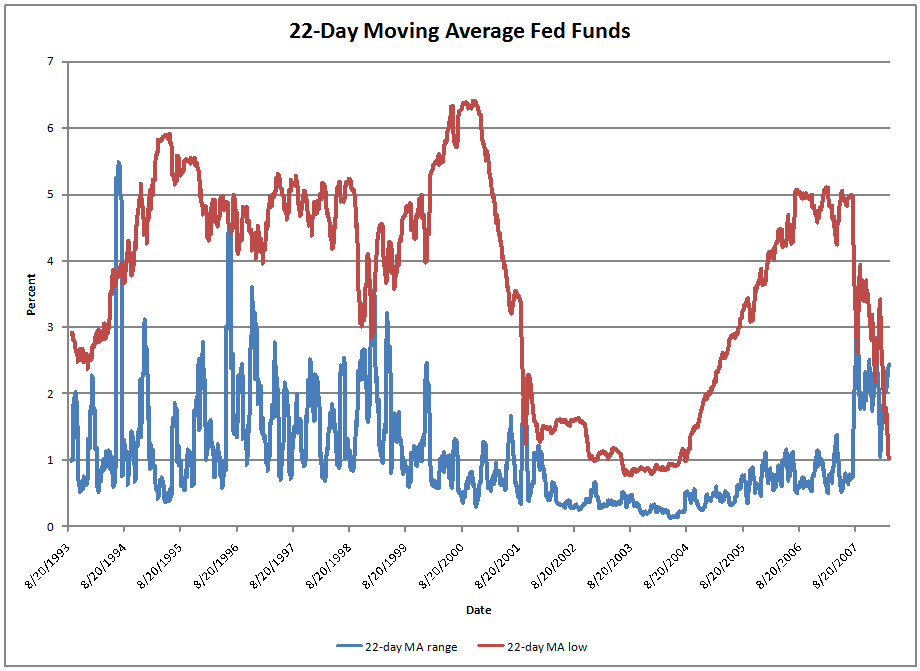
In this present environment, I am most concerned with how low Fed funds trades on a daily basis.? Since that is a noisy figure as well, I applied a 22-day moving average there.

The range for Fed funds trading is high on a monthly average basis, butnot as high as it was at points back in the mid-90s. Short-term interest rates were higher then, so there was more room on the downside for the range to expand, which is not possible today.? What is unusual now is that the low trade for Fed funds is averaging near the levels achieved during the wondrous 1%-1.25% Fed funds rate policy that the Greenspan Fed instituted from late 2002 to mid-2004.
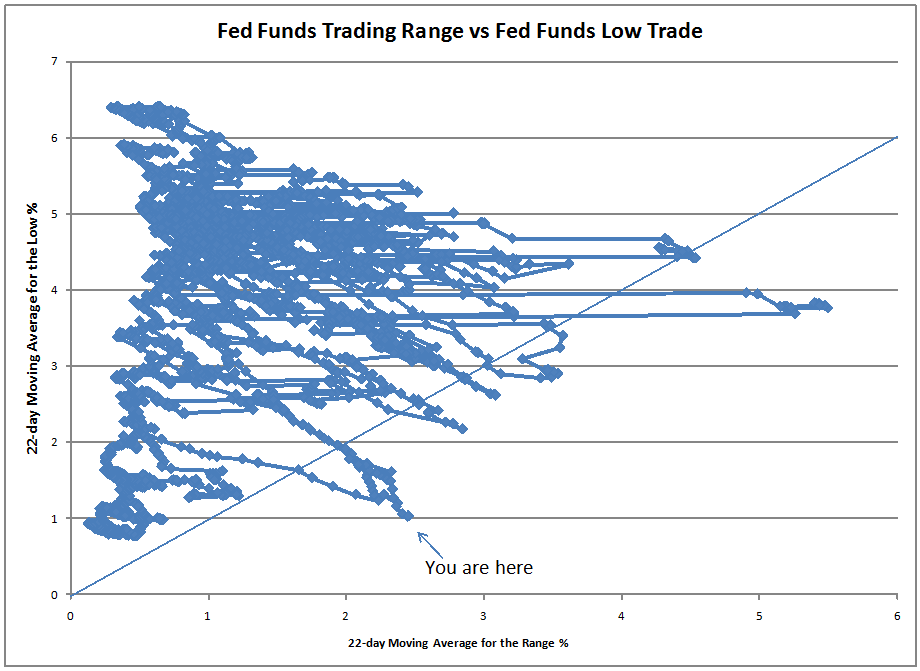
In the midst of a period where liquidity is so scarce, we have a situation where some banks are having a hard time getting a good yield from Fed funds.? To summarize the situation, look at my final graph:

This is a scatterplot to show how the moving averages for low Fed funds varies against the range for Fed funds.? The diagonal line is there for convenience to show where the moving averages for the range and the low would be equal.? Back during the 2002-2004 era, though rates were low, Fed funds traded in a tight band.? In the mid-90s, rates were higher, but we had occasional periods where the range would explode for accounting or crisis reasons.
Now we are in a period where we have a volatile range for Fed funds amid low rates.? This is unusual.? I’m open to new ideas here, but it seems that the liquidity situation in Fed funds is volatile enough that some banks end up snapping at low yields at some point each day.? Just another piece in a difficult policy period for the banks and the Fed.? If I have to speculate, it indicates that some banks are already awash in liquidity, and aren’t sure what to do with it.

Maybe I misunderstood what was being covered, but I think Paul Krugman mentioned this a couple weeks back here and here and I think some others. His blog is not easy to skim the archives.
He concluded, banks were scarred to lend. Except for the case of imminent insolvency, I suppose if you won’t lend, then yeah, you are by definition awash in liquidity.
But no, I’m not sure what it all means or portends, or if I’ve even kept it all straight. But at least it seems my confusion puts me in good company.
David,
Thank you for such a cogent explanation of what trends you are seeing and possibly why you are seeing them(rare). I often struggle to understand the larger meaning being all these strange unexplained references I here about ABX indexes (care to explain that one?) and other such mysterious acronyms.
One thing that I didn’t understand from your article was your reference to 9/11/2001. I didn’t see any remarkable change in the interest rate on the graph around that date? Did I miss something?
David,
I haven’t looked at the data to see if this is way off base or not, but one important thing to remember is that the NY Fed generally does its trading in the morning and lets the rest of the day go as is. Now if the demand for funds is high, the NY Fed will have to throw in as much liquidity as they can in the morning to keep the effective funds rate close to their target. During “normal” times, after the NY Fed ends its open market operations each day, banks keep close to the fed funds rate (maybe because they figure that they can always wait until the next day if they can’t get a good rate), but during “crisis” times like now, banks don’t have a choice so if they start off the day thinking things will be fine, but by the afternoon things aren’t looking so hot then they will have to borrow at any cost without the luxury of waiting for another day.
Is it possible that the Fed is gaming the borrowings to keep the weighted avg close to the target rate…ie Bank A (a perceived higher risk) can only borrow at 4.25% rate, so to lower the effective rate, the Fed also lends to JPM at 0.25%, so blended is 2.25%? I’m not an expert by any means on the mechanics of the borrowings, but if something like this is going on, it would mean the Fed has a difficult time lower rates further.
Fascinating David. I’ve no idea, but I’m curious if knowing what the other periods when the below average lows were “violently” exceded might explain something. ?? Maybe they would give some historical prospective about this phenomenon?
A quick comment about # 2. I hope I interpert your question right. The ABX as presented by MARKIT has been blamed for misrepresenting the market value as data come from very thin trades. See http://www.markit.com for explainations.
A second effect is with the accounting rule 157 level 3 definition. There is an exception to level 3 in that fair value does not have to be used on “distressed” trades. I think this has an effect that fewer trades get made. I assume the company lawyers would not want any manager to list a trade as “distressed” because of liability issues. That is, the don’t want to look like that they have made a mistake.
A third issue is that the SIV’s or conduits have trigger points based on net asset value or some similar formula where they have to stop trading or even dissolve the fund. I have heard no one blame the ABX for a fund closure yet but I am out of the loop in Minnesota so I am far away from most news and rumors.
It is not perfect data but it is what we have.