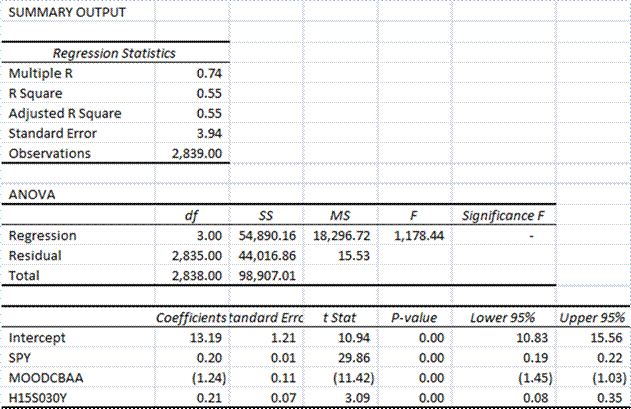
I like CXO Advisory, and always read them as they publish.? That said, I think they sometimes have a weakness in their methods by not using multivariate techniques when it would make sense.? So, when their article, “Interest Rates and Utilities,” I asked myself, “What would this look like if I used multiple regression?”
Rather than looking at correlations one at a time, multiple regression looks at them all at once, and tries to analyze which are the biggest factors.? Now unlike CXO, I used interest rate variables that have credit risk.? Why?? Corporations face credit risk, and they fund themselves with risky paper, unlike the US Treasury.? So, my two interest rate variables are the Moody’s Corporate Baa Average, which contains only long bonds, and the 30-day A2/P2 commercial paper yield as calculated by the Fed [H15s030Y].? These better measure funding costs for corporations.


All of these variables are highly significant.? Two go the way one would suspect, and one doesn’t.? Like REITs, performance is positively related to the market as a whole, and negatively related to Baa yields.
But, A2/P2 yields are positively related to returns.? Fascinating, and a reason why we should always use the long and short end of the yield curve for analyses.? They don’t measure the same thing.? Short-term liquidity is different from long-term borrowing rates.
Why are short-term rates positively related to returns?
- They are a measure of confidence in the economic system.
- Inflation drives both short-term rates and utility profit margins.
At least, I think that is the case.? As I often say, be skeptical about statistical arguments about the market, particularly when there is little economic reasoning behind the discussion.
With that, I simply say that yes, higher long-term interest rates do affect utility stock prices.? And higher short term rates will indicate inflation, and drive utility prices higher.? Beyond that utilities go higher as the market does, but the beta is low.
Are Utilities Like Bonds or Like Stocks?? They are like both of them.? Learn to enjoy that, unless the regulatory regime changes.

It would be interesting to see the same regression using SPY as the dependent variable. Maybe SPY has similar correlations with CP and corp bond yields, and utilities’ correlations with these datapoints are simply the result of its correlation with SPY.
Very nice.
Utilities, like TIPS but not like most bonds, keep their “principal” value. So if I had the time I would look at, say, rolling 5 yr returns, which might have weaker negative correlation with long bonds.
We need to see some bivariate results as well. If your short term and long term rates are highly correlated, you may have a case of multi-collinearity. This makes all of the coefficients unstable. There is no way to tell without looking at the correlation matrix and doing the regression without each of the variables.
Just a thought – –
Jeff