Image Credit: Aleph Blog || No, abnormal monetary has many significant costs, not the least of which is an asset bubble that feeds a debt bubble.
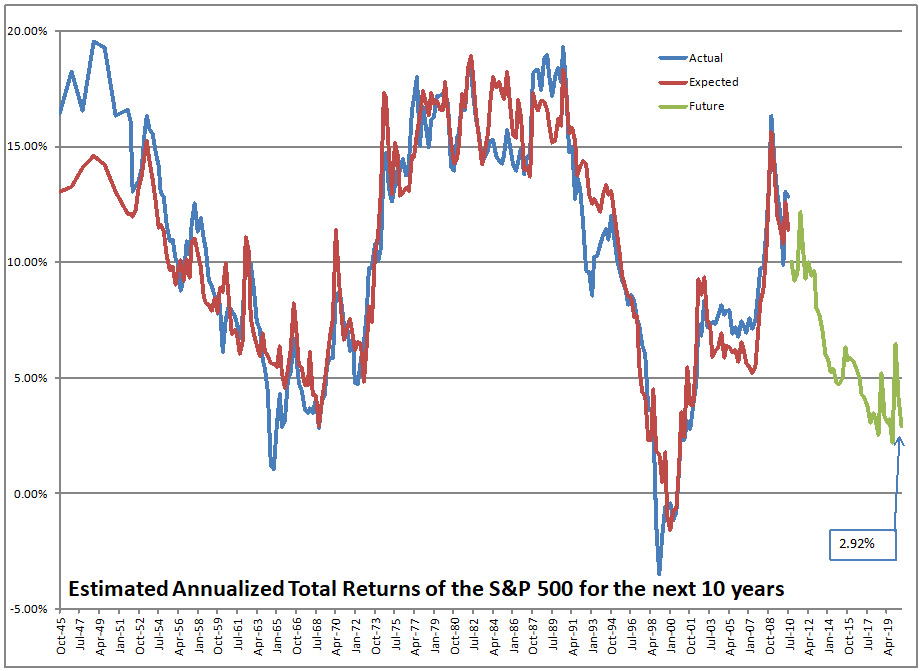
Welcome to Wonderland, boys and girls. At the end of the third quarter, the S&P 500 was priced to return 2.92%/yr for the next ten years, with no adjustment for inflation. You might say, “But David, you’ve reported levels that low in the past, and you were concerned, but you never said ‘Wonderland.'”
True, but the market has rallied further since the end of the quarter, and the level of the S&P 500 now is priced to return 1.79%/yr for the next ten years, with no adjustment for inflation. That’s in the 97th percentile of valuations. Another reason I didn’t say ‘Wonderland’ in the past was that there were a few values in the 1960s that were comparable to valuations. Now the only comparables are from the dot-com bubble. Thus, welcome to Wonderland.
Now, the valuation levels of the Wonderland era lasted for 3 years and 3 months, from the end of the first quarter of 1998 to the end of the second quarter of 2001. It was a period where monetary policy was extremely loose, before tightening enough to send the market into a tailspin, even as many claimed that interest rates have no effect on growth stocks.
Let me post the rest of my graphs, and I will finish my thoughts.

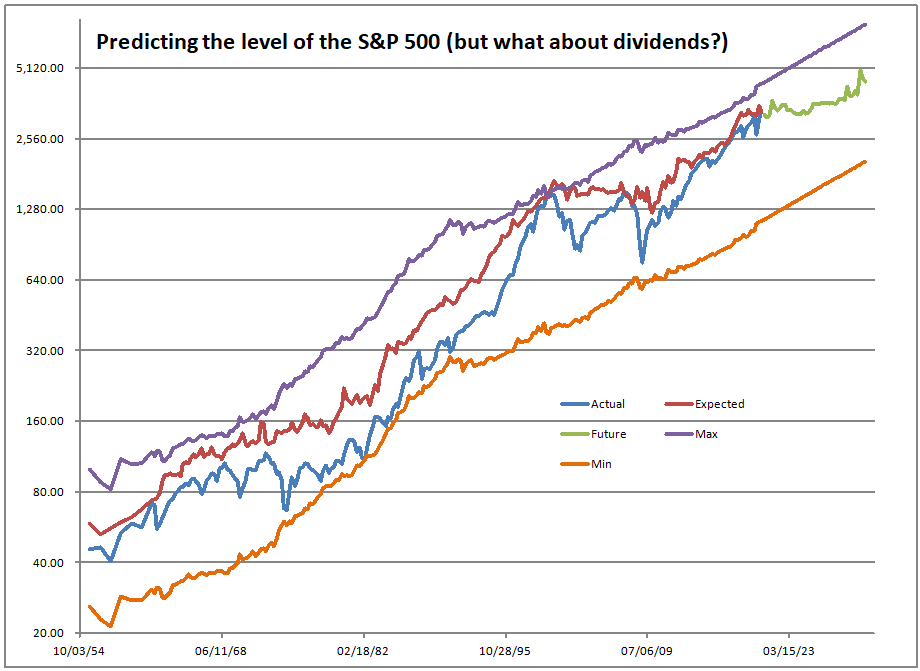
Note that we are considerably closer to the maximum valuation levels than to the minimum levels. If we wanted to create a new maximum level, we would have to rally 19.4% from present levels.

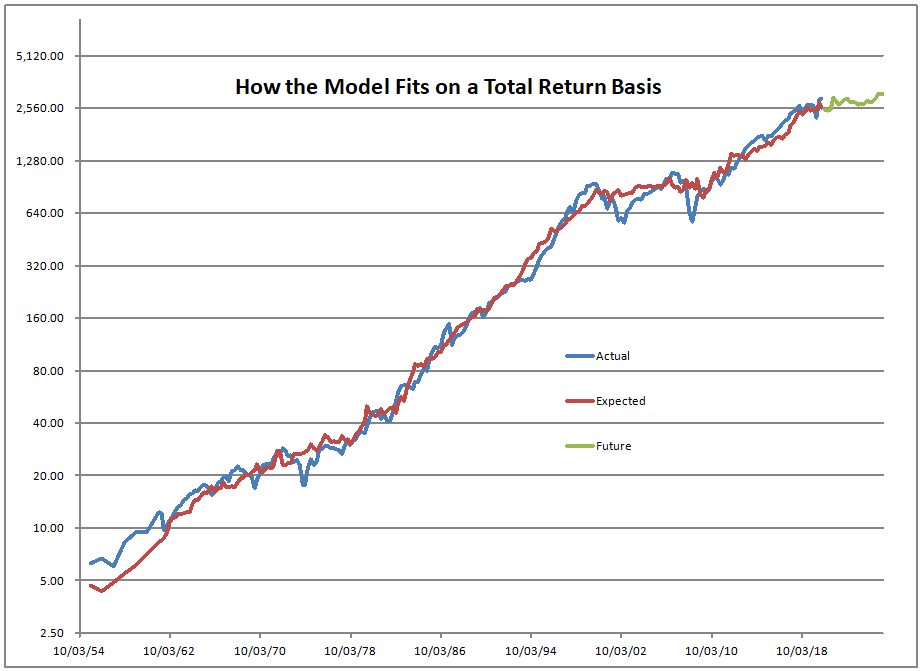
Note: this model fits reality a lot more tightly than most models… but it is not a short run model. It is very accurate over ten years. My, but this model seems to be forecasting another “lost decade.”

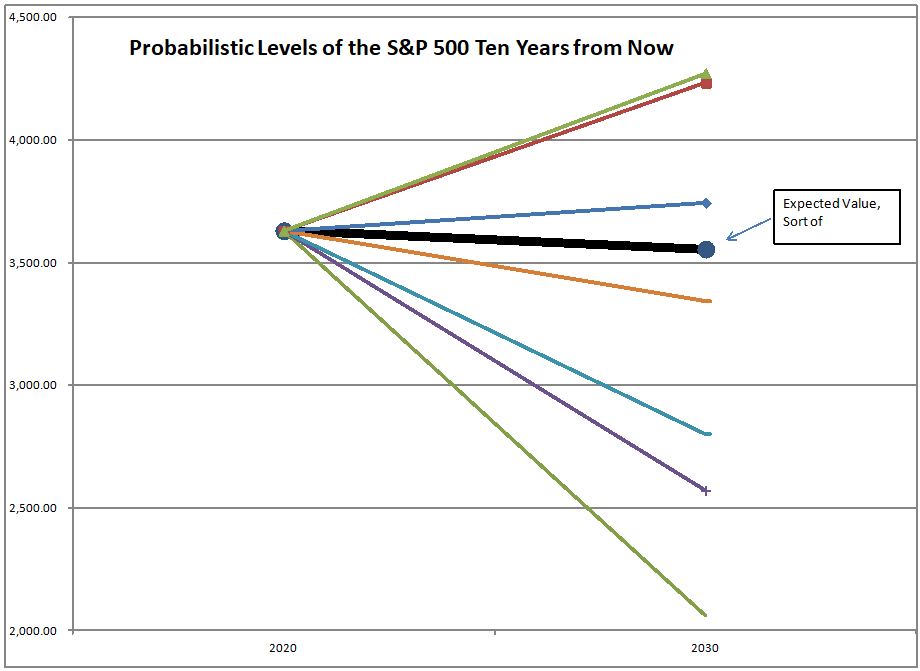
There are only seven values from history that compare with present levels. I choose scenarios where the expected return then was within 1%/year of the expected return now. Now, the estimate for where the S&P 500 will be 10 years from now is 3,555, which is lower than today, but given a 2% dividend yield, that still gives a 1.79%/year total return.
But empirically, the seven comparable scenarios give a lower total return of 0.92%/year for the next ten years. Admittedly, this is the “Law of Small Numbers.” (Would that academic finance writers would have that humility when analyzing models that have only twenty years of data, which means their results might just be an anomaly of the short period — which is true of most ESG studies.)
So now that you have had a tour of Wonderland, what should you do? Perhaps you should buy some 10-year single-A corporate bonds. You will likely get more return and your risk will be a lot lower. And who knows? If there is another market crisis, which is likely given abnormal monetary and fiscal policy, with high valuations, you might get a chance to buy stocks a lot lower. The same logic applies to gold, or even T-bills.
I’m not saying move everything immediately. After all, there is momentum, so things can go higher still. The odds of getting new highs are highest near new highs. Besides, we haven’t had any significant bankruptcies that weren’t C19-related.
But eventually, the tide will turn. Me? I’ve already lightened up, and have dry powder to buy good companies at moderate prices. As in the dot-com bubble, value investing finally turned after so many threw in the towel. I own companies that make good earnings relative to their prices, and have strong balance sheets. They will prosper better than most through tough scenarios.
They do ring a bell during the topping process. The trouble is that most put in earplugs as a result of the festivities so that they can ignore the naysayers. As such, I say to you, make adjustments before you get scared and wish you had done it earlier.
That’s all for now.


Just a thought: if you apply the model to the Wilshire 5000, you get a broader picture of the stock market and there is a price and a total return data series for it on Fred. On the other hand, it only goes back to the 70s.
And if you want to interpolate the quarterly debt series, I use the differences in the series Loans and Leases in bank credit and market value of gross federal debt to get some sort of in-between-value. I also have adapted the model to the german stock market, it has a very nice fit also. Send me an e-mail if you are interested in the data.
Kind regards from germany!
Greetings from America, where Merkel is a less common name than Germany, where 7/8ths of my forebears came from. If we regressed the returns of the W5000 on the S&P 500, we would get a beta very close to one, because they are both largely cap-weighted indexes, and less than 1% of the market cap of W5000 is in stocks not in the S&P 500.
What you are doing sounds interesting, and I will email you. Thanks, Marcel.
You are absolutly right about the beta, I thought this time might be a little bit different, as some companies, valued in the hundreds of billions of dollars, tesla comes to mind, are not yet included in the s&p 500, so interpolating the aggregated market cap via the s&p 500 might be underestimating the valuation of the market. It is not a big difference, but my OCD was itching because of this since early summer. ????
How are you estimating the future 10 year return on the S&P 500?
Look here: https://alephblog.com/2016/04/16/estimating-future-stock-returns-follow-up/
David;
Even after reading your blog for a few years, I still don’t understand how you arrive at an estimate of 2.92% as the S&P’s return for the next 10 years. I don’t disagree with your estimate, I only want to understand the inputs you use to arrive at that estimate.
Thank you,
David
Look here: https://alephblog.com/2016/04/16/estimating-future-stock-returns-follow-up/
Thank you, David
David,
I was discussing with another person, used to manage money and is quite wealthy, and his estimate for stock returns were very similar to your estimate.
What is your view on housing prices?
That’s an interesting question, Richard. Off the top, I don’t know, because I don’t have a model for it. Back prior to the financial crisis in 2008-9, I was focused on that issue, but spent most most of my time on the qualitative aspects of the problem — types of lending going on, appraisals, the seemingly unending bid for mortgage debt through CDO structures, and more. The qualitative data then called for a crackup, but we don’t have that going on now, aside from one thing… new borrowers are making lower down payments than the long term norm. That could be worth watching. Hope you are doing well.