Image Credit: Aleph Blog || Running on empty, running dry… what will happen when obligations can’t be met?
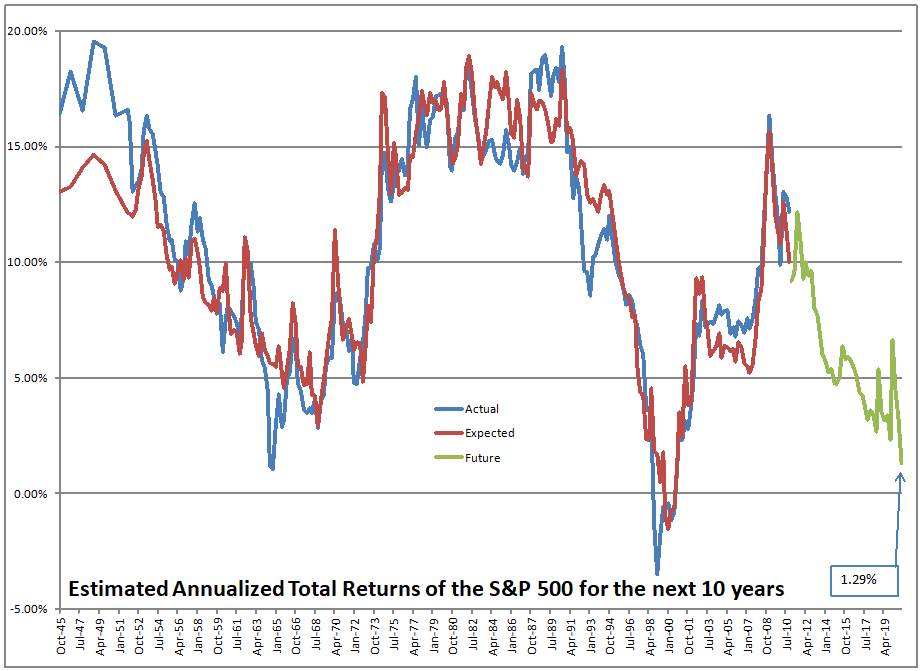
Welcome to Blunderland, boys and girls. At the end of the fourth quarter, the S&P 500 was priced to return 1.29%/yr for the next ten years, with no adjustment for inflation. You might say, “But David, you’ve reported levels that low in the past, and you were concerned, but you never said ‘Blunderland.’”
True, but the market has rallied further since the end of the quarter, and the level of the S&P 500 now is priced to return 0.54%/yr for the next ten years, with no adjustment for inflation. That’s in the 98th percentile of valuations. Another reason I didn’t say ‘Blunderland’ in the past was that we did not have a situation before where the only values comparable came from core of the the dot-com bubble. Thus, welcome to Blunderland.
Now, the valuation levels of the Blunderland era lasted for 2 years and 3 months, from the beginning of the fourth quarter of 1998 to the end of the fourth quarter of 2000. It was a period where monetary policy was extremely loose, before tightening enough to send the market into a tailspin, even as many claimed that interest rates have no effect on growth stocks.
Okay, I’m done imitating my last article on the topic. We are in the midst of a full-fledged mania. What is different no versus the dot-com bubble was that value only took off as the market began to implode. At present, value is outperforming even as valuations are at nosebleed levels. And for any who care, you would be better off buying a 10-year Treasury Note than buying the S&P 500 at present. There is an alternative… to lose less in purchasing power terms.
Of course, you could do what I did in mid-2000, and what I am doing now… own a bunch of cheap stocks that have been neglected over the last ten years, and hold them through the coming disaster. Many of them are cyclicals so they like inflation. Others are life insurers — they want long term interest rates to rise.
But will that be the path? Who can tell? And even with that path, I had gains in 2000 and 2001, and bruising losses in 2002, before rocketing out of it in 2003.
It will be different this time. It is always different. That said, valuations are very high. If you are wealthy and can pay on credit default swaps, no is the time to do it. If you are at the low end of the 1% like me, it is time to own more bonds and safer equities.
Yes, there are other possibilities. You could:
- Short SPY
- Buy puts on SPY
- Buy puts on HYG and JNK
- Short QQQ
- Buy puts on QQQ
You get the idea. If I were to do any of the above I would buy puts on HYG and JNK. I’m not doing that at present. This is the poor man’s way of paying on credit default swaps.

Yes, this is one of those rare times where you will lose is you own the broad market indexes like the S&P 500. note that the above is prices only, and does not include dividends. I think anyone invested in the S&P 500 will earn a tiny amount over the next ten years, and less than the ten-year Treasury Note or the CPI.
I can make this “advice” which is not investment advice in the technical sense simple: sell growth stocks and move to value. Sell stocks generally, and move to bonds.
Now I am not doing that. I am sticking with my cheap stocks with strong balance sheets, in industries that have lagged. And i have roughly 30% of my portfolio in investment grade bonds.
This is a good position to be in amid a mania. Maybe you should imitate me, lest you find that accidentally you became a financial maniac.


What about investing in preferred stocks of companies with solid balance sheets and just collecting the dividend? Could capture an easy 5 to 8% yield.
Are there Vanguard mutual funds or ETFs that you think broadly pass the “cheap stocks with strong balance sheets, in industries that have lagged” test? I think financials broadly will do well so own their financials ETF (VFH), and am thinking of buying their large cap value ETF as well (VTV) – with the thinking that large caps on the whole have stronger balance sheets (though understand that is not true of every large cap company).
My plan is to look at what worked during the year 2000 – 2010 when we had similar metrics. There were some mutual funds that performed very well such as Permanent Portfolio (PRPFX) and First Eagle Global (SGIIX). One thing they had in common was a significant allocation to precious metals and short-term bonds. Another approach would be to use a good long-short fund – RiverPark (RLSIX) and Alger Dynamic Opportunities (ADOZX) – to limit down side.
I’m curious how your model works to claim that SPY is priced to grow 0.54% per year for the next 10 years. You may be going off the historical ~7% average annualized returns, but everyone knows past performance is no indicator of future performance. A few things… 1) yes, valuations in SPY are high. But you have to remember that SPY is market cap weighted, so somewhere around a quarter of the total balance is concentrated in high growth tech stocks (FAANG, etc). 2) getting into high growth tech stocks, yes valuations are through the roof. But so are the year over year revenue and EPS growth of these companies. This is a distinct difference from the dot com bubble. And this gets me into 3) the information revolution is the single greatest industrial/technological revolution since possibly the railroad, or steel, or the assembly line. In the history of SPY (at least since the 1900s when we had exchanges and a central bank) we have not had a truly transformative industrial revolution. We are still in the early phases of history here. And finally 4) 2020 was the swiftest recovery from a bear market in history. Year over year GDP growth went from negative 2% to a projected +6% in 2021. Stocks went from lows of -30% to record highs. This is clearly due to swift and competent action from the fed (injecting liquidity into the markets, keeping interest rates low, quantitative easing) and the government (leveraging historically cheap debt to deliver fiscal stimulus rapidly). I truly believe it was lessons learned from the past – in the Great Depression, in the subprime crisis, and others – that kept this from being a major covid-induced market meltdown and recession. We now have over a century of fiscal, monetary and regulatory experience to keep markets operating smoothly. In summary, past returns do not take away from the fact that there is plenty, plenty, plenty of reason to be optimistic about the next 10 years.
What do you think about the broad foreign indices generally? Valuations seem much more reasonable but maybe they just get dragged along for the ride with US overvaluations?
It’s hard to say. Valuations are more reasonable, but economic growth is weaker in most cases. I think it would be safer to hold an EAFE-based portfolio than a US-based portfolio. That said, my portfolios are 25% foreign — I have better data on US-based companies, and I am not holding the index.
I plotted up the same data regressed with different projections (4/6/8/10/12/14 years) at the Bogleheads forum under entry https://www.bogleheads.org/forum/viewtopic.php?p=5726875#p5726875. It may be a little more convincing for folks when presented in the form of the regression.
Interestingly, there are some hints that the worst might be expected to be around 6 years out and with recovery starting to ramp up after 10 years.
Let me give you a little bit of advice. Try running the model on the returns of single years 1, 2, 3, 4, 5, 6…. 15 separately. You are effectively doing this with you modeling, but this will lay bare what is going on. It will likely give you big effects in year 1, with a lot of noise. Effects will decrease out to year 10, and become statistically null. Noise decreases out to maybe year 4-8, and then increases again.
I haven’t published on this because I think the model is best at making 10-year predictions, trying to put a finer point on it is risky because the model does not predict as well over shorter horizons, and results are basically random after year ten. (Note: doing multiple time period regressions creates a type of “specification search,” as you end up polling the data set multiple times, lowering the credibility of the work.)
When the market is this overvalued, we are just waiting for something to break, and then people will get scared and run. Maybe Powell will utter the equivalent of Bernanke’s “taper” and that will kick it off. Or growth will disappoint.
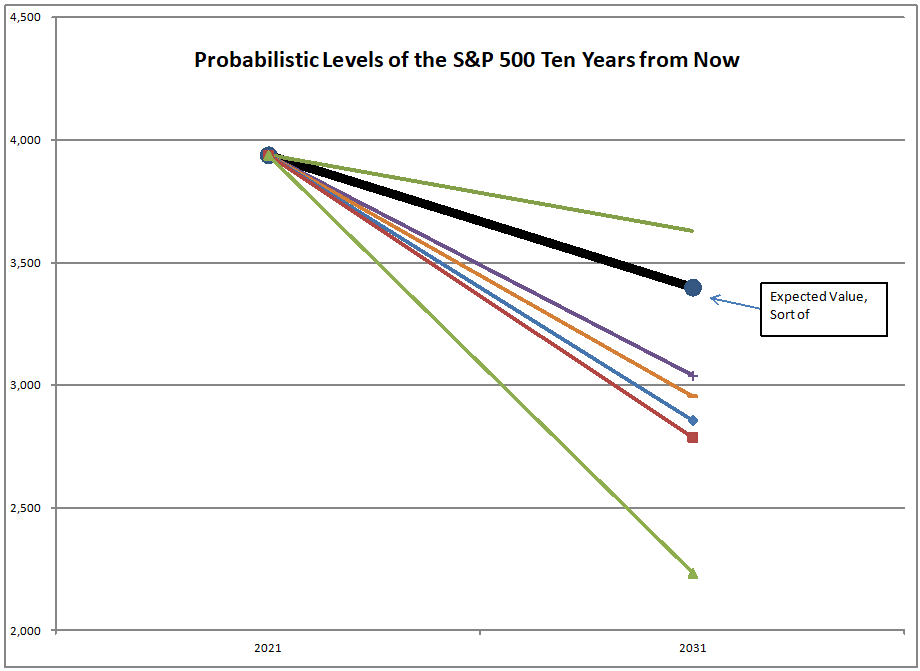
What I am saying is that this model will not give you a path of forward returns… maybe we could create a forward probability map of the path for the S&P 500…. As a long-term investor, I’m just happy to know the way things are tilted for the next ten years.
PS — I have also tried the model adding in a one-year price momentum measure. The momentum did not improve the model. I have considered throwing in the 10-year Treasury yield, or the Moody’s long-term Baa yields, but I haven’t done it. Barry Bannister of Stifel (who is local to me) has done that and other things… I grew up learning econometrics. THe more you play with a model, the more spurious correlations come in, as luck gets interpreted as signal. Best not to play with the data to much.
David I do not understand how holding puts on JNK/HYG provide protection against lofty equity valuations? Is it as simple as equity declines result in a flight to quality on the fixed income side?
High yield spreads are highly correlated with equity returns, especially in a bear market. Some hedge funds even delta-hedge junk vs common stock. The two are closely related, but the premiums you have to pay for the puts on Junk are a lot lower than buying S&P 500 puts. The big guys use a similar strategy and pay on credit default swaps — a few of them did very well during the February-March 2020 bear market — but they had to get the timing right.