Image credit: All images belong to Aleph Blog
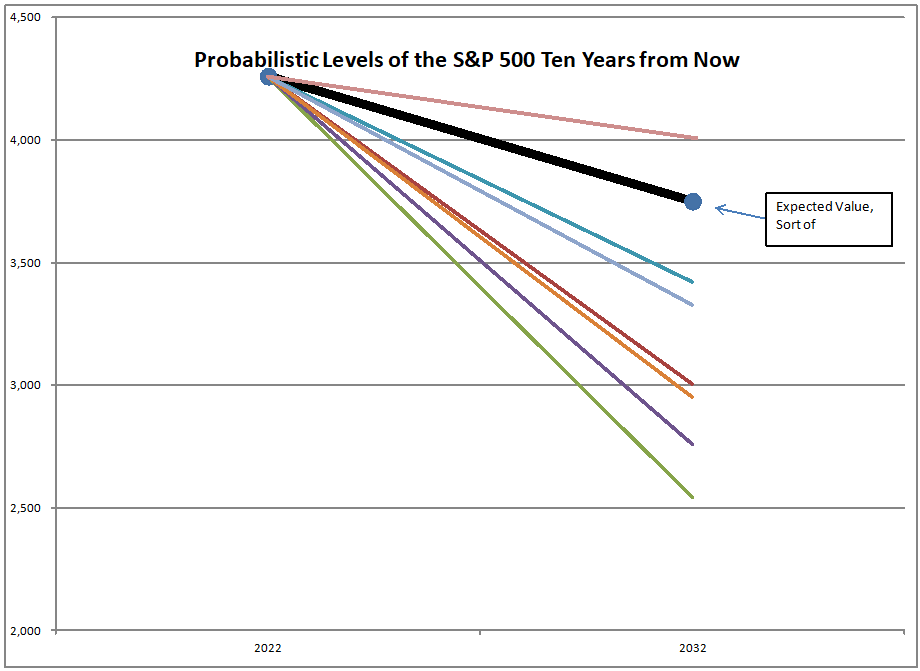
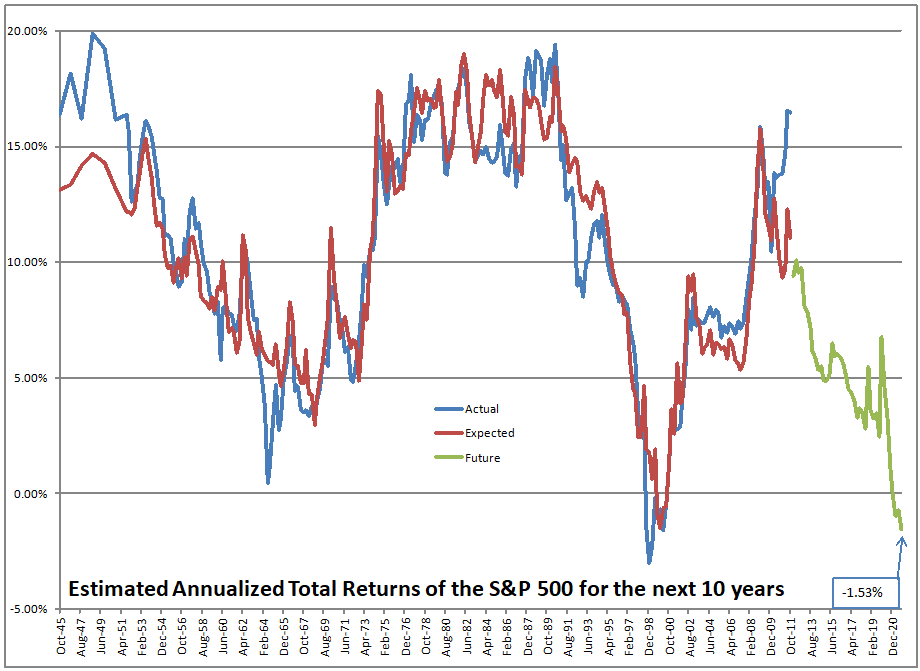
This should be a brief post. At the end of 2021, the S&P 500 was poised to nominally return -1.53%/year over the next 10 years. As of the close yesterday, that figure was 0.73%/year.
The only period compares with this valuation-wise is the dot-com bubble. We are near dot-com level valuations, in the 98th percentile. And if you view the 10-year returns from the worst time of the dot-com bubble to now, you can see that the results they obtained are worse than what I forecast here.

Of course, a lot of what will happen in nominal terms will rely on the actions of the Fed. Will the Fed:
- Allow a real recession to clear away dud assets that are on life support from low rates? (Collapsing the current stock/junk bubble.. they would never do this unless their hands were tied.)
- Risk the 1994 scenario where the compressed coupon stack in the Residential Mortgage Backed Securities [RMBS] market begins a self-reinforcing interest rate rise cycle on the long end as mortgage rates rise, prepayments drop, mortgage durations extend, leading to bond managers selling RMBS and long bonds with abandon to bring their duration risk down. The Fed chases the yield curve up, and the stock and housing markets both fall. The Fed chokes on their policy, and gives up tightening to save both markets.
- Or, if not the 1994 scenario, does the Fed dare to stop tightening before the yield curve inverts, and just wait for a flat curve to do its work? (Nah, that would be smart. The Fed always inverts the curve to prove their manliness, and blows some part of the market up in the process.)
- Or do they just accept financial repression, and punish savers to benefit wage earners (Will it really work? Dubious.), as the Fed keeps their policy rate low.
I posed those scenarios to Tom Barkin, President of the Richmond Fed when he came to speak to the CFA Institute at Baltimore last week. He gave answers that were either evasive, or he didn’t get it.
Anyway, this is an awkward market situation, but the one thing that is clear to me is that investors should be at the lower end of risk for their asset allocation.
PS — As for me, I am living with value stocks, small stocks, and international stocks. Very little in the S&P 500 here.


Does the 10-year forecast return include dividends? i.e. are you talking total return or price return?
Since the forecast chart shows the index level, it appears this is not capturing total return. But maybe it is?
Anyhow, dividends will be a much more important component in the next 10 yrs than the previous 10, imho.
Yes, it includes dividends at a hypothetical 2% rate. That’s why the price return charts look bad relative to the total return charts.