The Graphs Go Southeast

Since the FOMC started providing their estimates on economic aggregates four years ago, I’ve been simplifying them, and posted a weighted average to cut through the clutter of their releases. ?From the above graph, you can see one thing that is consistent: ?They overestimate GDP. ?Far from seeing GDP over 3%, GDP has come in squarely in the 2% range.
It may even be that this is slowly wearing on the participants, who have progressively lowered their initial estimates of future GDP over time. ?You can see that in the initial estimates of GDP 2014-2018, and also the decline in long-term GDP moving from 2.5% to 2.0% in four short years.
The FOMC is no different than the rest of us — they are subject to groupthink and playing catch-up.

You can give them a little more credit on unemployment. ?At least things are going the way they would like. ?That said, improvement in the unemployment rate has exceeded their estimates, while GDP has fallen under their estimates.
They live in a bubble, so please don’t tell them that labor measures don’t correlate so tightly with the economy as a whole. ?I mean, in the long run, the correlation is high and significant, but as far as short-term policy goes, the relationship has a lot of noise, particularly amid globalization and improvements in technology.

Same applies to the PCE inflation rate… they think they can get inflation going (whether truly desirable or not). ?So where is it? ?Federal Reserve, you say you have the vaunted powers to create and destroy inflation. ?If you can do something, do it.
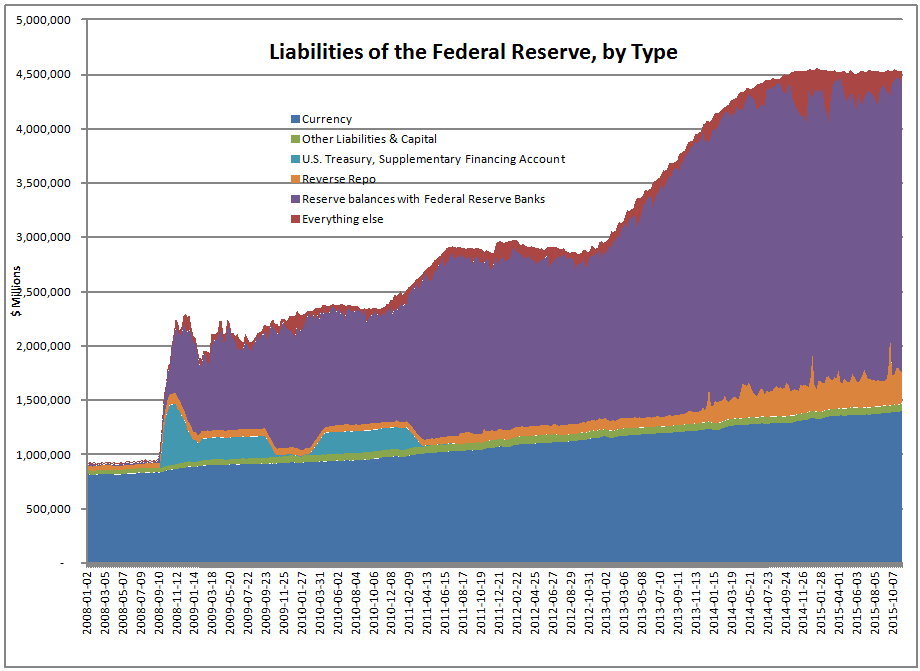
My guess is that the Fed?won’t do it. ?As with most central banks, they have engaged in a game where they increase some aspects of internal credit, and in a way where precious little if any leaks out to the unfavored wretches with no access.
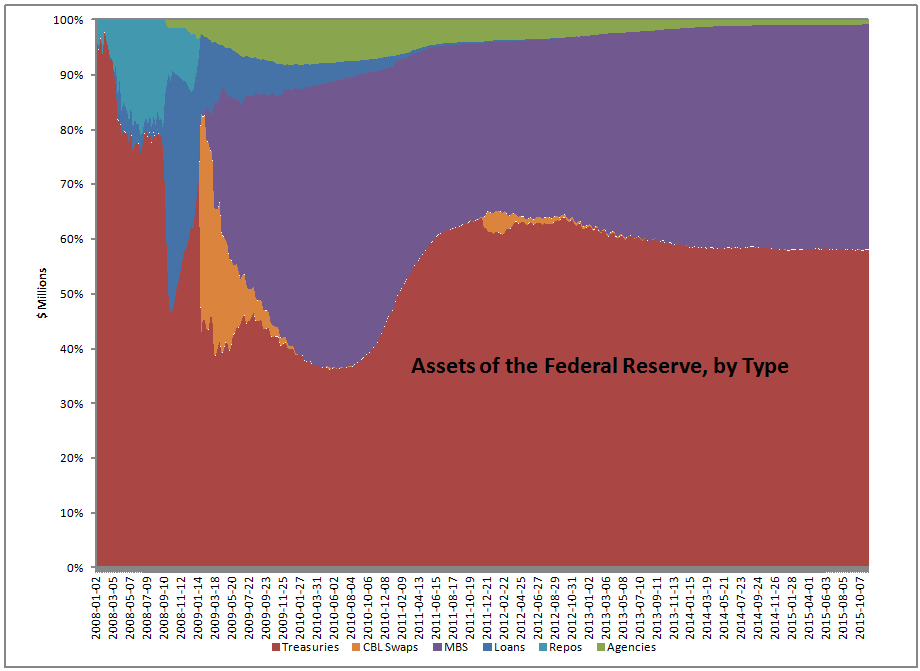
On the short-term bright side, they absorb government debt, which makes it easier for the US Government to keep our taxes low. ?On the dim side, central banks buying lots of government debt has tended to backfire in the past.

Finally, the FOMC participants have overestimated for the last four years the need and willingness to tighten monetary policy.
Can we agree that QE really didn’t do that much, and that the unemployment rate pretty much solved itself, aside from losing a lot workers permanently? ?These graphs behave the way a bunch of “true believers” would think their great power should ?work, and them slowly give in to reality annually, but not permanently.
Anyway, consider these articles post-Fed tightening:
Fed Ends Zero-Rate Era; Signals 4 Quarter-Point Increases in 2016 Bloomberg)
This article is too excited, the math of the FOMC indicates more like 3 quarter-point moves. ?Also note that the FOMC is not very permanent about their views, plans, or whatever.
The Fed and Wall Street Differ on How High Rates Will Go (Bloomberg)
Wall Street, correctly looking at the past says that the Fed has moved slower than they said they would. ?Why should it be any different now?
Fed Raised Rates Without a Hitch, and It Only Took $105 Billion (Bloomberg)
Too triumphalist about the first tightening. ?Wait for the cost of funds to catch up at the banks.
Fed Hikes, but Some Rates Veer Lower (WSJ) Subtitle:?Yields on Treasurys drop after central-bank move
That’s part of what I would tell you to watch — if the yield curve flattens quickly, the FOMC will not do so much, most likely. ?They will still keep going till something blows up.
One final note, and one that I don’t have a link for… Moody’s suggested in a macroeconomic note that yield spreads on junk debt are too high for the FOMC to tighten much. ?Nice thought, though we are in an unusual situation for both Fed funds and junk debt. ?That rule may?not apply.


