Category: Quantitative Methods

An Actuarial Question

An Actuarial Question

Here is a question from a reader:

Hi Mr. Merkel,

?My name is XXXXXXX and I rcently started my ASA modules. I am considering pursuing a Chartered Enterprise Risk Analyst designation from the SOA. I was curious if, based on your experience in both the financial and actuarial world, you had any thoughts on the CERA designation? I have

2.5 years of experience and work for a pension consulting firm, but would like to broaden my skill set. I really enjoy The Aleph Blog, especially the book reviews. Keep up the good work.

?Thanks,

?XXXX

My response:

Dear XXXX,

I don’t have an opinion on the CERA designation.? In my opinion, the SOA is in the midst of an existential crisis.? How do they survive, prosper, and maybe even grow the SOA?? Outside of their core industries, insurance and employee benefits, they have strong competition.? Many organizations that do something like them are larger than the SOA.

Ideas:

1) Put a gun to the head of the CAS by offering a casualty track.

2) CERA competing against other risk management credentials

3) Make an effort to create new “actuarial” tracks off of the experiences of nontraditional actuaries, most of whom are a lot more entrepreneurial than other actuaries.? Investing, big data, etc.? Look for all the things that involve the intersection of the Law of large numbers and durational discount…

4) Try to cooperate with the CFA Institute — how that will work, I have no idea, and I am reminded of the limerick about the young lady from Niger.

http://allpoetry.com/poem/8518887-Limerick_There_was_a_Young_Lady_of_Niger-by-William_Cosmo_Monkhouse

5) Attempt to merge all actuarial organizations in the US & Canada into one organization — try to go global, like the CFA Institute.? (The rewards of being global are far smaller than imagined.)

Think hard about what you want to do, and analyze which credential will get you there.? Then pursue it with all your strength, and pick up adjacent/tangential skills to differentiate yourself.? That last part is important, and it is what has made my career very different than most actuaries.

It’s kind of like violating the semi-strong form efficient markets hypothesis — in order to do better than the market, you need an edge.? Find that edge, because regardless of what credential you get, you will need to know more than that to excel.

Best wishes,

David

And his response:

Hi David,

Thank you very much for the thoughtful response. I had not considered the size of the SOA in relation to other competing organizations. As you said, I will have to do some hard thinking about what I want to do and pursue the my designations accordingly.

Thanks again,

XXXX

Thee is an article waiting to be written about credentialing in investments, and how the credentials are not worth much.? It is a lot harder to get an FSA from the Society of Actuaries than it is to get a CFA credential from the CFA Institute.? But the CFA offers a lot more with respect to investing than an FSA does.

Now, those are two strong credentials that are worthy of trust.? There are many more credentials out there, and most are not worthy of trust.? Be careful.? Many put initials after their names, and they aren’t worth a lot.? Be careful.

Dealing in Fractions of Sense

Dealing in Fractions of Sense

So the SEC wants to take on some of the market distortions caused by decimal (and sub-decimal) pricing.? Well, there are the things that can’t be argued about and the things that can.

Starting with what can’t be argued about: liquidity is not a free good.? In a trading market, it exists because market makers or specialists are willing to offer markets of a certain size and bid-ask spread given the usual price volatility.? Most of the time they? will make money, because there is enough informationless volume trading back and forth, that they can take a few losses when information hits the market, and informed traders temporarily make money against intermediaries until a new equilibrium is reached.

The same is true when things become more uncertain — either bid-ask spreads get wider, or sizes get smaller, or both.? I remember back in 2002 as a corporate bond manager/trader — bonds were trading in “onesies” and “twosies,” though bid-ask yield spreads hadn’t widened much.? (I.e. $1-2 million of face amount would trade at a given bid-ask context… if they got too much interest in one side or the other, the bid-ask spread would move, and fast.

So when the SEC made its move to change the tick size (minimum bid-ask difference) from fractions of dollars — eighths & sixteenths, to pennies, there was a tendency for the amount offered by intermediaries to decline.

Now if you are a small trader, you don’t care that much about this.? You were able to get your work done, and at thinner bid-ask spreads.? Life is good.

But if you are a large manager of assets, it’s not so easy.? You have a big buy or sell that you have to do, and the market gate is thin.? Give away too much of the size you want to do, and the market runs away from you, costing you money.? You might actually like markets with bigger offerings and wider spreads better.

And so you seek other trading venues out away from the NYSE and NASDAQ, and occasionally you find you can get large trades done there when there is another large trader willing to take the opposite side of your trade.

And in the process the other trading venues sometimes create fleeting trading opportunities between them and NYSE or NASDAQ, or within them.? That’s high-frequency trading [HFT].? Now, NYSE and NASDAQ profit from this because they sometimes receive payment for order flow.? They seek orders, and are willing to pay a tiny amount to get them, knowing they can make a profit on the other side of the transaction.

Given all of the above, the SEC is now reviewing a proposal to change back to fractions.? My first reaction is this favors the big over the small.? My second reaction is why not regulate/legislate and create one central order book that all orders go through for each security, and publicly display the bids and asks.

My third reaction is why not end payment for order flow.? High frequency trading would end without easy access to the deepest markets.

My penultimate reaction is, why not restructure markets so they transact once a second, or once a minute. It would not impede markets much at all in my opinion.

But my last reaction is, why not charge a teensy fee for every order placed in any venue, whether it executes or not?? It might be as small as a penny on a thousand dollar order.? Or even a penny on a ten-thousand dollar order.? Just enough that there is a disincentive to place a lot of orders where there is little intention of having them fulfilled except at advantage to the order placer.

These are better ideas than moving back to eighths and sixteenths once again — leave that alone, the existing market structure favors small traders, and that is not all bad.? Many large traders disguise themselves as small traders, and get trades done more cheaply than if they were trading in fractions.

Every trading system has its weaknesses — the challenge is to create the system that is the best for the most.? In that case, a good system will:

  • Have a central order book, or,
  • End payment for order flow, or,
  • Change markets to an auction format, or,
  • Add a fee that eliminates most non-completed high-frequency trades.

Personally, I like simplicity.? One central order book and no alternative venues, but allowing for a wide amount of order types that accommodate large orders and small orders.

So don’t go back to fractions.? They weren’t the solution to the current problem.? Better to restrict the market structure so that placing an order costs something.? Being able to place an order is a good, so there should be some cost, whether it executes or not.

What I propose here is more minimalist than other proposals, and would solve most problems from high frequency trading.? Add a small fee to each order — what could be easier?

On the Virtue of Hard Questions for Young Analysts

On the Virtue of Hard Questions for Young Analysts

Yesterday I represented the Baltimore CFA Society at the kickoff meeting for the 2013 CFA Institute Research Challenge.? As is the norm, the Washington, DC CFA Society (which is 2.5x larger than us) and Baltimore choose a local company for the students to analyze.? Last year, it was Under Armour [UA].? This year, it is Marriott [MAR].

One quick aside.? Last year, the more bearish you were on Under Armour, the better a team scored.? But guess what?? Under Armour rose 15% in the last 7+ months — the team that finished last had the result that was the best, and the winner did the worst.? I know many of my readers don’t like Jim Cramer, but one thing that he said shines through here: “The bear case always sounds more intelligent.”? The same is true in academic competitions.? That’s one reason it is good to have a mix of temperaments in an investment firm.? Personally, I believe that bulls and bears do better together than separately — they need to round each other out.

Personally, I would prefer to analyze a growth stock like Under Armour, to the “asset light” hotelier Marriott.? That said, Marriott’s? Investor Relations team was out in force for the six (maybe seven) colleges who showed up, and gave what I thought were credible answers to the students who asked them questions.? Near the end of the presentation, the senior Investor Relations person walked them through each line of the income statement — I thought that was a nice touch, but wondered what Marriott used as an internal measure of profitability.

(Note to any students reading me: take a look at what Moody’s, S&P, and Fitch use as their metrics on Marriott.? The rating agencies are not dumb, and they get more data than stock analysts do. They are inside the wall.? They get material nonpublic information, and disclose the portion of it that is relevant to bond investors.? At the presentation, the Marriott IR folks stressed repeatedly that they want to maintain an investment grade credit rating.? That is a large constraint on what Marriott does, and should be considered in any good analysis.)

This will be an interesting competition, and five months from now, it will be fun to be a judge in the local version of the Investment Challenge.

-=-=-=-=-=-=-=-=-=-

Two weeks ago, I was a judge in a competition among finance students for four colleges that met a McDaniel College.? I was the only judge that did not graduate from McDaniel, which was formerly Western Maryland College, named after the Western Maryland Railroad which funded the school in its early years.

The question at hand was whether the Texas Rangers should have acquired A-Rod in 2000.? This is a tough question, because it is a binary decision, and it faces the winner’s curse.? So, you hired A-Rod.? How badly did you overpay to get him?

I don’t think I am overstating the problem.? Anytime there are multiple bidders for a unique asset, the winning buyer tends to overpay.

The case study (from Harvard) had its own issues.? It overestimated how fast average player salaries would grow, and the econometrics behind the estimation of wins as a function of player salaries was decidedly poor.? More than the Harvard Business School case study would admit, it was a lousy decision to hire A-Rod.? Add in the social effect on other players when A-Rod is paid a huge amount relative to them, and even if he is a nice guy, you wonder if you are truly valuable to the franchise.

But when you are a judge in such a competition, your mind works this way: the first team sets the tone, and has an advantage until a team eclipses them.? Then that team sets the tone.

The judges were pretty neutral on whether A-Rod should be hired or not.? The vote depended more on the process they undertook.? How much research did they do?? How do they back up their assertions?? Did they believe the data in the case study blindly?

–==-=–==-=-=-=-=-=-=–==-=-=-=-

Face it, the business world is unclear/dirty, and those that analyze it have to take account of what they don’t know, and make the best decision that they can.? This is the virtue of hard questions for young security analysts, and why we hold such competitions.

Toss them a hard problem.? Make them think outside the box.? Life is tough, and investment decisions are often unclear.? This is life.

Investment competitions are a far better way to train students than the raw academics.? Modern Portfolio Theory is garbage.? Most academic approaches to investing don’t work.? But try to understand a business like Marriott.? They make money off of selling their name.? They make money managing hotels.? How can they be sure to make money as they do so?? Those are the tough questions to analyze.

It’s a good thing to make young analysts face a hard question.? Whether they win or lose, they had to work hard, plan, compromise with team members, and come to a decision that would face criticism.? When we invest money, we don’t get criticism vocally, but we do see the gains and losses.? Thus the investment competitions are a very good way to prepare students for the eventual gains and losses they will face when they are making business decisions on their own.


The Rules, Part XXXIV

The Rules, Part XXXIV

“Once something is used for hedging purposes, it becomes useless for predictive purposes.”

I know this is kind of a trivial insight now, but when I originally wrote it, it was more cutting-edge.? That said, it is still not fundamentally understood by most.? Most still look at a fragment of the puzzle.? Few look at the whole.

My poster-child for fragmentary thinking is this article: The end of stock market crashes? Do I disagree that correlations begin rising among risky assets toward the end of a bull market?? Not at all.? I have even written about it on occasion.

But if few understand this, then only a few will take shelter when correlations get high.? The rest will continue the disorderly party until the “market cops” show up in the bear market.

If it becomes a widespread idea, a market rule, etc., it may constrain behavior for some time, leading to no large crashes, but after a long while with no crashes some will assume that such crashes are not possible, and the rule is out-of-date.? Four? examples:

  • Stocks should yield more than Treasury bonds.
  • Stocks should yield more than 3%.
  • Q-ratio
  • CAPE10

Many items that have intermediate-term wisdom, and are known to have that wisdom, eventually get ignored.? The first two I listed were common market nostrums in their day.? The second seem to have more long-term validity, but get ignored by many who say, “It’s different this time!”

But even if everyone agrees that a certain risk measure is a correct risk measure, and it becomes a part of the market’s furniture, that doesn’t mean risk ceases.? It does mean risk takes a different form.? I think of all of the people decided not to take equity risk during 2000-2007, and decided to invest in residential real estate, or take risk through CDOs, subprime RMBS, etc.

Yes, they avoided risk in the stock market.? They ran into something far more fundamental.? The risk from all risky assets, public, private, leveraged, unleveraged, is everywhere, and it is very difficult to hide while taking risk.

The markets incorporate a lot of rules that have partial validity.? They are known variably, and apply variably.? At some points these rules seem sharp and prescient.? At other times they seem weak and outmoded.

This brings me back to my view that the market is an ecosystem where no strategy has permanent validity.? Strategies ebb and flow as many parties search for scarce returns.? There are well-known limits to markets, like the Q-ratio and CAPE10.? If the markets come up with another one, like risky asset correlations, it will have validity, restraining speculative behavior, until people overwhelm it, and a new bust happens.

The boom-bust cycle cannot be repealed.? But it takes many forms.


On PB-ROE

On PB-ROE

Here is an e-mail from a reader:

I’m curious about the intercept of the PB-ROE line. In your examples (http://alephblog.com/2012/02/25/thinking-about-the-insurance-industry/), only life had a negative intercept; the others were all positive. Here’s the implication:

?PB = a + b ROE (where a and b are the intercept and slope).

If I divide both sides by ROE I get:

PE = a / ROE + b

Taking the differential:

dPE = – (a / ROE^2) dROE

So if the intercept is positive, an increase in ROE results in a lower PE and vice versa.

So here are two questions:

1) Why would the relationship be negative? Is it because the higher ROE is achieved via leverage, is therefore riskier, and requires a lower PE??

2) Why is the intercept negative for life insurers but positive for the others?

First, you have to understand PB-ROE.? The idea is that there is a limiting factor to earnings with financial companies.? The earnings of financial companies is limited by its book capital.? I think this is correct to a first approximation.? But different financial companies experience different financial results; they have different ROEs.? How sustainable are those different ROEs?? ROEs tend to revert to mean; competition drives that.? How fast ROEs revert to mean derives from the length of the businsess written.? Long tail exposures found in life companies mean that a higher ROE usually gives more kick to the P/B multiple.

As an aside, with industrials and utilities =, I often think that sales are the limiting factor, and so my equation becomes:

P/S = a + b * E /S + e? (E/S = profit margin)

Now to your math.? You have the first equation wrong, it should be:

PB = a + b * ROE + e , where e is a normally distributed error term, so if you did the division by ROE, it would be:

PE = a / ROE + b + e / ROE, which means my error term could no longer be normally distributed.? So, you can’t divide through by ROE.? Not legitimate.

Let’s try a different approach.? What if we modeled P/E as a function of B/E?

First, to me that doesn’t make sense, because the idea of capital as a limiting resource goes out the window.

Second, if you did that the a and b would be different, because regression minimizes the squared differences of the dependent variable (actual versus expected).

So, with respect to what I said above, I would not do the math your way. Dividing and differentiating by ROE neglects the meaning of the original equation.? All models are just that, models.? But we can’t go neglecting what they internally assume, and expect to get good results.

So, I can answer your second question, but not your first question.? When we estimate PB-ROE, often the equations with the highest slopes have the lowest intercepts.? What that describes are situations where the ROEs, if they are high, are expected to remain high, and thus produce much higher P/Bs.? Such would be true with long duration coverages like in the life industry.

The reason the life industry is different is that the companies with high ROEs are expected to maintain those high ROEs for a longer period of time, because coverages are long, and pricing adjusts slowly.? With other insurance coverages, pricing adjusts annually or nearly so.

For a short-tail P&C company with an ROE of zero, I would expect a P/B multiple that is positive, because pricing adjustments and mean-reversion are coming soon.? For a life company with a low ROE, the adjustment will happen slowly, or it may never happen.? Perverse dynamics kick in when a company with long-tail coverages finds itself earning very little to nothing.? There is the tendency to mis-estimate reserves, “because we can’t be making so little.”? The length of accruals allows a greater degree of subjectivity to be injected into the estimates.? Short accruals get validated every year.? Long accruals don’t get that validation, at least not in a way that a public investor can see.

If you were an actuary inside the long-tailed life insurer, you would get some data telling you that your assumptions were optimistic, right, or pessimistic.? But it takes a while to figure out whether the last few years are a deviation or a trend.? Good actuaries dig in, and look at the causes for claims, trying to see if the reasons for policyholders making claims matches up with the original estimate of what the subject population would be likely to die (or have disability or LTC claims) from.? Too many abnormal claims may imply that the business has been underwritten wrong, and needs to be adjusted.

That analysis takes some doing, because long-tail life coverages are low-frequency and high-severity.? That’s why the qualitative data may help, by giving clues long ahead of the flood of claims that you did not expect.

To summarize: Life is different because the coverages are long duration in nature, and ROEs don’t change so rapidly.


Total Return Versus Long Liabilities

Total Return Versus Long Liabilities

Very briefly in my career, I was Chief Investment Officer of a significant life insurer.? Sadly, that was my dream job, and to have it and lose it was a blow that I accepted, because I did what was right.

At my first meeting with the new CEO, he expressed that investment returns had been inadequate.? I explained to him that that was false — the investment department, inclusive of defaults had provided returns 0.7% better than single-A bond returns, which was notable for the industry.? He insisted that was not good enough, and that he wanted to see us trade aggressively, and produce total returns.? I tried to explain to him that that was the wrong way to manage investments for a life insurer.? The right way was occasional trading for loss mitigation, and maximization of investment spreads over the term of the liabilities.? Being the sort of Brit that disdained Americans, he told me that I didn’t know anything, and that total return was the only way to go.

For the good of the relationship between our two firms, I let it drop, but he held a grudge against me after that, which led my firm to change my position to corporate bond manager, letting another of our group be the CIO, who solicited my feedback to a high degree, because he knew that I knew what was going on, far better than the CEO did.? This is just my guess, but I think the CEO resented that I could see through him and the way he and Chief Actuary manipulated accounting results.? (I eventually spilled the beans to the regulators.? The state in question was kind of lazy — I really think they didn’t do anything with it.)

Leaving behind the past, here’s the theoretical problem: total return is a wonderful idea, but vapid, because the challenge is gaining total returns over a time horizon, after which the assets will be used to fund a liability.? In a life insurer, yes, you could manage the bonds to maximize total return in the short run, which might maximize short-run GAAP income, but might destroy long-term economic value because as high quality interest rates fall, it becomes harder to meet the longer-term promises previously made using new money interest rates.? Yes, you can realize the capital gains today, but only at the cost of reducing future net income, until net income goes negative, and recoverability testing indicates you are locking in a loss, and you have to do a writedown of your deferred acquisition cost asset.

This is why I am skeptical of hedge funds and other total return investors buying life insurers.? Good investing at a life insurer means improving the investment income spread between assets and liabilities, over the term of the liabilities, while taking account of capital use, and avoiding defaults.

It would be very difficult now to be managing a life insurer that had a large deferred annuity block, particularly one with high guarantees.? Your flexibility is strained — if rates go down, you have to still fund the guaranteed rate, and if rates go up you will wish you were invested short so that your credited rates go up, and you don’t lose money because the income off your bonds is rising.

The only normal option in such a situation would be to run a barbell — short assets and long assets, with little inbetween.? Long assets for the guarantees, short assets for the crediting rate sensitivity.? And even that might not be adequate.

I started my career at a small life insurer that grew into a medium-sized one in three short years off of capital raised by its holding company issuing junk bonds.? The holding company, Southmark (spit, spit), knew something about investing, but not about running regulated subsidiaries.? What looks simple is actually very hard.? The cash flows of the assets and the liabilities are not freely available to be used through the consolidated company.? The regulatory limits of each subsidiary are applied separately, limiting what cash flow can be sent to the overly-indebted holding company.

In the end, after interlacing the capital of the subsidiaries, such that our insurer held a lot of the equity and preferred equity of other insurers, the holding company declared bankruptcy (a two-time loser there), and the life insurer went into conservation with the California Department of Insurance.

I was just a junior actuary then, and my investment knowledge was small but growing, so I didn’t get much of it then. The company took too much credit risk with junk bonds (the regulations were loose then), and mismatched their investments short (can’t buy long junk) versus long liabilities.? As rates fell, fell and fell, junk bonds defaulted or were called.? Each reduced income, but the guarantees remained the same.

Thus I remain a skeptic of clever investors trying total return strategies versus long term promises.? In the situations I have been in, it has not worked, and with bad management teams, it is another way to make things look good for a time, until things blow up.

Now, as for the two insurers that I mentioned, their management teams didn’t end well.? The first one that I worked with left to start another insurer, while bidding unsuccessfully for the firm they left.? They never went far.

The one I mentioned at the beginning of this piece — the entire management team was let go, except for the CEO, who was forced into retirement, and the CEO of the holding company was forced to resign for wasting money pumping it into the life company.

Good investing stems from matching assets to the eventual need to pay cash at a future date.? True for individuals and institutions.

On Dividends

On Dividends


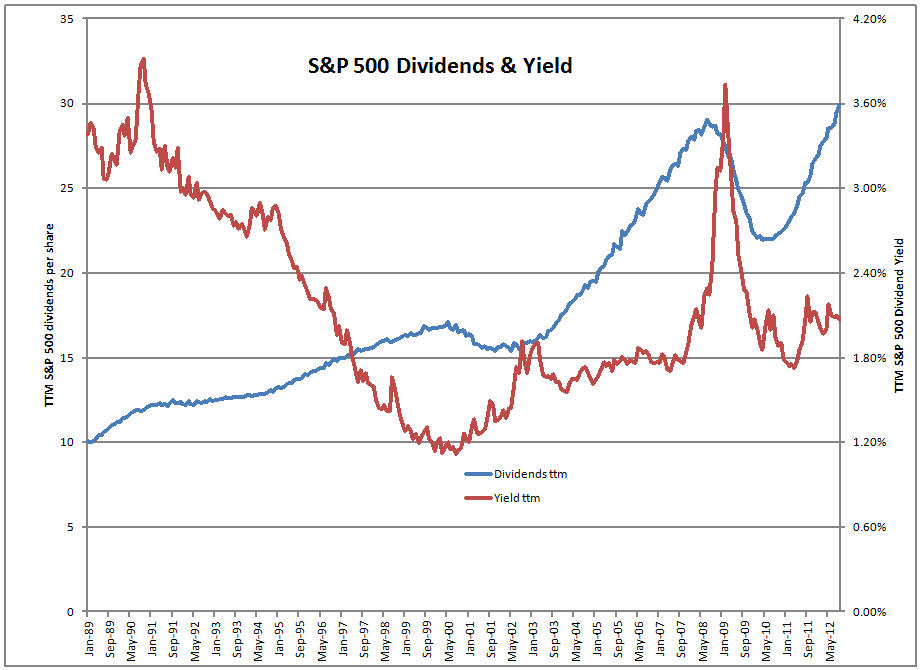
Dividends are kind of a craze now, as people focus on income in an environment where income with reasonable risk is hard to come by.? Now, I used data from S&P to create this graph.? I suppose I could go further back in history and use Schiller’s dataset, but the era of high dividend yields on stocks is over, at least for now.? I can be taught, but I don’t see a lot of present relevance to pre-1990 dividend yields.? The prices of stocks as income vehicles has been bid up, and buybacks absorb much of the free cash flow from mature corporations.

That said looking at 1989 to the present, what do we see?? Dividends rose at a rate of 4.72%/year over the period, and people were willing to capitalize dividends at a rate that grew at a rate of 2.07%/year over the period.? The total return being 9.47%/year over the period leaves 2.42%/year to be the return from the dividends, and capital gains from reinvested dividends.

In one sense, the blue line above gives a fair statement of the crisis we have gone through.? Profits got smashed in 2008-2009, much more than in 2002.? (Note that financials were the core of the recent crisis but were in good shape in 2002.)? In both cases, dividends came back.

In another sense, the blue line is not indicative of the crisis.? Labor force participation has dropped incredibly.? The unemployment rate may be low, but only because many have given up on finding jobs.

My only counsel here is not to seek dividends for their own sake, but accept them if offered in a firm that offers good prospective returns.? I do not look for dividends, but 31 out of my 34 holdings pay dividends, and the average dividend (including non-payers) is 0.7% higher than the S&P 500 dividend yield at 2.75%.

I don’t so much believe that dividends have value, as many companies that pay dividends have value.? Free cash flow is valuable, and results in dividends, buybacks, and reinvestment in the business.? Find those firms that produce free cash flow, and dividends will typically follow.

The Dilemma of Adding Yield, Redux

The Dilemma of Adding Yield, Redux

After my post last night, I was asked how I make corrections in analyzing premium versus discount bonds.? (Note: if a bond trades at a higher price than the final amount of principal to be paid at maturity, it is called a premium bond.? If lower, it is called a discount bond.)? Happily, there is a story attached to it.? Here it is:

In early 2002, most investment banks placed their cash and CDS traders next to each other. It improved the ability of Wall Street to trade against the rest of us significantly.? By the end of 2002, every major investment bank was doing this.? Many were publishing data on CDS premiums.

I had a habit where I would go out for Chinese food once a week — get out of the office, clear my mind, bring stuff that was important to think about.? One week there was a piece about using CDS spreads to correct for premiums and discounts to par.

The idea was this: if a bond trades at a premium to par, pretend you have bought CDS protection on the amount of the premium.? Deduct the cost of that from the coupons you are paid and re-estimate the yield.? When a bond bought at a premium defaults, guess what? You will never get the premium back — thus using CDS to estimate the insurance cost.? You might not seek the default protection, but it would be valuable to know how much it was worth.

Vice-versa for discount bonds: pretend you have sold CDS protection on the amount of the discount.? Add the the premiums you might receive to the coupons you are paid and re-estimate the yield.? When a bond bought at a discount defaults, guess what? You will fare better than those that bought at par or a premium — thus using CDS to estimate the added yield from that benefit.? You might not sell the default protection, but it would be valuable to know how much it was worth.

Then one day I asked on of my dealers where the CDS was trading on a medium-sized company.? After a pause to talk to the trader he came back, there was no CDS trading on that company.

Okay, what to do? Then it struck me.? Use the credit spread (yield difference over a similar length Treasury Note) as the proxy for the CDS premium.? Bing! problem solved, and more relevant because I didn’t use CDS — it gave me a standard to use in many situations where bonds with different levels of premium or discount were being compared.? I could use this for any bond.

Here are two examples for how it would work.? Here is the analysis for a premium bond:

Year

Cash flows

Swap pmts

Adjusted Cash Flow

0

? (1,100.00)

?????????? (0.65)

?????????????? (1,100.65)

1

?????????? 70.00

?????????? (0.65)

?????????????????????? 69.35

2

?????????? 70.00

?????????? (0.65)

?????????????????????? 69.35

3

?????????? 70.00

?????????? (0.65)

?????????????????????? 69.35

4

?????????? 70.00

?????????? (0.65)

?????????????????????? 69.35

5

???? 1,070.00

???????????????? 1,070.00

Premium/(Discount) to immunize —> ???????? 100.00

Yield

Spread over Treasuries

Initial

4.71%

0.71%

Treasury rate

4.00%

Comparison

4.65%

0.65%

Initial Price

???? 1,100.00

Coupon Rate

7.00%

And then what it looks like for a discount bond:

Year

Cash flows

Swap pmts

Adj Cash Flow

0

????? (900.00)

???????????? 0.66

?????????????????? (899.34)

1

?????????? 23.00

???????????? 0.66

?????????????????????? 23.66

2

?????????? 23.00

???????????? 0.66

?????????????????????? 23.66

3

?????????? 23.00

???????????? 0.66

?????????????????????? 23.66

4

?????????? 23.00

???????????? 0.66

?????????????????????? 23.66

5

???? 1,023.00

???????????????? 1,023.00

Premium/(Discount) to immunize —> ????? (100.00)

Yield

Spread over Treasuries

Initial

4.58%

0.58%

Treasury rate

4.00%

Comparison

4.66%

0.66%

Initial Price

??????? 900.00

Coupon Rate

2.30%

So if I had two annual five-year bonds from the same issuer: 10% discount, 2.3% coupon versus 10% premium, 7% coupon, with the equivalent Treasury at a 4% yield, I would be indifferent between the two, even though the yield to maturity on the premium bond is 0.13% higher than that of the discount bond.

If you want to download the simple spreadsheet (be sure to allow for calculations to iterate) you can find it here: Premium-discount adjustment calculator.

That’s all, and for those that try it, I hope you enjoy it.? Wait, one last story:

In late 2002, a broker proposed a relatively complex swap trade.? I suspect he was trying to get an odd bit of paper off of the balance sheet for something more liquid.? As I recall there were premium/discount differences, but also, liquidity, subordination, duration, deal size, and credit rating.? The swap almost looked good, so I decided to “bid him back,” offering the swap at terms more advantageous to my client (and adding in a margin for error — ya wanta rent our balance sheet for illiquidity purposes, ya gotsta pay).

The broker was a little surprised, because the trade looked optically good by most common standards, but as I described to him all of the yield tradeoffs in the swap, he said, “Wow, never hear a trade taken apart like that before. I’ll take it to the trader.? Are you firm at your level? (I.e. will you hold to your terms proposed, or is this just the start of negotiations?)” I assented, and he went to the trader, who agreed to the swap at my terms.? You always have to blink when they do that, because you may have made an error, but my adjustment carved 1% of par off of the swap terms.

I suspect that I got a good trade off, and he needed to get rid of illiquid security that had overstayed its welcome.

In any case, that’s how to do swap trades.? Have fun.? I certainly did.

On Low Volatility Investing

On Low Volatility Investing

Recently a friend of mine sent me an e-mail after my review of Eric Falkenstein’s latest book.? Here it is:

David, I?ve been reading a decent amount of the academic literature on low vol investing and it?s certainly got my attention.? I?ll definitely be purchasing his book to read thru it, but I think he and Mebane Faber have had quite a bit of this stuff on their respective blogs.? Frankly I liked the research enough that I decided to part ways with some gifted Verizon stock that the in-laws gave us and bought a global low-vol ETF (ACWV). ?

http://us.ishares.com/product_info/fund/overview/ACWV.htm

I wish it had a bit more international tilt, but there is a sister international ETF that I can buy, so I might add that at some point to balance out the geographic exposure.? The one thing that really surprised me the most was that I figured this thing would have huge weights in Utes/Telecom.? Not so–actually the industry diversification looks very attractive.? And for 35bps of fees vs nearly 4% yield, hard to go wrong with this product for a nice LT buy and hold.? Kinda funny when I find myself, as a stock guy, actually liking a highly diversified index-type product? I just needed a bit more balance in the portfolio from all my very idiosyncratic idea.

Some of your readers might be interested in some of these ETFs if you think they are worth talking about.

For raw quantitative index investing, funds like these are good ideas, at least for now.? But with all new strategies, I ask the question, what will happen when a lot of people do this?? It is possible for stocks that minimize volatility as a group to become overpriced.

Think about what a minimum volatility portfolio looks like.? The companies pay decent dividends, are mostly not in cyclical industries… the portfolio looks like growth at a reasonable price.? Company financial & operating leverage is relatively low.? When I think of all of these together, it sounds like high free cash flow, and/or high growth of free cash flow.? This would be similar to high-quality growing companies that don’t take on a lot of debt.

A minimum variance portfolio, should the portfolio characteristics continue over the rebalancing horizon, will behave somewhat like a high yielding bond, but noisier.

The fund that my friend mentioned has an above average P/E ratio, an above average dividend yield, and an above average Price-to-Book ratio.? It tends to choose stable, eclectic companies within each economic sector.? For example, when I looked at financials, I saw a disproportionate amount of REITs, Insurers, and obscure Japanese and Asian banks.

This is a little quirky, but the stable elements of a variety of different sectors seem to do well over time as a portfolio.? But just as “value stocks” as a group can become overvalued, the same can happen for the stocks in the minimum volatility portfolio.? It would be good to track the average E/P & B/P (trailing twelve months) for the portfolio.? If the valuation metrics get too high, it could be a sign that low volatility is becoming a crowded trade.

That said, given the dynamism inherent in re-estimating a minimum variance portfolio, it might not be so obvious when low volatility is over-invested.? Maybe watching when the ratio of the Morgan Stanley Cyclicals index versus the S&P 500 might give us a negative clue. It was less attractive to invest in stable stocks in August of 2000 and February 2009.? These are two very different dates.? The former showed stable stocks peaking, while the latter was cyclical stocks troughing.

My own investing methods rely on no one factor, but looks at what makes a stock valuable through multiple lenses.? But tonight I highlight low volatility, because I think that investors do occasionally overpay for quality, but in general a quality bias pays off over time, as does a value bias.

We Eat Dollar Weighted Returns ? V

We Eat Dollar Weighted Returns ? V

This is the first episode of “We Eat Dollar Weighted Returns” where the fare is yummy.? Here’s the twist: investors in some bond ETFs have done better than one who bought at the beginning and held.

Now, all of this is history-dependent.? The particular bond funds I chose were among the largest and most well-known bond ETFs — HYG (iShares iBoxx $ High Yield Corporate Bd), JNK (SPDR Barclays Capital High Yield Bond), and TLT (iShares Barclays 20+ Year Treas Bond).

As bond funds go, these are relatively volatile.? TLT buys the longest Treasury bonds, taking interest rate risk.? HYG and JNK buy junk bonds, taking credit risk.

Let’s start with TLT:

Date

Cash Flow

Buy & Hold Return

Cumulated

11/9/2002

248,935,892

1

8/31/2003

-73,889,166

12.31%

1.1231

8/31/2004

439,348,999

3.11%

1.15802841

8/31/2005

73,509,821

6.72%

1.235847919

8/31/2006

442,211,811

6.12%

1.311481812

8/31/2007

165,784,828

3.37%

1.355678749

8/31/2008

-344,202,681

9.54%

1.485010502

8/31/2009

887,336,789

12.30%

1.667666793

8/31/2010

120,142,522

-5.85%

1.570108286

8/31/2011

-452,062,384

4.64%

1.64296131

2/29/2012

-3,038,265,474

32.32%

2.173966406

IRR

Buy & Hold

Difference

11.47%

8.42%

3.05%

I analyzed this back in June, saw the anomalous result, an decide to sit on it until I had more time to analyze it.? The way to think about it is that investors reached for yield at a time when stocks were in trouble, and indeed, rates went lower.? The average investor beat buy-and-hold by 3%.

Here are the results for the junk ETFs:

HYG

4/4/2007

2/29/2008

2/28/2009

2/28/2010

2/28/2011

2/29/2012

Distributions

-9,708

-92,708

-358,324

-512,979

-694,209

Net Additions

371,140

1,989,303

1,781,425

3,201,608

5,840,594

Net Assets

352,636

2,089,054

4,611,414

8,257,928

14,258,718

Investment Return

-8,796

-160,176

1,099,260

957,884

854,406

ROA

-4.57%

-13.12%

32.81%

14.89%

7.59%

4/4/2007

9/16/2007

8/29/2008

8/29/2009

8/29/2010

8/30/2011

2/29/2012

13.40%

IRR

-361,432

-1,896,594

-1,423,100

-2,688,629

-5,146,384

14,258,718

6.04%

Buy-and hold

7.36%

Difference
JNK

11/28/2007

6/30/2008

6/30/2009

6/30/2010

6/30/2011

6/30/2012

Distributions

-9,011

-111,409

-361,521

-616,525

-735,822

Net Additions

404,658

1,481,309

2,180,582

2,366,102

3,928,526

Net Assets

394,346

1,900,709

4,301,252

6,915,538

10,780,535

Investment Return

-1,302

136,463

581,481

864,710

672,292

ROA

-0.61%

11.89%

18.75%

15.42%

7.60%

IRR

11/28/2007

3/14/2008

12/29/2008

12/29/2009

12/29/2010

12/30/2011

6/30/2012

13.22%

IRR

-395,648

-1,369,900

-1,819,061

-1,749,577

-3,192,704

10,780,535

6.49%

Buy-and hold

6.73%

Difference

Both funds were small in advance of the credit crisis, and investors bought into them as yields spiked, and bought even more as income opportunities diminished largely due to the Fed’s low-rate monetary policies. The average investor beat buy-and-hold by 6%+.

Now, the? junk funds were small during default, and grew during the boom, amid unprecedented monetary [policy from the Fed.? (Note: I think that Bernanke will rank below Greenspan in the history books in 210o, and both will be judged to be horrendous failures.? It is better to let things fail, and clear out the bad debt, rather than continue malinvestment.? We need fewer banks, houses, and auto companies, among others.? The government, including the Fed and the GSEs, should not be in the lending business.? Lending should be unusual, and applied mostly to financing short-term assets.? Long-term assets should be financed by equity, or at worst, long-dated debt.

For all three funds, we have the historical accident that the Fed dropped Fed funds rates to near zero, leading to a yield frenzy.? But what happens when defaults spike?? What? happens when no one want to buy long dated Treasuries at anything near current levels?

I think bond investors are more rational than stock investors; they have more rational benchmarks to guide them.? Bond investors have cash flows to analyze against EBITDA (earnings before interest, taxes, depreciation and amortization.? Stock investors wonder at earnings, which are easily gamed.

The real question will come when we have the next credit crisis?? How many holders of HYG or JNK will run then?? Or when inflation starts to run, and the Fed stops buying long Treasury bonds, and even starts to sell them, what will happen to dollar-weighted returns then?

This is an interesting piece for bond assets in a bull market.? We need to see bear market results to truly understand what is going on.

Full disclosure: long TLT for myself and clients

Theme: Overlay by Kaira