Category: Quantitative Methods

The Equity Premium is No Longer a Puzzle

The Equity Premium is No Longer a Puzzle

For a number of years, I have mused over the equity premium puzzle, and have generally written that the premium return that equities earn over stocks is less than most asset allocators assume. In January 2006, wrote an article on this topic at RealMoney: Kiss the Equity Premium Goodbye.? A few quotes:

This article won’t win me a lot of friends in the money management industry. Here’s the skinny: Stocks are unlikely to return much more than bonds over the next 10 to 20 years.Most investment consultants tell people to invest in equities because, in the long run, stocks beat bonds and cash. I agree, but how big is this advantage? Many studies suggest that the equity premium is somewhere in the vicinity of 6%; i.e., stocks beat cash by 6 percentage points a year. Against bonds, the advantage is said to be 4% or so.

However, there are persuasive arguments that the value of the equity premium will be much lower going forward. In the book Triumph of the Optimists, Elroy Dimson, Paul Marsh and Mike Staunton argue that the future equity premium in the U.S. is likely to be closer to 4% over cash for two main reasons:

  • Corporate cash flows have grown faster in the last 50 years than in the prior 50, and investors have bid up stocks as a result. However, the authors believe that such high rates of growth will not continue. If corporate cash flow growth reverts to the rate of the first half of the 20th century, future returns based on current equity values will be poor indeed.
  • Perceived risk in stock investing has diminished. Investors have bid prices up in anticipation that the equity premium is higher than it should be, and on the belief that it is not risky to try to capture it.

The researchers Peter Bernstein and Robert Arnott draw similar conclusions, but they get there in different ways. They point out that over the years, the size of the future equity premium has varied with the level of belief in its existence. When market players deny its existence, equity valuations are low, past equity performance has probably been poor, and the future equity premium is large — think of 1931, 1937, 1974, 1982, November 1987 and 2002. When everyone believes in the inevitability of stocks, ? la “Dow 36,000” (we’ll get there by 2025 or so), equity valuations are high, past equity performance has probably been great, and the future equity premium is small — think 1929, 1972, August 1987 and February 2000.

I believe stocks have been bid up because of the benefit needs for the retirement of the baby boomers. Though the savings rate is low, investment vehicles such as pension plans have made large commitments to equities, partially because plan sponsors can justify lower contributions to benefit plans by assuming a high rate of return, which stems from assuming that the equity premium will persist.

and this:

This doesn’t directly generalize to the market as a whole, because all stocks are owned by someone at the end of each day. Isn’t there always a buyer for every seller, and vice versa? Yes, but they aren’t always public-market buyers and sellers. Cash comes into the market via IPOs (both primary and secondary), rights offerings and any other way that new shares get created for the payment of cash. Cash comes out of the market through dividends, buybacks and any other way that companies disburse cash to shareholders, whether directly or in exchange for shares.

Companies tend to sell stock when it is advantageous; IPOs happen more frequently when valuations are high, and buybacks happen more frequently when valuations are low. This suggests a project for future study: Calculate the dollar-weighted return for the public equity market as a whole, and compare it with the time-weighted return figures.

It’s a difficult but not impossible project, but I don’t have the time or resources to do it. If it hasn’t been done already, it might make a rare practical Ph.D. thesis for someone. Returns for the market as a whole would equal the change in market value, plus the cash cost of shares taken out of the market (buybacks, LBOs, etc.) and dividends, less the cash added to the market through IPOs and other forms of share issuance for cash (i.e., employee stock option exercise, rights offerings, etc.). I don’t have firm numbers, but my guess is that dollar-weighted returns are less than the time-weighted returns by 1 percentage point, give or take 50 basis points.

Though the composition of an index fund changes by period to reflect additional equity issuance/buyback by companies in the index, it misses the effect on returns from having to allocate more capital when valuations are high, and having to receive capital back when valuations are low. In a whipsaw period like that which we have had from 1998 to the present, it makes a lot of difference, because many investments during the bubble era put fresh capital into the market at a time of high valuations, with buybacks predominating as valuations troughed.

In short, though the academic studies rely on time-weighted rates of return for their conclusions regarding the equity premium, which represents buy-and-hold investors, dollar-weighted returns, which is what most investors actually receive on their investments, are lower. The difference occurs because corporations issue stock when valuations are high, and retire it when valuations are low.

Okay, here’s the punchline — with not just a hat tip, but a full bow to Eric Falkenstein at Falkenblog, Ilia D. Dichev has done the research that I wanted to see done.? The difference between time-weighted and dollar-weighted returns is around 1.3% for NYSE stocks (1926-2002), around 5.3% for NASDAQ stocks (1973-2002), and 1.5% for developed market stocks generally? (1973-2004).

Doing a very rough average, and considering that the NASDAQ was in a boom period for most of the study period, I am comfortable with a reduction in the US equity risk premium over bonds down to 1-2% on average, and over cash to 3-4% on average.

At that level, being in stocks works for long term investing, but it would almost never pay to be 100% in stocks.? The old 60/40 stocks/bonds allocation begins to look really intelligent over the long haul, but maybe not today because high quality bond yields are so low.

So, where does this leave me on the equity premium puzzle?? It is no longer a puzzle.? One can gain moderately over the very long haul in stocks versus bonds, but with significant volatility.? Don’t risk what you can’t afford to lose in the stock market, and other risky investment vehicles.

PS — this makes the old dictum on the cost of equity valid again — the cost of equity capital for a firm should be 2-3% above their longest bond yield.? Bye, bye, CAPM.

Toward a New Concept of Asset Allocation

Toward a New Concept of Asset Allocation

To my readers: thanks for your responses to yesterday’s article.? I will do a follow up piece soon.? If you have more comments please make them — they will help me with the piece.? Main new concepts coming — need for a deliverable, speculators can’t trade with speculators, only hedgers.

=-=–==-=–==-=-=-=-=-=-=-=-=-=-=–==-=-=-=-

Longtime readers know that I am not a fan of modern portfolio theory.? It is a failure for many reasons:

  • It assumes there is one type of risk, the occurence of which is random.
  • It assumes that this risk can be approximated by volatility (variance of returns), rather than probability of loss, and the likely severity thereof.
  • Mean return estimates, volatility estimates, and correlation coefficient estimates aren’t stable.
  • In crises, correlations head to 1 or -1.? Assets divide into safe and “not safe.”
  • Problem: some assets always fall into the “not safe” bucket, but what falls into the safe bucket can vary.? Long Treasuries and commodities could be examples of assets that vary during a crisis, depending on the type of crisis.
  • It does not recognize multiple time horizons easily.? Bonds held to maturity have a different risk profile than a constantly rebalanced portfolio.
  • Risk is the same for all people, and their decision-making time horizons are the same as well.
  • And more…

I’m still playing around with the elements of what would make up a new asset allocation model, but a new model has to disaggregate risk into risks, and ask some basic questions:

  • Where am I getting paid to take risk?
  • Where am I getting paid to avoid risk?
  • What aspects of the financial landscape offer the potential for a change in behavior, even if it might take a while to get there?? What major imbalances exist?? Where are dumb people making money?
  • Where options are available, how is implied volatility relative to long-term averages?
  • What asset classes have momentum to their total returns?

One good example of an approach like this is Jeremy Grantham at GMO.? Asset allocation begins by measuring likely cash flow yields on asset classes, together with the likelihood of obtaining those estimates.? With domestic bonds, the estimates are relatively easy.? Look at the current yield, with a haircut for defaults and optionality.? Still there is room to add value in bonds, looking at what sectors are cheap.

  • Are corporate spreads narrow or wide?
  • How are residential mortgage bonds priced relative to agency bonds, after adjusting for negative optionality?
  • How steep is the yield curve, and where is Fed policy?
  • What is the speculative feel of the market now?? Bold? Scared? Normal?
  • Related, how are illiquid issues doing?? Are they permafrost, or are molasses not in January?
  • If every risk factor in domestic bonds looks lousy, it is time to make a larger allocation to foreign bonds.
  • Cash is underrated, and it is safe.

Understanding bonds is an aid to understanding the rest of the market.? The risk factors in play in the bond market are more transparent than elsewhere, but the rest of the markets eventually adjust to them.

With stocks and commodities, the answer is tougher — we have to estimate future demand and supply for commodities.? Tough.? With stocks, we need to estimate future earnings, and apply a P/E multiple that is consistent with the future yield on BBB corporate bonds.? There is some degree of mean-reversion that can help our estimates, but I would not rely on that too heavily.

There is one more aspect to layer in here: illiquidity of equity investments.? With limited partnerships of any sort, whether they are hedge funds, venture capital, private equity, etc., one has to analyze a few factors:

  • Where is the sector in its speculative cycle?? Where are secondary interests being sold?
  • How much capacity do you have for such investments?? How much of your liability structure is near-permanent?? Is the same true of peer institutions?
  • Is the public equity market overvalued or undervalued?? Public and private tend to track each other.

Beyond that we get to the structure and goals of the entity neding the assets allocated.? Time horizon, skittishness, and understanding levels are key for making a reasonable allocation.

This is just my initial brain dump.? It was spurred by this article in the WSJ, on how asset allocation had failed.? Add in the article on immediate annuities, which are a great aid in personal retirement planning.? For those that think that immediate annuities reduce the inheritance to the children, I would simply say that it is longevity insurance.? If the annuitant lives a long time, he might run out of assets, and might rely on his children for help.? The immediate annuity would be there to kick in something.

Why did asset allocation fail in 2008?? All risk assets failed.? Stocks, corporate bonds, venture capital, private equity, CMBS, RMBS, ABS… nothing held up.? There were just varying degress of loss.? Oh, add in Real Estate, and REITs.? Destroyed.? Destroyed…

When the system as a whole has too much leverage, all risky asset classes get affected.? That’s what happened in 2008, as speculators got their heads handed to them, including many who did not realize that they were speculators.

Efficient Markets as a Limiting Concept; There are Conceptual Limits to Efficient Markets

Efficient Markets as a Limiting Concept; There are Conceptual Limits to Efficient Markets

I do and don’t believe in the efficient markets hypothesis [EMH].? I do believe in the adaptive markets hypothesis [AMH].?? The efficient markets hypothesis posits that:

  • Past price-related information can’t be used to obtain better-than-average returns. (weak form of the EMH — cuts against technicians)
  • Past and present public information can’t be used to obtain better-than-average returns. (semi-strong form of the EMH — cuts against fundamental analysis)
  • Public and private information can’t be used to obtain better-than-average returns. (strong form of the EMH — believed by few)

In practice, the academic community holds to the semi-strong? form, while the investment community holds to the weak form.? One thing is certain: the market is dominated by large institutions, and the market on the whole, less fees, cannot beat the returns of the market on the whole.

Part of the problem with the EMH is that with respect to the market as a whole, of course it is true.? The real question is whether any particular strategy covering a small portion of the assets of the market can consistently beat the returns of the market on the whole.? I believe the answer to that question is yes.

An implicit assumption of the EMH is that research costs are free.? They are not free.? Also, it implicitly assumes that a dominant number of investors understand what information drives the markets.? Both assumptions are not true — even in the most clever firms, there is information that is missed, and research costs are expensive, and not always rewarded.

But the effort to earn above-average returns forces the market closer to the EMH.? When the competition is tough, finding excess returns is hard.? This makes it a limiting concept.? We never get there, but effort to find above-average returns gets us closer to that ideal.? Conversely, when many decide to index, those who do not index have a better chance at earning above normal returns, because there is a large chunk of naive capital in the market seeking average returns with certainty.

I want average people to use index funds for many reasons:

  • It lowers their costs.
  • It is tax-efficient.
  • Most people aren’t very good at picking equity managers.? They go for the manager who is hot, in the style that is hot, rather than one that did better in the past, and is in a cold spell now.? They go for large fund groups that spread their research over large asset bases, diluting whatever skill they might have.?? The best managers are the smaller specialists running their own funds, and who eat their own cooking.? They are also inconvenient to use.
  • It improves conditions for the remaining active managers.

I also want them to buy-and-hold (dirty words) because they aren’t very good at market timing, and also have enough in safe assets to lower the downside of returns to a level that does not panic them.? Most people are bad at most investment decision-making.? Better to hand it off to those who don’t panic or get greedy, than to be a part of those who buy into tops or sell into bottoms.

On the AMH, quoting from another piece of mine of the topic:

The adaptive markets hypothesis says that all of the market inefficiencies exist in a tension with the efficient markets, and that market players make the market more efficient by looking for the inefficiencies, and profiting from them until they disappear, or atleast, until they get so small that it?s not worth the search costs any more.

And so it is for those of us who are active managers.? We have a twofold task:

  • Base our strategies in areas that are unlikely to be overfished for long — e.g., low valuation, positive momentum, and earnings quality.
  • Dip into areas that are temporarily out of favor, whether those are industries, countries, or odd risk factors.? (Odd risk factors: occasionally certain factors in the markets are poison, and even the slightest taint marks a security off-limits, even though those that are barely affected are fine.? My example would be Enron-like structures 2001-2002.? Few would buy the stocks or bonds of companies that had them, even though those structures were not large enough to impair the company, as they did with Enron.? We bought the bonds of a Dominion subsidiary with abandon, because we knew the covenants the bonds had would not kill Dominion, and we had extra value as a result.? What killed Enron benefited us, indirectly.)

To active managers then, I warn: watch how your main strategy goes in and out of favor.? It happens to all of us.? Add to your main strategy most when it is out of favor, and add to whatever alternative you have when your main strategy is running hot.

To average investors, then, I advise: if you adjust frequently, add to your winners and prune your losers.? If you adjust infrequntly (once a year or less), prune your winners and add to your losers.? In the short run, momentum persists, in the longer-term, it mean reverts.

Know yourself.? If you are prone to panic and fear with investments, better to hand the job off to someone competent who will be dispassionate.? If you have conquered those emotions, you can potentially do better yourself in investing.? But ask yourself what your sustainable competitive advantage is in investing.? If you don’t have one, better to index.

Correlation Does Not Imply Causation; A Study of Sector Correlations

Correlation Does Not Imply Causation; A Study of Sector Correlations

There was an interesting post on Bloomberg regarding asset class correlations, and a lot of blogs wrote about it, including Abnormal Returns, which did a nice summary, and expanded the argument to university endowments.? Part of the issue here is that under conditions of stress, assets separate into two simple categories — safe and risky.? To what degree can an asset be turned into cash at anything near its fair value under stressed conditions?

I ran into something similar back in 2006, so I wrote this CC post:


David Merkel
Make the Money Sweat, Man! We Got Retirements to Fund, and Little Time to do it!
3/28/2006 10:23 AM EST

What prompts this post was a bit of research from the estimable Richard Bernstein of Merrill Lynch, where he showed how correlations of returns in risky asset classes have risen over the past six years. (Get your hands on this one if you can.) Commodities, International Stocks, Hedge Funds, and Small Cap Stocks have become more correlated with US Large Cap Stocks over the past five years. With the exception of commodities, the 5-year correlations are over 90%. I would add in other asset classes as well: credit default, emerging markets, junk bonds, low-quality stocks, the toxic waste of Asset- and Mortgage-backed securities, and private equity. Also, all sectors inside the S&P 500 have become more correlated to the S&P 500, with the exception of consumer staples.

In my opinion, this is due to the flood of liquidity seeking high stable returns, which is in turn driven partially by the need to fund the retirements of the baby boomers, and by modern portfolio theory with its mistaken view of risk as variability, rather than probability of loss, and the likely severity thereof. Also, the asset allocators use “brain dead” models that for the most part view the past as prologue, and for the most part project future returns as “the present, but not so much.” Works fine in the middle of a liquidity wave, but lousy at the turning points.

Taking risk to get stable returns is a crowded trade. Asset-specific risk may be lower today in a Modern Portfolio Theory sense. Return variability is low; implied volatilities are for the most part low. But in my opinion, the lack of volatility is hiding an increase in systemic risk. When risky assets have a bad time, they may behave badly as a group.

The only uncorrelated classes at present are cash and bonds (the higher quality the better). If you want diversification in this market, remember fixed income and cash. Oh, and as an aside, think of Municipal bonds, because they are the only fixed income asset class that the flood of foreign liquidity hasn’t touched.

Don’t make aggressive moves rapidly, but my advice is to position your portfolios more conservatively within your risk tolerance.

Position: none

Hmm… in early 2006, we were considerably in advance of the peak that would come in late 2007, but considerably above where we are now.? In my opinion, given my longer timeframe, a good call.

But maybe correlations might rise during times when everyone is anxious to buy risky assets, not just when the want to throw them away.? Do asset correlations rise near peaks for risky assets?

My model on correlations relies on the major industry sectors of the S&P 500:

  • Consumer Discretionary
  • Consumer Staples
  • Energy
  • Financials
  • Health Care
  • Industrials
  • Information Tech
  • Materials
  • Telecom Services
  • Utilities

If lots of money is getting thrown at stocks, won’t the correlations between sectors rise?? And if so, won’t future returns be low or negative?

Here is a graph showing the price return on the S&P 500 over the next 60 days as a function of the average sector correlation over the last 60 days:

Not much of a relationship, huh?? 1% R-squared.? And it goes the wrong way — high correlations very weakly favor higher returns.

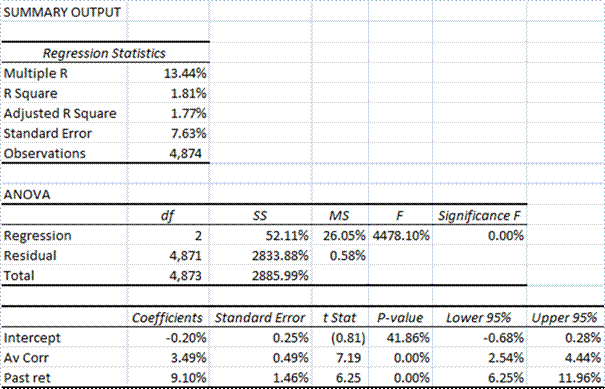
But what if we do a regression where future S&P 500 returns are regressed on past S&P 500 returns and average sector correlations?

Wow, we get a 2% R-squared! 😉 It also shows that momentum persists, and higher average sector correlation has a similar effect to the above model, still positive on future returns.

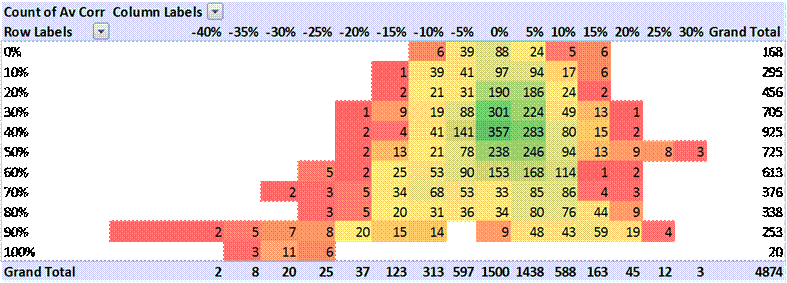
Here is a heat map where the average 60-day past return is on the horizontal axis, and average sector correlation is on the vertical axis, and the variable displayed is frequency of occurrence.

Looks pretty average, with the two effects being fairly separate, with an odd southwestern quadrant.

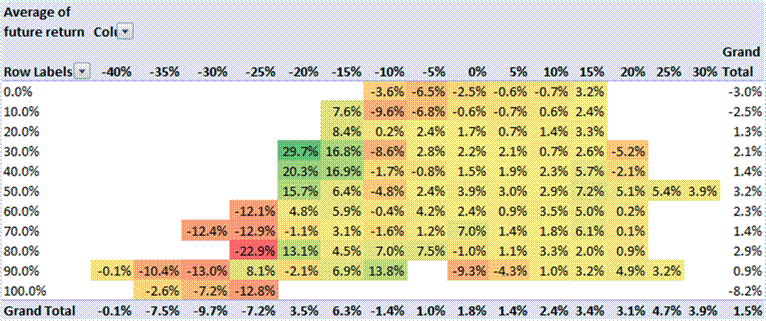
Here is a heat map where the average 60-day past return is on the horizontal axis, and average sector correlation is on the vertical axis, and the variable displayed is average future 60-day returns.

Here are my tentative findings:

  • Price momentum persists.? 60 days of weakness/strength tends to beget 60 more days of weakness/strength.
  • Extremely high or low average sector correlations seem to go along with low returns.? Middling average sector correlations seem to go along with higher returns.
  • Low average sector correlations and lousy past price performance seems to beget excellent future performance.
  • High average sector correlations and lousy past price performance seems to beget lousy future performance.
  • When past price momentum is high, average sector correlation doesn’t seem to matter as much.
  • If past trends continue, average returns over the the next 60 days are around 2.5% with a very wide error band.? Current average sector correlation is 50%, and past 60 days returns are 9%.

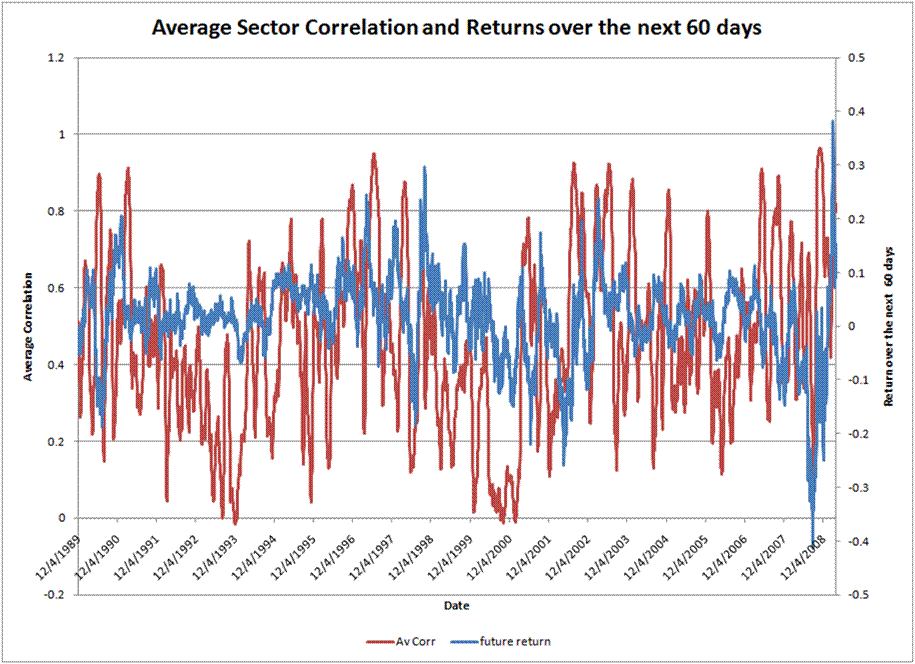
One final graph:

Do you see a pattern here where high average sector correlations come before market peaks?? I don’t.

All that said…

I know the earlier articles dealt with asset class correlations, rather than correlations with stock market sectors.? I would have expected the same result.? Maybe there is aonther way to do this analysis separating out safe sectors from risky sectors.

But what are safe sectors?? Utilities? Consider 2001-2003.? Telephone services? Also 2000-2003.? Financials? 2007-?? Perhaps Consumer Staples is the only truly safe sector… or maybe it should be energy? Consider the early ’90s.

This is one article where I end scratching my head, but publish anyway, because:

1) My readers may help me.

2) It is valuable to know where research dead ends exist.

After all this, I don’t see average sector correlations as a valuable variable in investing.? Maybe that is not true of asset classes.? If anyone has the proper data to send to me on that, I will reproduce an analysis like this, and tell you what I find.

Praise for Peter Bernstein

Praise for Peter Bernstein

I have learned a lot from the late Peter Bernstein. I remember a piece of his entitled (something like), “What is Liquidity?” where he described liquidity as the ability to change your mind or request a do-over. Bright guy, and one who focused on the big issues, not minutiae.

I met Peter Bernstein in 2002 when he delivered a timely talk to the Baltimore Security Analysts Society called (something like), “The Continuing Relevance of Dividends.” I asked a question during the Q&A, and then was able to talk with him for ten minutes afterward, because few wanted to embrace such a boring topic. He was very gracious to me, and encouraged me in my research pursuits.

There were many who offered their praises of Peter Bernstein and I offer the links here:

As for his books, I offer the links here:

There may be more than this, but it was what I was able to find.? Peter Bernstein aimed for large targets, and gave broad and convincing evidence of how markets worked.? He only erred in letting Modern Portfolio Theory and Keynesianism affect him.

With that, I hail Peter Bernstein, regretting his demise.? He will be missed, as few of us had such global vision of markets as he had.

Full disclosure: if you buy anything from Amazon after entering here, I get a small commission, but your prices don’t go up.

Problems with Constant Compound Interest (3)

Problems with Constant Compound Interest (3)

This post should end the series, at least for now.? Tonight I want to talk about the limits to compounding growth.? Drawing from an old article of mine freely available at TSCM, I quote? the following regarding talking to management teams:

What single constraint on the profitable growth of your enterprise would you eliminate if you could?

Companies tend to grow very rapidly until they run into something that constrains their growth. Common constraints are:

  • insufficient demand at current prices
  • insufficient talent for some critical labor resource at current prices
  • insufficient supply from some critical resource supplier at current prices (the “commodity” in question could be iron ore, unionized labor contracts, etc.)
  • insufficient fixed capital (e.g., “We would refine more oil if we could, but our refineries are already running at 102% of rated capacity. We would build another refinery if we could, but we’re just not sure we could get the permits. Even if we could get the permits, we wonder if long-term pricing would make it profitable.”)
  • insufficient financial capital (e.g., “We’re opening new stores as fast as we can, but we don’t feel that it is prudent to borrow more at present, and raising equity would dilute current shareholders.”)

There are more, but you get the idea.

Again, the intelligent analyst has a reasonable idea of the answer before he asks the question. Part of the exercise is testing how businesslike management is, with the opportunity to learn something new in terms of the difficulties that a management team faces in raising profits.

As with biological processes, when there are unlimited resources, and no predators, growth of populations is exponential.? But there are limits to business and investment profits because of competition for customers or suppliers, and good untried ideas are scarce.? Once a company has saturated its markets, it needs a new highly successful product to keep the growth up. Perhaps international expansion will work, or maybe not?? Are there new marketing channels, alternative uses, etc?

Trying to maintain a consistently high return on equity [ROE] over a long period of time is a fools bargain and I’ll use an anecdote from a company I know well, AIG.? I was pricing a new annuity product for AIG, and I noticed the pattern for the ROE of the product was not linear — it fell through the surrender charge period, and then jumped to a high level after the surrender charge period was over.

I scratched my head, and said “How can I make a decision off of that?”? I decided to create a new measure called constant return on equity [CROE], where I adjusted for capital employed, and calculated the internal rate of return of the free cash flows.? I.e., what were we earning on capital, on average over the life of the product.

I took it to my higher-ups, hoping they would be pleased, and one said, “You don’t get it!? You don’t argue with Moses!? The commandment around here is a 15% return on average equity after-tax!? I don’t care about your new measure!? Does it give us a 15% return on average equity or not?!”

This person did not care for nuances, but I tried to explain the ROE pattern, and how this measure averaged it out.? It did not fly.? As many have commented, AIG was not a place that prized actuaries, particularly ones with principles.

As it was AIG found ways to keep its ROE high:

  • Exotic markets.
  • Be in every country.
  • Be in every market in the US.
  • Play sharp with reinsurers.
  • Increase leverage
  • Press the accounting hard, including finite reinsurance and other distortions of accounting.
  • Treat credit default swap premiums as “found money.”
  • Take on additional credit risk, like subprime lending inside the life companies through securities lending.

In the end, it was a mess, and destroyed what could have been a really good company.? Now, it won’t pay back the government in full, much less provide anything to its shareholders, common and preferred.

Even a company that is clever about acquisitions, like Assurant, where they do little tuck-in acquisitions and grow them organically, will eventually fall prey to the limits of their own growth.? That won’t happen for a while there, but for any company, it is something to watch.? Consistently high growth requires consistently increasing innovation, and that is really hard to do as the assets grow.

If True of Companies, More True of Governments

This is not only true of companies, but even nations.? After a long boom period, state and federal governments stopped treating growth in asset values as a birthright, granting them a seemingly unlimited stream of taxes from capital gains, property, and transfer taxes.? They took it a step further, borrowing in the present because they knew they would have more taxes later.? The states, most of which had to run a balanced budget, cheated in a different way — they didn’t lay aside enough cash for their pension and retiree healthcare promises.? The Federal government did both — borrowing and underfunding, because tomorrow will always be better than today.

Over a long enough period of time, things will be better in the future, absent plague, famine, rampant socialism, or war on your home soil.? But when a government makes long-dated promises, the future has to be better by a certain amount, and if not, there will be trouble. That’s why an economic downturn is so costly now, the dogs are behind the rabbit already, running backwards while the rabbit moves forwards makes it that much harder to catch up.

I’ve often said that observed economic relationships stop working when people start relying on them, or, start borrowing against them.? The system shifts in order to eliminate the “free lunch” that many thought was available.

A Final Note

Hedge funds and other aggressive investment vehicles should take note.? Just as it is impossible for corporations to compound their high profits for many decades, it is impossible to do the same as an investor.? Size catches up with you.? It’s a lot easier to manage a smaller amount — there are only so many opportunities and inefficiencies, and even fewer when you have to do so in size, like Mr. Buffett has to do.

“No tree grows to the sky.”? Wise words worth taking to heart.? Investment, Corporate, and Economic systems have limits in the intermediate-term.? Wise investors respect those limits, and look for growth in medium-sized and smaller institutions, not the growth heroes of the past, which are behemoths now.

As for governments, be skeptical of the ability of governments to “do it all,” being a savior for every problem.? Their resources are more limited than most would think. Also, look at the retreat in housing prices, because the retreat there is a display of what is happening? to tax revenues… the dearth will last as long.

Full disclosure: long AIZ

Problems with Constant Compound Interest (2)

Problems with Constant Compound Interest (2)

I had many good comments on part 1 of this series.? One was particularly good that focused on the economy as a whole, and how the promises made by the government were unlikely to be fulfilled with Social Security and Medicare.? Our government attempts to finance programs on the cheap by relying on future growth, which does not always happen.? They move up spending rapidly if growth is large, and small if growth is negative.? In either case, the government grows as a fraction of the economy.

But let me consider asset allocation projections.? It is really difficult to consider average projections of asset returns, whether in real or nominal terms.? Asset returns vary considerably, and the number of years from which average returns are calculated are few relative to the volatility of returns.

We have created an industry of asset allocators, many of which have allocated off of foolish long-term historical assumptions, as if the past were prologue.? Even if they use stochastic models, the central tendency is critical.? What do they assume they can earn over long-dated investment grade debt?? The higher that margin is, the more they lead people astray.? Stocks win in the long run, but maybe by 1-2%, not 4-6%.

Consider defined benefit pension funds — after all, it is the same problem.? What is the right long term rate to assume for asset performance?? Alas there is no good answer, and with private DB plans continuing to terminate because of underfunding, the answer is less than clear.

Scoundrels use the mechanism of discounting to their own ends — they make future obligations seem smaller than they should be, magnifying profits, and minimizing capital needs.? Cash flows are inexorable, though.? There are few ways to avoid the promises from pensions.

Investors, be aware.? Realize that long term investment assumptions are probably liberal.? Also realize that long term assets and liabilities that rely on those assumptions have liberal valuations as well.? After all, who wants to under-report income when the accounting is squishy?

Now, for my readers, what have I missed?

Loss Severity Leverage

Loss Severity Leverage

I’ve been analyzing on some surplus notes from a mutual life insurer which is part of a group of mutual insurers.? Mutual insurers are opaque, because there are no large private interests external to the company with a concentrated interest in the well-being of the company.? This company lost significant money in 2008 and the first quarter of 2009.? Most of it was writedowns on non-GSE (not Fannie, nor Freddie) residential mortgage bonds, where they bought mezzanine or subordinated bonds.

Wait.? Some definitions:

Senior bonds: those rated AAA, representing the group that gets paid first in a securitization.? In a securitization where the loss experience is so bad that the senior bonds take losses, typically all of the senior bonds get paid pro-rata.

Subordinate bonds: Bonds that receive high yields in a securitzation (rated BBB and below), but take losses first as losses emerge.? High risk, high return (maybe).

Mezzanine bonds: If the subordinate bonds get wiped out, the Mezzanine bonds (rated AA and A) are next.? Not much extra yield, but less chance of loss.

When a securitization goes bad, the juniormost bonds get losses allocated to them until they wiped out, then it goes to the next most junior class.? This highlights a difference between the loss severities of corporate bonds and structured bonds.? With corporate bonds, there is some recovery of principal — not all of the principal, of course, but 40% on average.? With structured bonds, typically you get all of your principal paid, or none of your principal paid (excluding early amortization).

I realized this for the first time when I analyzed the Criimi Mae Securitizations back in 1999.? The securitization trusts contained mostly junk-rated CMBS tranches, and junk-rated securitizations of other CMBS deals, and they sold off investment grade participations in the securitizations.? This was the messiest set of deals that I ever analyzed.? It reinforced one idea to me, that if you are not senior in a deal, you may lose it all.? With structured finance, there is loss severity leverage in mezzanine and subordinate bonds.

Going back to the firm I was analyzing, When I looked at their performance last year, I thought, “Stable company.? Bread and butter life company.? As my old boss said, ‘It takes more than incompetence to kill a mutual life insurer, it takes malice.’ ”

Today I am not so sure.? I once was a mortgage bond manager, and I bought senior securities because the yield spreads on the lower-rated securities were so small.? This company, like Principal Financial, bought mezzanine and subordinate bonds in significant measure, though they did slow down after 2005.

I have estimated the likely losses on the bonds that the company owns, and it is unlikely but not impossible that the company dies in the next few years.? The parent mutual company has ponied up money recently, and will probably do so in the future.? Who can tell?

My estimates of loss are less than those that the bond market is estimating.? If we marked the assets of the company to market, it would be significantly insolvent.? Insurance policies are high credit quality obligations, they don’t vary as much as bonds that are risky.? Now, if I had the Actuarial Opinion and Memorandum, perhaps I could know the truth.? That group of documents analyzes the long-term ability of a life insurance company to survive.? That document is sadly not public.? If it suggested that the company in question needed additional capital, that would be reflected in the public filings, and there is no such reference for the company in question.

Can You Afford To Lose It All?

Anytime one buys a mezzanine or subordinated security, or buys a surplus note, or trust-preferred security, or other bit of junior debt or preferred stock, one must ask, “Can I afford to lose it all?”? When there are senior investors, investors that are more junior can get whacked.? Senior investors ordinarily must be paid in full before junior investors get paid.

This applies even to AA and A-rated structured securities.? They aren’t senior, so they can lose all their principal.? And that’s what this life insurance company bought a lot of, picking up a princely few extra tenths of a percent in interest over the AAA bonds for a lot more risk.

How Did These Securities Get Such High Ratings?

Uh, seemed like a good idea at the time?? ;)?? As I’ve said before, it is impossible to set regulatory capital levels or subordination levels for assets that have not been through a failure cycle.? New asset classes have no track record of failure, and as such, estimating the likely expected present value of losses, and how variable losses could be is just an educated guess.? Sometimes they would apply models of related asset classes and tweak them.? That’s still a guess, though.

Also, using statistics for assets held on balance sheets, and applying them to securitizations, where the originator has little skin in the game, made the assumptions made for losses on residential mortgage lending too low.

The rating agencies did have competitive pressures to get business, but my view is that they did not have sufficient relevant loss experience to guide them.

What Should Have Been Done?

Regulators abdicated their duties by merely relying on the rating agencies. Ratings are fine in theory, and someone has to make judgments of relative risk, but the macro decision of what classes of investments are permitted, and what capital level to hold against them belongs to the regulators.? The regulators haven’t done well in setting up rating agencies of their own, so let the rating agencies continue on, but let the regulators be smarter in how they set the capital levels (higher for structured products than for corporates and munis, because of loss severity leverage), and what they allow regulated entities to invest in.

My view is that any new asset class has to go through a failure cycle before regulators allow regulated entities to invest in them.? Investments in such new assets? should be treated as a deduction from equity.

Wait, We Need to Invest in Those Assets to Stay Competitive!

That scream came the regulated entities.? Sorry guys, the risks of untried asset classes belongs to unregulated entities that don’t have deposit insurance, state guarantee funds, etc., where there is no systemic risk.? If they go under, no one in the public domain should care.

In principle, it shouldn’t matter within a group of regulated companies what the rules are, so long as they are enforced similarly by the regulators.

Anything else?

One final note — there is one medium-sized mutual insurer flying under the radar that I think its state regulator is unaware of the risks that it faces, and the rating agencies as well… it carries high ratings from all the main insurance raters.? Given the project that I am currently working on, I can’t reveal the name, but the guaranty funds would be more than capable of handling the failure.

Fruits and Vegetables Versus Assets in Demand

Fruits and Vegetables Versus Assets in Demand

There is a way in which fruits and vegetables and financial products are opposites: when quantities are high for fruits and vegetables, quality is high, and prices are low. With financial products, when issuance is high, quality is low, and pricing is expensive, leading to poor future returns from lower yields, and higher future defaults. I offer this for what it is worth, but is there something more to it, than the seeming oppositeness?? Why are they opposites?

What to do with a Negative Swap Spread

What to do with a Negative Swap Spread

From a recent article of mine, this is what I was asked, and how I responded:

  1. matt Says:
    Mr. Merkel:

    I think that I saw somewhere (recently) that swap spreads on the long end were negative. I assume (correct me if I?m wrong) that this is the spread over treasuries. How is this possible? What does/did it mean?

    PS: Good luck to all of the CFA candidates who took there exams today?

  2. David Merkel Says:
    I was taught way back when that it should be impossible. I was taught that it was impossible for the swap curve to invert, but it did it at the end of the last tightening cycle.

    John Jansen has written about this, and others have commented at his excellent blog on this topic. This is my take: there are many who want to receive fixed, and pay floating for a long time. This depresses the 30-year swap yield.

    Some want to do so because they are hedging exotic instruments that do the opposite, others because they might be hedging long term guarantees for long-dated liabilities (pensions, etc.), looking to minimize losses synthetically.

    I?m not sure anyone has the definitive answer. But here?s a game to play. Swap rates reflect AA counterparties. Take a 30-year Treasury. Pay fixed on the swap, receive back 3-month LIBOR. The package now pays 20 bp over 3-month LIBOR. Put it in a trust, get Moody?s and S&P to rate it, and call it ?The Floating Rate Treasury Trust.? Sell participations to money market funds. This beats three-month T-bills by a little less than 60 basis points before expenses.

    Now, I wouldn?t buy that if I were managing a money market fund just because of the illiquidity versus Treasuries. But there is a tweak we could try:

    On top of the trust, offer protection on a basket of 100 single-A names on a five year rolling basis. Now the yield really swings; negotiate terms with the rating agencies so that it can be rated A1/P1/F1.? The excess yield is worth the illiquidity.

=–==-=-=-=–==-==-=-=-=-=-=-

Okay, 30-year swap yields have been less than Treasuries for some time.? I’m not totally certain as to why.? There are a lot of games going on in the derivatives markets, and they seem to favor buying long and financing short.? I do know that there are gains to be made in the short run from taking the opposite position, unusual as that is… but as with any anomaly in the market, be cautious, because the motives of other players shift, making opportunities more attractive, less attractive, or unattractive.

Theme: Overlay by Kaira