Category: Quantitative Methods

Creating a Black Swan

Creating a Black Swan

How do you create a Black Swan? It’s not that hard.? Start with something that you know is seemingly useful, true or good.? Then slavishly rely on that idea until it fails.? I’ll toss out a few here:

  • The more people that live in houses that they own, the better.? The government should encourage home ownership.? You should own the biggest house you can afford.? (In 1986, a Realtor pitched me with that idea, and I thought it was dumb then.)? Residential housing is an investment for the masses; the prices never go down for the nation as a whole.
  • Continually maximizing return on equity will maximize stock prices.? Optimal capital structures and all times.
  • We all want high, smooth returns from our investments — high Sharpe Ratios, everyone!
  • Proper central banking practice can lead to near-permanent prosperity with moderate volatility.
  • Our government can borrow without limit to promote or common prosperity.? Our central bank can cleverly intervene in markets with their assets, and fix things without getting stuck, or creating inflation.

Many ideas that are good marginally aren’t so good if pressed to their logical absurd.? By duping marginal homebuyers into buying what they could not afford, we create a black swan — I remember commentators who were saying as late as 2006 year end, that home prices never went down across the nation as a whole.? It wasn’t true if you looked at the Great Depression or episodes in the 19th century, but people beieved that housing prices could not go down, so they piled into it creating a boom, a glut, and now a bust and a glut.? Behold the Black Swan!? Rapidly falling housing prices across the nation as a whole.

Consider the buyback craze, now deflated.? Was it good to buy back like mad in 2004-2006?? I would tell insurance management teams to leave more of a buffer for adverse deviations.? But it was always easier in the short run for insurance CFOs to buy back more stock, and earnings would rise.? Stock prices would improve as well, and that’s fine during the boom cycle, for then, but many would issue expensive hybrid junior debt with an accelerated stock repurchase.? Short term smart, long term dumb.

The insurance industry is my example here, but it went on elsewhere.? How many acquiring CFOs wish they had used stock rather than cash for the last major acquisition that they did?? Most, I’m sure.

There is always a boom-bust cycle, and there is ordinary trouble during a normal bust phase.? But when the boom phase has parties abandoning all caution, possibly with government acquiesence, the boom gets huge, and the bust too, where the Black Swan appears — things you thought could never happen.

The craze for smooth, high, uncorrelated returns led to a boom in alternative strategies in the investment business.? Return correlations change not only due to cash flows on the underlying investments, but also due to investor demand.? Not so amazingly, as alternative investments go mainstream, the returns fall and become more correlated.? When an alternative is new, typically only the best ideas get done.? When it is near maturity, only the marginal ideas get done.? Alternative asset prices get bid up along with the boom in conventional assets.

Now we get a Black Swan — all risk assets do badly at the same time.? Investors in private equity don’t want to fund their commitments.? Some venture capital backed firms will fail (here and here).? Many hedge funds raise their gates, all at the same time, because investors want out.? Liquidity is scarce.? Companies pay in kind where they can, whether it is on “covenant lite” loans, REIT dividends, etc.? The era of buying back at high prices gives way to equity issuance at low prices.

Now for my final Black Swan, and perhaps the most controversial.? Monetary policy is “optimal” when it follows the Taylor Rule.? A good central banker, applying the rule, should minimize inflation and macroeconomic volatility.

My argument here, which seems intuitively correct to me, but I can’t yet prove, is that continuous application of the Taylor Rule will eventually lead us into a liquidity trap.? That might be more due to the human nature of sloppy central bankers like Greenspan, who want adulation, and err on the side of monetary lenience.? Or, it might be that the central banker overestimates the productive capacity of the economy.? Whatever the reason, we followed something pretty close to the Taylor rule for 15 years, and now we are in a liquidity trap of sorts.? I’ve suggested it before, but perhaps monetary policy should not focus on (at least solely) price inflation or unemployment, but on the level of total debt relative to GDP.

As with so many things in a complex capitalist economy with fiat money, there may not be a right answer.? Optimizing for one set of variables often leads to unforseen pessimizing (a new word!) another set of variables.? What works in the short run often does not work in the long run.

In closing, consider a Black Swan of the future.? Governments globally nationalize financial institutions, run huge deficits and borrow a lot of money to do so.? They “stimulate” the economy through targeted spending, and ignore the future consequences of the debts incurred.? They do it in the face of the coming demographic bust for the developed nations plus China.? My expectation is that these “solutions” will not do much to deal with the economic weakness induced by the debt overhang.

As Walter Wriston famously said, “A country does not go bankrupt.”? Perhaps what he should have said was the country remains in place, only the creditors get stiffed.? Short of war, it is tough to reorganize or liquidate a country.? But I’lltake the sentiment a different way and say that most people believe “A developed country does not go bankrupt.”? That is the black swan that will be displayed here, and Iceland is the harbinger of what might be a future trend of developed country sovereign defaults, or their close cousin, high inflation.

A Different Look at Industry Momentum — II

A Different Look at Industry Momentum — II

There have been a lot of posts on the power of the momentum anomaly lately.? To mention two, there was my post, A Different Look at Industry Momentum, and a post by Mebane Faber at his excellent blog World Beta, Quantitative Strategies for Achieving Alpha.? I know there have been more recently, but somehow I did not bookmark them.

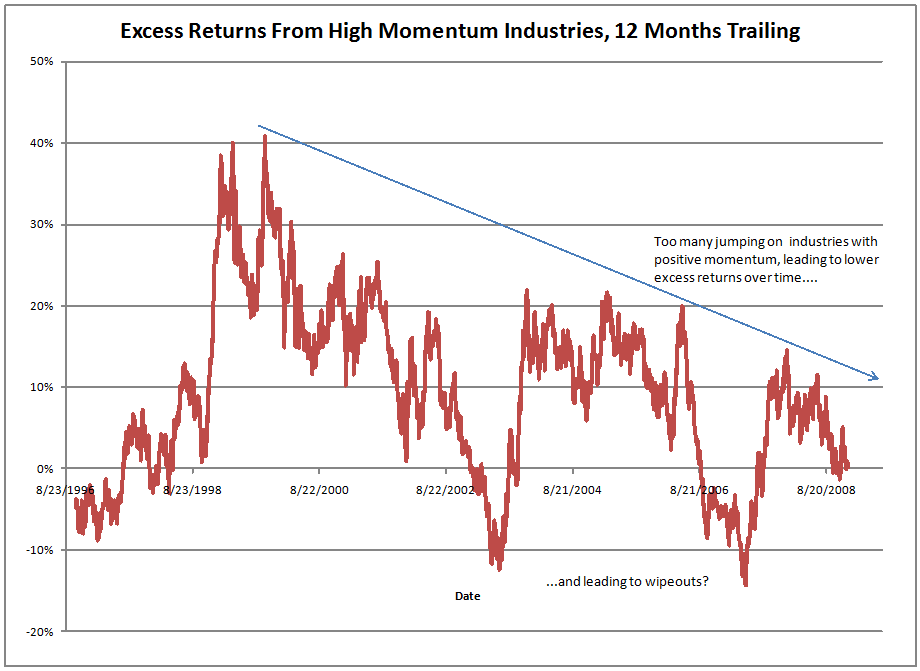
Tonight’s note considers whether the strength of the momentum effect might not be waning.? Consider this:

This graph shows the excess returns of my industry momentum model over the past twelve years.? Momentum has worked over that time period, but deceasingly so, with a few wipeouts along the way.? Many will remember the worst of them in August 2007, when quantitative investing was decidedly crowded.

Remember, I view investment strategies using an ecological framework.? There are many strategies that work on average, but often many of them are overpursued, and the excess returns have been competed away.? Or, a strategy has been forgotten, relatively speaking, and now it might have some punch.

I am guessing that momentum as a factor is overplayed at present, and it might be wise to leave it to the side until the next wipeout.? If that were to apply in the present market, it would mean the failure of the more stable parts of the market to retain value: consumer staples, utilities, health care, other cash flow spinning industries.

There are two ways that could happen: 1) a resurgence of the cyclicals, and 2) market collapse, where investors give up on all stocks, even stable ones.? I’m not going to bet on either of those, but either is possible in this environment.? If demand begins to rise in the world due to falling commodity prices, #1 is possible, and #2 would come from a continuing collapse in consumer demand.

Food for thought in this ugly environment. Invest carefully, the need for a margin of safety is more critical than ever.

Hidden Credit Risk in Currency Funds

Hidden Credit Risk in Currency Funds

With more than a hat tip, but a full bow to my reader Eric, I present a recent comment of his:

Eric Says: Regarding your existing portfolio, you?ve sometimes held FXF and other Proshares Currency funds. Based on the following excerpt, does it seem to you that these funds are too dependent upon the solvency of JP Morgan?

?The Trust has no proprietary rights in or to any specific Swiss Francs held by the Depository and will be an unsecured creditor of the Depository with respect to the Swiss Francs held in the Deposit Accounts in the event of the insolvency of the Depository or the U.S. bank of which it is a branch. In the event the Depository or the U.S. bank of which it is a branch becomes insolvent, the Depository?s assets might not be adequate to satisfy a claim by the Trust or any Authorized Participant for the amount of Swiss Francs deposited by the Trust or the Authorized Participant, in such event, the Trust and any Authorized Participant will generally have no right in or to assets other than those of the Depository. In the case of insolvency of the Depository or JPMorgan Chase Bank, N.A., the U.S. bank of which the Depository is a branch, a liquidator may seek to freeze access to the Swiss Francs held in all accounts by the Depository, including the Deposit Accounts. The Trust and the Authorized Participants could incur expenses and delays in connection with asserting their claims. These problems would be exacerbated by the reality that the Deposit Accounts will not be held in the U.S. but instead will be held at the London branch of a U.S. national bank, where it will be subject to English insolvency law. Further, under U.S. law, in the case of the insolvency of JPMorgan Chase Bank, N.A., the claims of creditors in respect of accounts (such as the Trust?s Deposit Accounts) that are maintained with an overseas branch of JPMorgan Chase Bank, N.A. will be subordinate to claims of creditors in respect of accounts maintained with JPMorgan Chase Bank, N.A. in the U.S., greatly increasing the risk that the Trust and the Trust?s beneficiaries would suffer a loss.?

I have written about credit risk of ETNs before, but now I have to write about credit risks of ETFs. When an investment consists of foreign currency bank deposits of a single bank, there is a concentrated credit risk. In this case, the credit risk is to JP Morgan’s London branch. A default could be messy, with different laws in the UK.

This just highlights the risk involved with esoteric asset classes, where the “cheap” way of getting the exposure comes through credit or derivative agreements.? Be wary as you consider unique ETFs and ETNs; there can be credit risks that you have not considered.

Book Review: The Heretics of Finance

Book Review: The Heretics of Finance

I’m not against technical analysis per se, at least not anymore.? I don’t think I understand it well, but after reading The Heretics of Finance, I’m not sure anyone really does.? Let me explain.

When I wrote for RealMoney, I often thought it was two sites in one.? Technical analysts on one side, and Fundamental analysts on the other.? Little interaction, except to snipe at each other every now and then.? I’m happy to say that I stayed above the fray, because as a corporate bond manager, technical analysis helped me manage market risk better.? I wasn’t sure how to apply it to equities, though, particularly post-decimalization.

I posted something like this three times on RealMoney, and aside from one private response from Helene Meisler, no one ever bit on my questions regarding technical analysis:


David Merkel
The Two Questions on Technical Analysis
2/22/2008 12:15 AM EST

I received some e-mails from readers asking me to post the questions that I mentioned in the CC after the close of business yesterday. Again, I’m not trying to start an argument between fundies and techies. I just want to hear the opinions of the technicians. Anyway, here goes:

1) Is there one overarching theory of technical analysis that all of the popular methods are applications of, or are there many differing forms of technical analysis that compete against each other for validity (and hopefully, profits)? If there is one overarching method, who has expressed it best? (What book do I buy to learn the theory?)

2) In quantitative investing circles, it is well known (and Eddy has written about it recently for us) that momentum works in the short run, and is often one of the most powerful return anomalies in the market. Is being a good technician just another way of trying to decide when to jump onto assets with positive price momentum for short periods of time? Can I equate technical analysis with buying momentum?

To any of you that answer, I thank you. If we get enough answers, maybe the editors will want to do a 360.

Position: none

That’s where I’m coming from.? In The Heretics of Finance, I received half an answer to my first question, and no answer to my second question.? Now, I enjoyed the book a great deal; it is well-designed.? The book begins by interviewing thirteen well-known technical analysts:

  1. Ralph J. Acampora
  2. Laszlo Birinyi
  3. Walter Deemer
  4. Paul Desmond
  5. Gail Dudack
  6. Robert J. Farrell
  7. Ian McAvity
  8. John Murphy
  9. Robert Prechter
  10. Linda Raschke
  11. Alan R. Shaw
  12. Anthony Tabell
  13. Stan Weinstein

Each chapter asks them a bevy of similar questions.? As I read the first thirteen chapters, my growing conclusion was many of them all do different things, but they all call what they do technical analysis.? I did get a half answer to my first question, in that many of them pointed to the books, Technical Analysis of Stock Trends, 8th Edition, and Technical Analysis of the Financial Markets: A Comprehensive Guide to Trading Methods and Applications (New York Institute of Finance) to a lesser extent, as definitive (and large) reference books on TA that give what they think is the overarching theory.? So, maybe I have an answer to my first question, but I’ll have to buy the books to understand it.

The next seven chapters ask all of the interviewees the same questions, allowing them to agree or disagree with each other.? The questions were asked to each person separately, in interviews from 2004-2005.? It would have been more interesting to have them all in one room, so that they could debate more, and question each other.

That said, many of the questions were interesting:

  • Does lack of academic support bother you?
  • Can TA be learned from books, or only through experience?
  • Are there universally valid TA rules?
  • Is it an art or a science?
  • How big of a role does luck play?
  • Do those that incorporate astrology into TA harm the discipline?
  • How much can TA be mechanized?

In the introduction, the authors, Lo and Hasanhodzic saw increasing acceptance of TA by academics, sometimes directly (challenging the weak form of the efficient markets hypothesis), or via behavioral finance (how value investors do TA).

There was no answer to my second question, as to whether TA is just a way of implementing a momentum strategy.? Surprising to me, Lo and Hasanhodzic did not think to ask the question.? (My opinion: aside from a few technicians that like to try turning points, yes, TA is a way to implement momentum investing.)

Who Would Benefit from this Book

If you want a taste of a wide number of accomplished technicians, this book will give you that.? It wilol also give you jumping-off points into TA literature and TA-friendly academic work describing Technical Analysis.? If you are into some of the main characters in TA, this tells their stories, and elucidates the attitudes of disciplined appliers of TA.

You can buy it here:The Heretics of Finance: Conversations with the Leading Practitioners of Technical Analysis.

PS — Not many book reviewers read the books that they review.? They read the summary that the PR flacks send, and rely heavily on that.? I throw away those summaries, and read the books.? That takes time, but I like reading books, and when I wrote for RealMoney, I often missed reading books.? Now I read them more, and you can benefit from that, because I don’t always endorse the books that I review.

I don’t have a tip jar, but if you buy anything through Amazon, after entering through a link on my site, I get a small commission, and your costs don’t go up.? I like taking? the fees out of Amazon, and not out of my readers.

Reverse Engineering the Rating Agencies

Reverse Engineering the Rating Agencies

I get odd quant projects.? Calculate the value of an odd CDO.? One of the subprojects involved in that required me to reverse engineer the senior unsecured corporate credit ratings of the rating agencies.? My parsimonious model explained roughly 2/3rds of the variation in ratings. What were my factors?

  • Market capitalization
  • Bond sector (Financial, Industrial, Utility, Cyclical)
  • Equity implied volatility
  • Past total returns, which were significant last year, and not this year.

Note the absence of obvious fundamental factors.? I tried a bunch of factors, but none proved consistently significant.

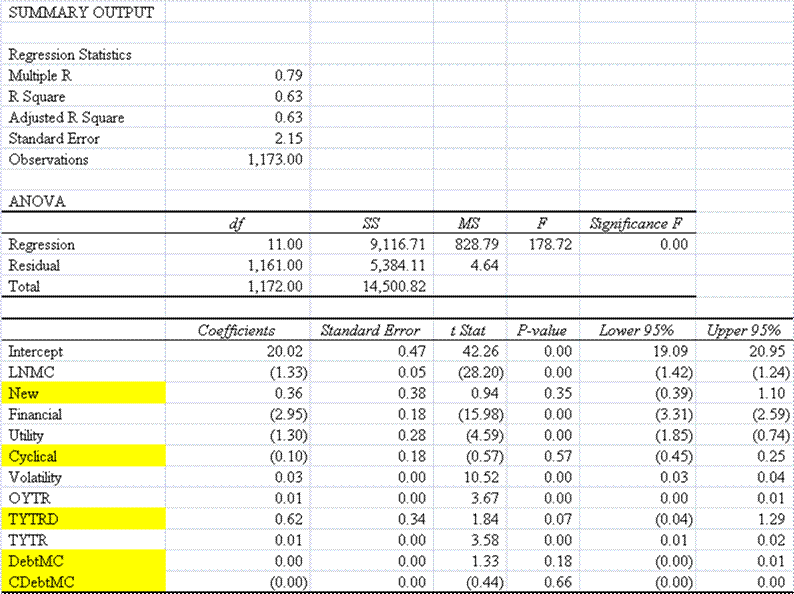
My regression coefficients were very similar in 2007 and 2008.? I think the model is fairly stable.

Given the fundamental models used by the rating agencies for their ratings, this may mean that the markets reflect the analyses of the rating agencies.

For the average investor, this simply indicates that the values that the markets calculate in the short run are largely consistent with more complex fundamental models on average in this case.

-=-=-=-=-=-=-==–=-=–==-=-

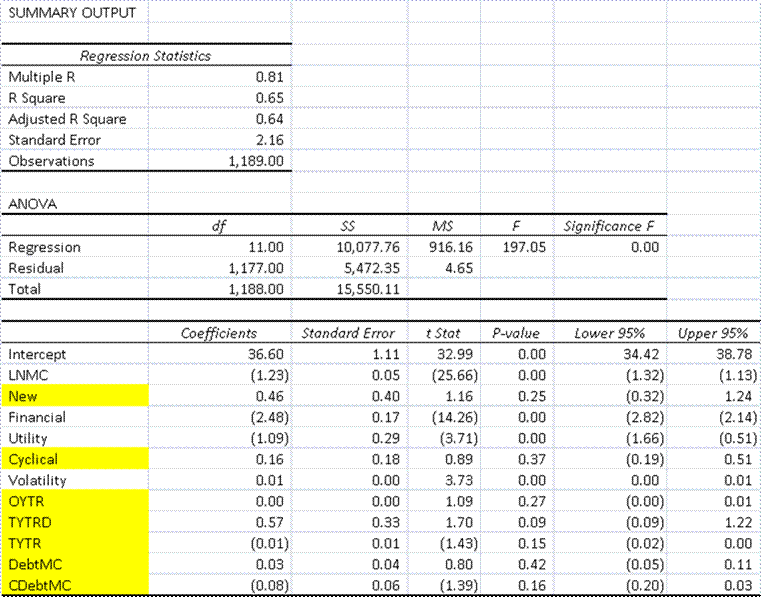
For those that understand Regression, here is the output of the main model at the 2008 year end:

And here is the same output of the main model at the 2007 year end:

output of the main model at the 2008 year end:

Here are the variable definitions:

  • LNMC — natural logarithm of the market capitalization
  • New — Less than one year old
  • Financial, Utility, Cyclical — If not a Industrial firm, which is the default, what is the difference in credit quality?
  • Volatility — 90-day implied volatility
  • OYTR — one-year total return
  • TYTR — three year total return
  • TYTRD — has the firm been around for three years?
  • DebtMC — Debt/Market Capitalization
  • CDebtMC — Change in Debt/Market Capitalization over the past two years

The dependent variable grades from 1 for a AAA company to a 22 if it is in default.

Industry Ranks for January

Industry Ranks for January

I’m gearing up for the next change in my portfolio, but unlike prior reshapings, I am putting out my industry ranks first.? As I have mentioned before, the rankings can be used in value mode (green) or momentum mode (red).? That reflects two different philosophies on investment turnover and time horizons.

I am still negative on the banks, and think the present relative strength will reverse.? The same for housing-related industries… there is more weakness to come.

For those playing momentum, with a few exceptions, the industries in the red zone are industries with stable cash flows.? That is another sign of risk aversion in the present environment.

I will be putting out my replacement candidates later this week; at present, I’m not sure what way my portfolio will move.? These are unusual times, and I am focused on survivability, and after that, cheapness.? Safe and cheap, with the accent on safe.

Financial History is Valuable

Financial History is Valuable

I’ve said it before, but I came into the investment business through the back door as a risk manager.? Unlike most quantitative analysts, I came with a greater depth of knowledge of economic history, and a distrust of the assumptions behind most quantitative finance models, because things can be much more volatile than most current market participants can imagine. As a result, I often ran my models at higher stress test levels than required by regulation or standards of practice.

Can countries fail?? Sure.? It has happened before.? Can leading countries fail?? Yes, and consider France, Germany and Japan.? Consider earlier history — the failure of a major power has significant effects on the rest of the world.

Understanding economic history can keep one from saying, “That can’t happen.”? Indeed when governments are pressed, they do their best to extract additional revenue out of those that will complain the least.? Qualitative analyses, if done properly, incorporate a wider amount of variation than the quantitative statistics will reveal in hindsight.? Do you incorporate the idea that all novel securities (new industries) go through a big boom bust cycle?? If so, you would have avoided most of the complex debt securities born in the last ten years, and would have been light on risky debt that was the building blocks for those securities.

Though the job should fall to regulators to bar institutions of trust from investing in novel instruments, and they used to do that, the legal codes and regulators, forgetting history, removed those restrictions, and left many financial institutions to their own wisdom in managing their risks.? Some of those institutions were careful and speculated modestly if at all.? Others went whole hog.

The speculators (not called that at the time) pointed to loss statistics that had been generated during the boom phase of the cycle.? They showed how the junk-rated certificates would even be money good under “stressed” conditions.? All of the way through the boom, they pointed to their backward looking statistics, as leverage levels grew, and underwriting quality fell in hidden ways.

We know how it has ended.? In some cases, even AAA securities will not be money good (i.e., principal and interest will not be repaid in full).? Alas for the poor non-US buyers who sucked down much of the junk securities.

This forgetfulness regarding booms and busts affects societies on a regular basis. It happens everywhere, but the freewheeling nature of the US makes it a model country for this exercise (boom period in parentheses):

  • Residential Housing (2002-6)
  • Commodities (2001-8)
  • Financial Innovation — hedge funds, securitization, credit default swaps (1995?-2007)
  • Cetes (1992-1994)
  • Commercial Real estate (20s, 80s, 2000s)
  • Guaranteed Investment Contracts (1982-1991)
  • Negative convexity trade in residential mortgages (think of Orange County, Askin, Bruntjen) 1990-1993
  • Stocks (20s, mid-to-late 60s “Go-go era,” 1982-1987, 1994-2000, 2003-2007)
  • Energy (1973-82)
  • Developing country lending (late 70s)

This list isn’t exhaustive, but it’s what is easy for me to rattle off now.? Cycles are endemic to human behavior.? Governments and central banks may try to eliminate the negative part of a cycle of cycles, but it is at a price to taxpayers, savers, and increased moral hazard.? Why limit risk when the government has your back?

All that said, relying on historical patterns to recur, or simple generalizations that say that “the current crisis will follow the same track as the Great Depression,” are too facile and subject to abuse.? The fine article by Paul Kedrosky that prompted this piece makes that point. Too often the statistics cited are from small data sets, or unstable distributions generated by processes that are influenced by positive and/or negative feedback effects.

Studying economic history gives us an edge by giving us wisdom to avoid manias, and avoid jumping in too soon during the bust phase.? I’m still not tempted by housing or banks stocks yet.

That’s why I write book reviews on older books dealing with economic history (among others).? As Samuel Clemens said, “History doesn’t repeat itself, but it does rhyme.”? It doesn’t give a simple roadmap to the future, but it does aid in developing scenarios.? As Solomon said in Ecclesiastes 1:9, “That which has been is what will be, That which is done is what will be done, And there is nothing new under the sun.”

I’ll close the article here, but I have an application of this for politicians and regulators that I want to develop in part two.

My Risk Questionnaire

My Risk Questionnaire

One of my readers asked to see my asset allocation questionnaire. Well, here it is:

Risk Questionnaire

How old are you?

When will you need the money at earliest?

When will you need the money at latest?

Most likely, when will you need the money?

Over the most likely horizon, what rate of return do you want to earn on your money, relative to money market rates and yields on high quality long bonds?

As a percentage of your assets, what is the most you could afford to lose over one year?

As a percentage of your assets, what is the most you could afford to lose over five years?

How closely do you want to watch your investments?? (Daily, Monthly, Quarterly, Annually, Never)

=-=-=-=-=-=-=–=-==-=-=-=-=-=–==-=-=-

When I was the investment actuary in the pension division of Provident Mutual, I would run into investment risk analyses that would make my head spin. My main gripes would revolve around the squishy questions that they would ask, many of which had nothing to do with long term investing.

Thus, my questionnaire. Feel free to use/modify it as you like. I have found that it is very good at sniffing out an investor’s real preferences. The last question also helps me understand the nature of the investor, and how much input/output he wants to have.

Risk tolerance is more a question of time horizon and loss averseness than anything else. Bravery and cowardice play a lesser role, if they even have a role.

The Sterility of Stability

The Sterility of Stability

One of the great conceits in investments is trying to earn above average returns with low variability of returns.? Yet, when you consider the Madoff scandal, it is what can attract a lot of money from credulous investors.

One of the glories of a capitalistic economy is that markets are unstable, they adjust to point out what is no longer needed.? Often the adustments occur violently, because businessmen/consumers chase trends, which can lead to bubbles and bubblettes, until the cash flows of the assets cannot bear the interest flows on the debts that have been created to buy the assets.? Attempts to tame this, such as Alan Greenspan’s aggressive provisions of liquidity just build up more debt for an economywide bubble, followed by a depression.? We got the Great Moderation because of trust in the Greenspan Put.? The Fed would only take away the punchbowl for modest amounts of time, so speculation on debt instruments, real estate, financial institutions, etc., could go on to a much greater degree.? Boom phases would be long; bust phases short and low-impact.

There have been problems with lax regulation of bank underwriting, and investment bank leverage, but the key flaw was mismanagement of the money/credit supply.? Had the Fed held credit tighter during the ’90s and 2000s, we would not be here now.? The Fed could have kept the fed funds rate high, rewarding savings, perhaps leading to a lower cuurent account deficit as well.? Debt growth would have slowed, and securitization, which hates having an inverted or flat yield curve, would have slowed as well.? GDP growth would have been slower, but we would not be facing the crisis we have now.

Or consider housing, and how it became overbuilt because of lax loan underwriting, accommodative monetary policy, and a follow-the-leader mania.? Here’s an old CC post from the era:


David Merkel
Pensions, Energy and Housing
8/18/2005 3:32 PM EDT

1) For those with stable businesses that throw off a lot of earnings and cash flow, and want to dodge the tax man, here’s a possible way to do it, courtesy of the Wall Street Journal: start a defined benefit plan. Disadvantages: complex, relatively illiquid and expensive. Advantages: you can sock away a lot, and defer taxes until you begin taking your benefit, possibly (maybe likely) at lower tax rates.

(This message brought to you courtesy of one actuary who won’t benefit from the message itself… but hey, it helps the profession.)

2) Sea changes in the markets rarely take place in a single day or week. Tops, and changes in leadership tend to take place over months, and feel uncertain. Though Jim is pretty certain that it is time to shift out of energy, I am willing to hang on, and get my opportunities to average down if they come at all. My rebalance points are roughly 20% below current prices anyway, so I’d need a real pullback in order to add.

Though there may be temporary inventory gluts, the basic supply/demand story hasn’t changed, and energy stocks still discount oil prices in the 40s, not the 60s.

3) Contrary to what Jim Cramer wrote in his housing piece today, you can lose it all in housing. Granted, it would be unusual to see homeowners in multiple areas in the country lose their shirts all at the same time; that hasn’t happened since the Great Depression, and we all know that the Great Depression can’t recur, right?

Thing is, local hot real estate markets often revert; if the reversion is bad enough, it leads to foreclosures. Think of Houston in the mid-80s, and Southern California in the early 90s. For that matter, think of CBD real estate in the early 90s… not only did that threaten real estate owners, it did in a number of formerly venerable banks and insurance companies.

Real estate is not a one way street, any more than stocks are. We have never financed as much real estate with as little equity as today before. We have not used financing instruments that are as back-end loaded before. Finally, this speculation is being done on a basis where renting is far cheaper than owning, leaving little support for property prices if the incomes of leveraged homeowners can’t be maintained in a recession. (Oh, that’s right. No more recessions; the Fed has cured that.)

Look, I’m not pointing at any immediate demise of housing in the hot markets. I still think that any trouble is a 2006-7 issue. But this is not a stable situation; if you have a large mortgage relative to your income, make sure your employment situation is really stable. If you can make the payment, prices on the secondary market don’t matter. If you can’t… those prices matter a lot.

One more note: an average investor can sell all of his stocks in the next 20 minutes, with little effect on the market. This is true even in a bad market. In a bad real estate market, you can’t sell; buyers are gunshy — it is akin to what I went through as a corporate bond manager in 2002. There are months where there is no liquidity for some bonds at any reasonable price. So it is for houses in some neighborhoods when half a dozen “for sale” signs go up. No one can sell except at fire sale prices.

None

Well, that’s the macroeconomic problem with stability.? When it gets relied on, after a self-reinforcing boom, it goes away.? Trust in stability is dangerous in other contexts, though.? From another CC post:


David Merkel
Oil and Economic Strength (and a Rant on the Sharpe Ratio)
8/31/2005 3:13 PM EDT

I haven’t really talked about the issue of whether high oil prices portend economic strength or weakness for a good reason. No one knows. There are too many moving parts, and separating out the different effects is impossible; opinions here come down to more of one’s personality (optimist/pessimist) or investment positions (stocks/bonds/energy).

Even if someone did tests using Granger-causality, I’d still be suspicious of the result, whichever way it would point, because of the high probability of finding spurious correlations.

And, speaking of spurious correlations, since Charles Norton brought up the Sharpe ratio, I may as well say that it is a bankrupt concept as commonly used by investment consultants. First, variability is not risk. Losing money over your own personal time horizon is risk (which implies that risk varies for each investor). Second, there is not one type of risk, but many risks. Systematic risk may be measurable in hindsight, but never prospectively.

Third, any measure going off historical values is useless for forecasting purposes, because the values aren’t stable over time. When managers get measured in order for clients to make decisions, they are using the figures for forecasting purposes. It is no surprise that they don’t get good results from the exercise.

Why do figures like a Sharpe ratio gets used, then? Because consultants like simple answers that they can give to their clients, even if the answers yield no insight into the future. (It makes the math really simple, and allows a large number of strategies to be rapidly compared. It eliminates real work and thought.) Investment is a far more messy process than a few simple ratios can illustrate, and those that use these ratios get the results that they deserve.

Finally, an aside. Why am I so annoyed by this? Because of money lost by friends and clients who have been led along this path by investment consultants. There is a real cost to bad ideas.

Position: none

And this CC post as well:


David Merkel
Time Series Regression and Correlation (for wonks only)
7/12/2007 3:11 PM EDT

We’ve had a few discussions here recently involving correlation, so I thought I might post something on the topic. First, it is easy to abuse statistics of all sorts. Few on Wall Street really understand the limitations of the techniques; I have seen them abused many times, often to the tune of large losses.

When comparing multiple time series of any sort, the results can vary considerably if you run the calculation daily, weekly, monthly, quarterly, annually, etc. As you use fewer and fewer observations, the parameters calculated will change. The best estimate will be the one using all available observations, that is, assuming that the underlying processes that generated the time series will be the same in the future as in the past.

It gets worse when comparing the changes in time series. Here moving from daily to weekly to monthly (etc.) can make severe differences in the calculations, because two data series can be almost uncorrelated in the short-run, and very correlated in the long run. My “solution” is that you size your time interval to the time interval over which you make decisions. If daily, then daily, annually, then annually. Again, subject to the limitation that that the underlying processes that generated the changes in time series will be the same in the future as in the past.

But often, the results aren’t stable, because there is no real relationship between the time series being compared. High noise, low signal is a constant problem. Humility in financial statistics is required.

As an example, calculations of beta coefficients often vary significantly when the periodicity of the data changes. People think of beta as a constant, but I sure don’t.

For those who want more on this, there are my two articles, “Avoid the Dangers of Data-Mining,” Part 1 and Part 2.

Enough of this. Back to the roaring markets! Haven’t hit the trading collars yet!

Position: none, but intellectually short Modern Portfolio Theory [MPT]

My point is this: investors look for stable relationships that they can rely on.? Those relationships are precious few.? Sharpe ratios aren’t stable; correlation coefficients aren’t stable; return patterns aren’t stable.? They shouldn’t be stable.? They rely on a noisy economy? which is prone to booms and busts, and industries that are prone to booms and busts.? Seeking stable returns is a fool’s errand.? Warren Buffett has said something to the effect of, “I’d rather have a lumpy 15% return, than a smooth 12% return.”? Though we might mark down those percentages today, the idea is correct, so long as the investor’s time horizon is long enough to average out the lumpiness.

So, if we are going to be capitalists, let’s embrace the idea that conditions will be volatile, more volatile on a regular basis, but given the lower debt levels across the economy because of regular shakeouts, no depressions.? But this would imply:

  • Higher savings rates.
  • Greater scrutiny of balance sheets.
  • Aversion to debt, both personally, and in companies for investment.
  • Less overall financial complexity, and a smaller financial sector.
  • Lower P/Es at banks.
  • Even lower P/Es in non-regulated financials.? It’s a violent world.

For further reading:

The Complete Guide To Option Pricing Formulas, and Derivatives, Models on Models (II)

The Complete Guide To Option Pricing Formulas, and Derivatives, Models on Models (II)

One of my commenters wrote in response to my piece Book Reviews: The Complete Guide To Option Pricing Formulas, and Derivatives, Models on Models:

  1. Kurt Osis Says:
    David:

    How can advocate people using these models which clearly don?t work? Estimating volatility is a suckers bet. Even if you could estimate the underlying ?actual? volatility with 100% accuracy there would be sample error in your realized volatility. And of course the volatility isn?t just changing, the fundamentals of the underlying are changing.

    I once heard of a man named Mandelbrot who said volatility was infinite, in which case these sigmas and lemmas are a bit beside the point, no?

Kurt, I’ve met Mandelbrot, and have discussed these issues with him.? The two books that I recommended are also up on those issues.? Implied volatility estimates as applied to option pricing formulas are a fall-out.? No one thinks they are true, but they are a paramater used to keep relationships stable across options of similar expirations.

Intelligent hedgers hedge options with options; they don’t try to apply the theoretical equivalence that lies behind the traditional Black-Scholes formula and do dynamic hedging with the common stock itself.? That is the philosophy behind the books that I reviewed.

I’m on your page, Kurt.? Variance is infinite, and B-S blows up.? But within the options world, there has to be a way of calculating relative value, and these books aid us in that calculation.

If you think I am wrong here, go to your local library, and get these books via Interlibrary loan.? Read them, and you will see that we are all in agreement.

Theme: Overlay by Kaira