Category: Quantitative Methods

The Importance of Your Time Horizon

The Importance of Your Time Horizon

Photo Credit: Dr. Wendy Longo || This horizon is distant...
Photo Credit: Dr. Wendy Longo || This horizon is distant…

I ran across two interesting articles today:

Both articles are exercises in understanding the time horizon over which you invest. ?If you are older, you may not have the time to recover from market shortfalls, so advice to buy dips may sound hollow when you are nearer to drawing on your assets.

Thus the idea that volatility, presumably negative, doesn’t hurt unless you sell. ?Some people don’t have much choice in the matter. ?They have retired, and they have a lump sum of money that they are managing for long-term income. ?No more money is going in, money is only going out. ?What can you do?

You have to plan before volatility strikes. ?My equity only clients had 14% cash before the recent volatility hit. ?Over the past week I opportunistically brought that down to 10% in names that I would like to own even if the “crisis” deepened. ?That flexibility was built into my management. ?(If the market recovers enough, I will rebuild the buffer. ?Around 1300 on the S&P, I would put all cash to work, and move to the alternative portfolio management strategy where I sell the most marginal ideas one at a time to raise cash and reinvest into the best ideas.)

If an older investor would be?hurt by a drawdown in the stock market, he needs to invest less in stocks now, even if that means having a lower income on average over the longer-term. ?With a higher level of bonds in the portfolio, he could more than?proportionately draw down on bonds during a crisis, which would rebalance his portfolio. ?If and when the stock market recovered, for a time, he could draw on has stock positions more than proportionately then. ?That also would rebalance the portfolio.

Again, plans like that need to be made in advance. ?If you have no plans for defense, you will lose most wars.

One more note: often when we talk about time horizon, it sounds like we are talking about a single future point in time. ?When the time for converting assets to cash is far distant, using a single point may be a decent approximation. ?When the time for converting assets to cash is near, it must be viewed as a stream of payments, and whatever scenario testing, (quasi)?Monte Carlo simulations, and sensitivity analyses are done must reflect that.

Many different scenarios may have the same average rate of return, but the ones with early losses and late gains are pure poison to the person trying to manage a lump sum in retirement. ?The same would apply to an early spike in inflation rates followed by deflation.

The time to plan is now for all contingencies, and please realize that this is an art and not a science, so if someone comes to you with glitzy simulation?analyses, ask them to run the following scenarios: run every 30-year period back as far as the data goes. ?If it doesn’t include the Great Depression, it is not realistic enough. ?Run them forwards, backwards, upside-down forwards, and upside-down backwards. ?(For the upside-down scenarios normalize the return levels to the right side up levels.) ?The idea here is to use real volatility levels in the analyses, because reality is almost always more volatile than models using normal distributions. ?History is meaner, much meaner than models, and will likely be meaner in the future… we just don’t know how it will be meaner.

You will then be surprised at how much caution the models will indicate, and hopefully those who can will save more, run safer asset allocations, and plan to withdraw less over time. ?Reality is a lot more stingy than the models of most financial Dr. Feelgoods out there.

One more note: and I know how to model this, but most won’t — in the Great Depression, the returns after 1931 weren’t bad. ?Trouble is, few were able to take advantage of them because they had already drawn down on their investments. ?The many bankruptcies meant there was a smaller market available to invest in, so the dollar-weighted returns in the Great Depression were lower than the buy-and-hold returns. ?They had to be lower, because many people could not hold their investments for the eventual recovery. ?Part of that was margin loans, part of it was liquidating assets to help tide over unemployment.

It would be wonky, but simulation models would have to have an uptick in need for withdrawals at the very time that markets are low. ?That’s not all that much different than some had to do in the recent financial crisis. ?Now, who is willing to throw *that* into financial planning models?

The simple answer is to be more conservative. ?Expect less from your investments, and maybe you will get positive surprises. ?Better that than being negatively surprised when older, when flexibility is limited.

Modeling Financial Liquidity and Solvency

Modeling Financial Liquidity and Solvency

Photo Credit: Jon Gos

Too often in debates regarding the recent financial crisis, the event was regarded as a surprise that no one could have anticipated, conveniently forgetting those who pointed out sloppy banking, lending and borrowing practices in advance of the crisis. ?There is a need for a well-developed model of how a financial crisis works, so that the wrong cures are not applied to the financial system.

All that said, any correct cure will bring about a predictable response from the banks and other lending institutions. ?They will argue that borrower choice is reduced, and that the flow of credit and liquidity to the financial system is also reduced. ?That is not a big problem in the boom?phase of the financial cycle, because those same measures help to avoid a loss of liquidity and credit availability in the bust phase of the cycle. ?Too much liquidity and credit is what fuels eventual financial crises.

To get to a place where we could have a decent model of the state of overall financial credit, we would have to have models that work like this:

  1. The models would have to have both a cash flow and a balance sheet component to them — it’s not enough to look at present measures of creditworthiness only, particularly if loans do not fully amortize debts at the current interest rate. ?Regulatory solvency tests should not automatically assume that borrowers will always be able to refinance.
  2. The models should try to go loan-by-loan, and forecast the ability of each loan to service debts. ?Where updated financial data is available on borrowers, that should be included.
  3. The models should try to forecast the fair market prices of assets/collateral, off of estimated future lending conditions, so that at the end of the loan, estimates can be made as to whether loans would be refinanced, extended, or default.
  4. As asset prices?rise, there has to be a feedback effect into lowered ability to finance new loans, unless purchasing power is increasing as much or more than asset prices. ?It should be assumed that if loans are made at lower underwriting standards than a given threshold, there will be increasing levels of default.
  5. A close eye would have to look for situations where if the property were rented out, it would not earn enough to pay for normalized interest, taxes and maintenance. ?When asset prices are that high, the system is out of whack, and invites future defaults. ?The margin of implied rents over?normalized interest, taxes and maintenance would be the key measure, and the regulators would have to have a function that attributes future losses off of the margin of that calculation.
  6. The cash flows from the loans/mortgages would have to feed through the securitization vehicles, if any, and then to the regulated financial institutions, after which, how they would fund their future liabilities would?have to be estimated.
  7. The models would have to include the repo markets, because when the prices of collateral get too high, runs on the repo market can happen. ?The same applies to portfolio margining agreements for derivatives, futures, and other types of wholesale lending.
  8. There should be scenarios for ordinary recessions. ?There should also be some way of increasing the Ds at that time: death, disability, divorce, disaster, dis-employment, etc. ?They mysteriously?tend to increase in bad economic times.

What a monster. ?I’ve worked with stripped-down versions of this that analyze the Commercial Mortgage Backed Securities [CMBS] market, but the demands of a model like this would be considerable, and probably impossible. ?Getting the data, scrubbing it, running the cash flows, calculating the asset price functions, implied margin on borrowing, etc., would be pretty tough for angels to do, much less mere men.

Thus if I were watching over the banks, I would probably rely on analyzing:

  • what areas of credit have grown the quickest.
  • where have collateral prices risen the fastest.
  • where are underwriting standards declining.
  • what assets are being financed that do not fully amortize, including all repo markets, margin agreements, etc.

The one semi-practical thing i would strip out of this model would be for regulators to score loans using a model like point 5 suggests. ?Even that would be tough, but even getting that approximately right could highlight lending institutions that are taking undue chances with underwriting.

On a slightly different note, I would be skeptical of models that don’t try to at least mimic the approach of a cash flow based model with some adjustments for market-like pricing of collateral and loans. ?The degree of financing long assets with short liabilities is the key aspect of how financial crises develop. ?If models don’t reflect that, they aren’t realistic, and somehow, I expect that non-realistic models of lending risk will eventually be the rule, because it helps financial institutions make loans in the short run. ?After all, it is virtually impossible to fight loosening financial standards piece-by-piece, because the changes seem immaterial, and everyone favors a boom in the short-run. ?So it goes.

Stock Valuations: Micro and Macro

Stock Valuations: Micro and Macro

Photo Credit: winnifredxoxo

From a friend who is a client:

Here are a couple of things I have been pondering.

  • Market capitalization is pretty fictitious. It assumes that all the shares of a company are worth the price at which the last block sold. However, if you tried to sell all of the shares of a large company (hypothetically), the price would drop to almost zero.
  • It seems to me the primary reason the stock market goes up over time is because the money supply increases. To put it another way, if the money supply did not increase the stock market could only increase in value by increasing the % percentage of the money supply spent on stocks, which is obviously limited.

My views here might be somewhat naive. Comments/criticism/feedback welcome.

Dear Friend,

Ben Graham used to talk about the stock market being a cross between a voting machine and a weighing machine. ?On any given day, economic actors vote by buying and selling shares, and in the short run, the?trades happen at the levels dictated by whether the buyers or sellers are?more aggressive. ?That is the voting machine of the market. ?In the short run, values can be pretty senseless if one side or the other decides to be aggressive in their buying or selling.

What arrests the behavior of the voting machine is the weighing machine. ?The price of a stock can’t get too low, or it will get taken over by a competitor, a private equity firm, a conglomerate, etc. ?The price of a stock can’t get too high, or valuation-sensitive investors will sell to buy cheaper shares of firms with better prospects. ?Also, corporate management will begin thinking of how they could buy up other firms, using their stock as a currency.

I’ve written more on this topic at the article?The Stock Price Matters, Regardless. ?Within a certain range, the market capitalization of a company is arbitrary. ?Outside the range?of reasonableness, financial?forces take over to push the valuation to be more in line with the fundamentals of the company.

Macro Stock Market Measures

Every now and then, someone comes along and suggests a new way to value the stock market as a whole. ?I’ve run across the idea that the stock market is driven by the money supply before. ?The last time I saw someone propose that was in the late 1980s. ?I think people were dissuaded from the idea because money supply changes in the short run did not correlate that well with the movements in stock indexes over the next 25 years.

Now, in the long run, most sufficiently broad macroeconomic variables will correlate with levels of?the stock market. ?Buffett likes to cite GDP as his favorite measure. ?It’s hard to imagine how over the long haul the stock market wouldn’t be correlated with GDP growth. ?(Why do I hear someone invoking Kalecki in the background? ?Begone! 😉 )

There are other popular measures that get trotted out as well, like the Q-ratio, which compares the stock market to its replacement cost, or the Shiller Cyclically Adjusted P/E ratio [CAPE]. All of these have their merits, but none of them really capture what drives the markets perfectly. ?After all:, various market players note that the market varies considerably with respect to each measure, and they try to use them to time the market.

The best measure I have run into is a little more complicated, but boils down to estimating the amount that Americans have invested in the stock market as a fraction of their total net worth. ?You can find more on it here. (Credit @Jesse_Livermore) ?Even that can be used to try to time the market, and it is very good, but not perfect.

But in short, the reason why any of the macro measures of the market don’t move in lockstep with the market is that market economies are dynamic. ?For short periods of time, our attention can fixate on one item or group of items. ?In my lifetime, I can think of periods where we focused on:

  • Monetary aggregates
  • Inflation
  • Unemployment
  • Housing prices
  • Commercial Mortgage defaults
  • Japan
  • China
  • High interest rates
  • Low interest rates
  • Bank solvency

Profit margins rise and fall. ?Credit spreads rise and fall. ?Interest rates rise and fall. ?Sectors of the economy go in and out of favor. ?The boom/bust cycle never gets repealed, and economists that think they can do so eventually get embarrassed.

That’s what keeps this game interesting on a macro level. ?You can’t tell what the true limits are for market valuation. ?We can have guesses, but they are subject to considerable error. ?It is best to be conservative in our judgments here, in order to maintain a margin of safety, realizing that we will look a little foolish when the market runs too hot, and when we seem to be catching a falling knife in the bear phase of the market. ?Take that as my best advice on what is otherwise a cloudy topic, and thanks for asking — you made me think.

We Eat Dollar Weighted Returns ? VI

We Eat Dollar Weighted Returns ? VI

Photo Credit: Lynne Hand

One of the constants in investing is that average investors show up late to the party or to the crisis. ?Unlike many gatherings where it may be cool to be fashionably late, in investing it tends to mean you earn less and lose more, which is definitely not cool.

One reason why this happens is that information gets distributed in lumps. ?We don’t notice things in real time, partly because we’re not paying attention to the small changes that are happening. ?But after enough time passes, a few people notice a trend. ?After a while longer, still more people notice the trend, and it might get mentioned in some special purpose publications, blogs, etc. ?More time elapses and it becomes a topic of conversation, and articles make it into the broad financial press. ?The final phase is when?general interest magazines put it onto the cover, and get rich quick articles and books point at how great fortunes have been made, and you can do it too!

That slow dissemination and?gathering of information is paralleled by a similar flow of money, and just as the audience gets wider, the flow of money gets bigger. ?As the flow of money in or out gets bigger, prices tend to overshoot fair value, leaving those who arrived last with subpar returns.

There is another aspect to this, and that stems from the way that people commonly evaluate managers. ?We use past returns as a prologue to what is assumed to be still?greater returns in the future. ?This not only applies to retail investors but also many institutional investors. ?Somme institutional investors will balk at this conclusion, but my experience in talking with institutional investors has been that though they look at many of the right forward looking indicators of manager quality, almost none of them will hire a manager that has the right people, process, etc., and has below average returns relative to peers or indexes. ?(This also happens with hedge funds… there is nothing special in fund analysis there.)

For the retail crowd it is worse, because?most investors look at past returns when evaluating managers. ?Much as Morningstar is trying to do the right thing, and have forward looking analyst ratings (gold, silver, bronze, neutral and negative), yet much of the investing public will not touch a fund unless it has four or five stars from Morningstar, which is a backward looking rating. ?This not only applies to individuals, but also committees that choose funds for defined contribution plans. ?If they don’t choose the funds with four or five stars, they get complaints, or participants don’t use the funds.

Another Exercise in Dollar-Weighted Returns

One of the ways this investing shortfall gets expressed is looking at the difference between time-weighted (buy-and-hold) and dollar-weighted (weighted geometric average/IRR) returns. ?The first reveals what an investor who bought and held from the beginning earned, versus what the average dollar invested earned. ?Since money tends to come after good returns have been achieved, and money tends to leave after bad returns have been realized, the time-weighted returns are typically higher then the dollar-weighted returns. ?Generally, the more volatile the performance of the investment vehicle the larger the difference between time- and dollar-weighted returns gets. ?The greed and fear cycle is bigger when there is more volatility, and people buy and sell at the wrong times to a greater degree.

(An aside: much as some pooh-pooh buy-and-hold investing, it generally beats those who trade. ?There may be intelligent ways to trade, but they are always a minority among market actors.)

HSGFX Dollar Weighted Returns
HSGFX Dollar and Time Weighted Returns

That brings me to tonight’s fund for analysis: Hussman Strategic Growth [HSGFX]. John Hussman, a very bright guy, has been trying to do something very difficult — time the markets. ?The results started out promising, attracting assets in the process, and then didn’t do so well, and assets have slowly left. ?For my calculation this evening, I run the calculation on his fund with the longest track record from inception to 30 June 2014. ?The fund’s fiscal years end on June 30th, and so I assume cash flows occur at mid-year as a simplifying assumption. ?At the end of the scenario, 30 June 2014, I assume that all of the funds remaining get paid out.

To run this calculation, I do what I have always done, gone to the SEC EDGAR website and look at the annual reports, particularly the section called “Statements of Changes in Net Assets.” ?The cash flow for each fiscal year is equal to the?net increase in net assets from capital share transactions plus the net decrease in net assets from distributions to shareholders. ?Once I have?the amount of money moving in or out of the fund in each fiscal year, I can then run an internal rate of return calculation to get the dollar-weighted rate of return.

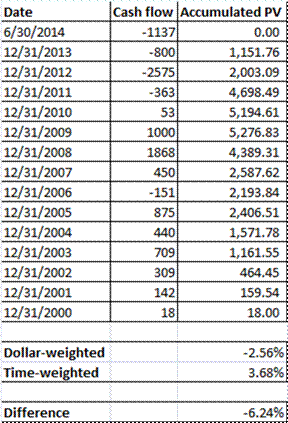
In my table, the cash flows into/(out of) the fund are in millions of dollars, and the column titled Accumulated PV is the?accumulated present value calculated at an annualized rate of -2.56% per year, which is the dollar-weighted rate of return. ?The zero figure at the top shows that a discount rate -2.56% makes the cash inflows and outflows net to zero.

From the beginning of the Annual Report for the fiscal year ended in June 2014, they helpfully provide the buy-and-hold return since inception, which was +3.68%. ?That gives a difference of 6.24% of how much average investors earned less than the buy-and-hold investors. ?This is not meant to be a criticism of Hussman’s performance or methods, but simply a demonstration that a lot of people invested money after the fund’s good years, and then removed money after years of underperformance. ?They timed their investment in a market-timing fund poorly.

Now, Hussman’s fund may do better when the boom/bust cycle turns if his system makes the right move?somewhere near the bottom of the cycle. ?That didn’t happen in 2009, and thus the present state of affairs. ?I am reluctant to criticize, though, because I tried running a strategy like this for some of my own clients and did not do well at it. ?But when I realized that I did not have the personal ability/willingness to?buy when valuations were high even though the model said to do so because of momentum, rather than compound an error, I shut down the product, and refunded some fees.

One thing I can say with reasonable confidence, though: the low returns of the past by themselves are not a reason to not invest in Mr. Hussman’s funds. ?Past returns by themselves tell you almost nothing about future returns. ?The hard questions with a fund like this are: when will the cycle turn from bullish to bearish? ?(So that you can decide how long you are willing to sit on the sidelines), and when the cycle turns from bearish to bullish, will Mr. Hussman make the right decision then?

Those questions are impossible to answer with any precision, but at least those are the right questions to ask. ?What, you’d rather have the answer to a simple question like how did it return?in the past, that has no bearing on how the fund will do in the future? ?Sadly, that is the answer that propels more investment decisions than any other, and it is what leads to bad overall investment returns on average.

PS — In future articles in this irregular series, I will apply this to the Financial Sector Spider [XLF], and perhaps some fund of Kenneth Heebner’s. ?Till then.

Sixteen Implications of “The Phases of an Investment Idea”

Sixteen Implications of “The Phases of an Investment Idea”

Photo Credit: David Warrington

My last post has many implications. I want to make them clear in this post.

  1. When you analyze?a manager, look at the repeatability of his processes. ?It’s possible that you could get “the Big Short” right once, and never have another good investment idea in your life. ?Same for investors who are the clever ones who picked the most recent top or bottom… they are probably one-trick ponies.
  2. When a manager does well and begins to pick up a lot of new client assets, watch for the period where the growth slows to almost zero. ?It is quite possible that some of the great performance during the high growth period stemmed from asset prices rising due to the purchases of the manager himself. ?It might be a good time to exit, or, for shorts to consider the assets with the highest percentage of market cap owned as targets for shorting.
  3. Often when countries open up to foreign investment, valuations are relatively low. ?The initial flood of money in often pushes up valuations, leads to momentum buyers, and a still greater flow of money. ?Eventually an adjustment comes, and shakes out the undisciplined investors. ?But, when you look at the return series analyze potential future investment, ignore the early years — they aren’t representative of the future.
  4. Before an academic paper showing a way to invest that would been clever to use in the past gets published, the excess returns are typically described as coming from valuation, momentum, manager skill, etc. ?After the paper is published, money starts getting applied to the idea, and the strategy will do well initially. ?Again, too much money can get applied to a limited factor (or other) anomaly, because no one knows how far it can get pushed before the market rebels. ?Be careful when you apply the research — if you are late, you could get to hold the bag of overvalued companies. ?Aside for that, don’t assume that performance from the academic paper’s era or the 2-3 years after that will persist. ?Those are almost always the best years for a factor (or other) anomaly strategy.
  5. During a credit boom, almost every new type of fixed income security, dodgy or not, will look like genius by?the early purchasers. ?During a credit bust, it is rare for a new security type to fare well.
  6. Anytime you take a large position in an obscure security, it must jump through extra hoops to assure a margin of safety. ?Don’t assume that merely because you are off the beaten path that you are a clever contrarian, smarter than most.
  7. Always think about the carrying capacity of a strategy when you look at an academic paper. ?It might be clever, but it might not be able to handle a lot of money. ?Examples would include trying to do exactly what Ben Graham did in the early days today, and things like Piotroski’s methods, because typically only a few small and obscure stocks survive the screen.
  8. Also look at how an academic paper models trading and liquidity, if they give it any real thought at all. ?Many papers embed the idea that liquidity is free, and large trades can happen where prices closed previously.
  9. Hedge funds and other manager databases should reflect that some managers have closed their funds, and put them in a separate category, because new money can’t be applied to those funds. ?I.e., there should be “new money allowed” indexes.
  10. Max Heine, who started the Mutual Series funds (now part of Franklin), was a genius when he thought of the strategy 20% distressed investing, 20% arbitrage/event-driven investing and 60% value investing. ?It produced great returns 9 years out of 10. ?but once distressed investing and event-driven because heavily done, the idea lost its punch. ?Michael Price was clever enough to sell the firm to Franklin before that was realized, and thus capitalizing the past track record that would not?do as well in the future.
  11. The same applies to a lot of clever managers. ?They have a very good sense of when their edge is getting dulled by too much competition, and where the future will not be as good as the past. ?If they have the opportunity to sell, they will disproportionately do so then.
  12. Corporate management teams are like rock bands. ?Most of them never have a hit song. ?(For managements, a period where a strategy improves profitability far more than most would have expected.) ?The next-most are one-hit wonders. ?Few have multiple hits, and rare are those that create a culture of hits. ?Applying this to management teams — the problem is if they get multiple bright ideas, or a culture of success, it is often too late to invest, because the valuation multiple adjusts to reflect it. ?Thus, advantages accrue to those who can spot clever managements before the rest of the market. ?More often this happens in dull industries, because no one would think to look there.
  13. It probably doesn’t make sense to run from hot investment idea to hot investment idea as a result of all of this. ?You will end up getting there once the period of genius is over, and valuations have adjusted. ?It might be better to buy the burned out stuff and see if a positive surprise might come. ?(Watch margin of safety…)
  14. Macroeconomics and the effect that it has on investment returns is overanalyzed, though many get the effects wrong anyway. ?Also, when central bankers and politicians take cues from the prices of risky assets, the feedback loop confuses matters considerably. ?if you must pay attention to macro in investing, always ask, “Is it priced in or not? ?How much of it is priced in?”
  15. Most asset allocation work that relies on past returns is easy to do and bogus. ?Good asset allocation is forward-looking and ignores past returns.
  16. Finally, remember that some ideas seem?right by accident — they aren’t actually right. ?Many academic papers don’t get published. ?Many different methods of investing get tried. ?Many managements try new business ideas. ?Those that succeed get air time, whether it was due to intelligence or luck. ?Use your business sense to analyze which it might be, or, if it is a combination.

There’s more that could be said here. ?Just be cautious with new investment strategies, whatever form they may take. ?Make sure that you maintain a margin of safety; you will likely need it.

The Phases of an Investment Idea

The Phases of an Investment Idea

Photo Credit: David Warrington

Investing ideas come in many forms:

  • Factors like Valuation, Sentiment, Momentum, Size, Neglect…
  • New technologies
  • New financing methods and security types
  • Changes in government policies will have effects, cultural change, or other top-down macro ideas
  • New countries to invest in
  • Events where value might be discovered, like recapitalizations, mergers, acquisitions, spinoffs, etc.
  • New asset classes or subclasses
  • Durable competitive advantage of marketing, technology, cultural, or other corporate practices

Now, before an idea is discovered, the economics behind the idea still exist, but the returns happen in a way that no one yet perceives. ?When an idea is discovered, the discovery might be made public early, or the discoverer might keep it to himself until it slowly leaks out.

For an example, think of Ben Graham in the early days. ?He taught openly at Columbia, but few followed his ideas within the investing public because everyone was still shell-shocked from the trauma of the Great Depression. ?As a result, there was a large amount of companies trading for less than the value of their current assets minus their total liabilities.

As Graham gained disciples, both known and unknown, they chipped away at the companies that were so priced, until by the late ’60s there were few opportunities of that sort left. ?Graham had long since retired; Buffett winds up his partnerships, and manages the textile firm he took over as a means of creating a nascent conglomerate.

The returns generated during its era were phenomenal, but for the most part, they were never to be repeated. ?Toward the end of the era, many of the practitioners made their own mistakes as they violated “margin of safety” principles. ?It was a hard way of learning that the vein of financial ore they were mining was finite, and trying to expand to mine a type of “fool’s gold” was not a winning idea.

Value investing principles, rather than dying there, broadened out to consider?other ways that securities could be undervalued, and the analysis process began again.

My main point this evening is this: when a valid new investing idea is discovered, a lot of returns are generated in the initial phase. For the most part they will never be repeated because there will likely never be another time when that investment idea is totally forgotten.

Now think of the technologies that led to the dot-com bubble. ?The idealism, and the “follow the leader” price momentum that it created lasted until enough cash was sucked into unproductive enterprises, where the value was destroyed. ?The current economic value of investment ideas can overshoot or undershoot the fundamental value of the idea, seen in hindsight.

My second point is that often the price performance of an investment idea overshoots. ?Then the cash flows of the assets can’t justify the prices, and the prices fall dramatically, sometimes undershooting. ?It might happen because of expected?demand that does not occur, or too much short-term leverage applied to long-term assets.

Later, when the returns for the investment idea are calculated, how do you characterize the value of the investment idea? ?A new investment factor is discovered:

  1. it earns great returns on a small amount of assets applied to it.
  2. More assets get applied, and more people use the factor.
  3. The factor develops its own price momentum, but few?think about it that way
  4. The factor exceeds the “carrying capacity”?that it should have in the market, overshoots, and burns out or crashes.
  5. It may be downplayed, but it lives on to some degree as an aspect of investing.

On a time-weighted rate of return basis, the factor will show that it had great performance, but a lot of the excess returns will be in the early era where very little money was applied to the factor. ?By the time a lot of money was applied to the factor, the future excess returns were either small or even negative. ?On a dollar-weighted basis, the verdict on the factor might not be so hot.

So, how useful is the time-weighted rate of return series for the factor/idea in question for making judgments about the future? ?Not very useful. ?Dollar weighted? ?Better, but still of limited use, because the discovery era will likely never be repeated.

What should we do then to make decisions about any factor/idea for purposes of future decisions? ?We have to look at the degree to which the factor or idea is presently neglected, and estimate future potential returns if the neglect is eliminated. ?That’s not easy to do, but it will give us a better sense of future potential than looking at historical statistics that bear the marks of an unusual period that is little like the present.

It leaves us with a mess, and few?firm statistics to work from, but it is better to be approximately right and somewhat uncertain, than to be precisely wrong with tidy statistical anomalies bearing the overglorified title “facts.”

That’s all for now. ?As always, be careful with your statistics, and use sound business judgment to analyze their validity in?the present situation.

There’s a Reason for Risk Premiums

There’s a Reason for Risk Premiums

Think
Photo Credit: Jason Devaun

Recently I ran across an academic journal article where they posited one dozen or so risk premiums that were durable, could be taken advantage of in the markets. ?In the past, if you had done so, you could have earned incredible returns.

What were some of the risk premiums? ?I don’t have the article in front of me but I’ll toss out a few.

  • Many were Credit-oriented. ?Lend and make money.
  • Some were volatility-oriented. ?Sell options on high volatility assets and make money.
  • Some were currency-oriented. ?Buy government bonds where they yield more, and short those that yield less.
  • Some had you act like a bank. ?Borrow short, lend long.
  • Some were like value investors. ?Buy cheap assets and hold.
  • Some were akin to arbitrage. ?Take illiquidity risk or deal/credit risk.
  • Others were akin to momentum investing. ?Ride the fastest pony you can find.

After I glanced through the paper, I said a few things to myself:

  • Someone will start a hedge fund off this.
  • Many of these are correlated; with enough leverage behind it, the hedge fund?could leave a very large hole when it blows up.
  • Yes, who wouldn’t want to be a bank without regulations?
  • What an exercise in data-mining and overfitting. ?The data only existed for a short time, and most of these are well-recognized now, but few do all of them, and no one does them all well.
  • Hubris, and not sufficiently skeptical of the limits of quantitative finance.

Risk premiums aren’t free money — eggs from a chicken, a cow to be milked, etc. ?(Even those are not truly free; animals have to be fed and cared for.) ?They exist because there comes a point in each risk cycle when bad investments are revealed to not be “money good,” and even good investments are revealed to be overpriced.

Risk premiums exist to compensate good investors for bearing risk on “money good” investments through the risk cycle, and occasionally taking a loss on an investment that proves to not be “money good.”

(Note: “money good” is a bond market term for a bond that?pays all of its interest and principal. ?Usage: “Is it ‘money good?'” ?”Yes, it is ‘money good.'”)

In general, it is best to take advantage of wide risk premiums during times of panic, if you have the free cash or a strong balance sheet behind you. ?There are a few problems though:

  • Typically, few have free cash at that time, because people make bad investment commitments near the end of booms.
  • Many come late to the party, when risk premiums dwindle, because the past performance looks so good, and they would like some “free money.”

These are the same problems experienced by almost all institutional investors in one form or another. ?What bank wouldn’t want to sell off their highest risk loan book prior to the end of the credit cycle? ?What insurance company wouldn’t want to sell off its junk bonds at that time as well? ?And what lemmings will buy then, and run over the cliff?

This is just a more sophisticated form of market timing. ?Also, like many quantitative studies, I’m not sure it takes into account the market impact of trying to move into and out of the risk premiums, which could be significant, and change the nature of the markets.

One more note: I have seen a number of investment books take these approaches — the track records look phenomenal, but implementation will be more difficult than the books make it out to be. ?Just be wary, as an intelligent businessman should, ask what could go wrong, and how risk could be mitigated, if at all.

From Stream to Shining Stream

From Stream to Shining Stream

Photo Credit: Mark Stevens

There’s one thing that is a misunderstanding about retirement investing. It’s not something that is out-and-out wrong. It’s just not totally right.

Many think the objective is to acquire a huge pile of assets.

Really, that’s half of the battle.

The true battle is this: taking a stream of savings, derived from a stream of income, and turning it into a robust stream of income in retirement.

That takes three elements to achieve: saving, compounding, and distribution.

What’s that, you say? ?That’s no great insight?

Okay, let me go a little deeper then.

Saving is the first skirmish. ?Few people develop a habit of saving when they are relatively young. ?Try to make it as automatic as possible. ?Aim for at least 10% of income, and more if you are doing well, particularly if your income is not stable.

Don’t forget to fund a “buffer fund” of 3-6 months of expenses to be used for only the following:

  • Emergencies
  • Gaining discounts for advance payment (if you know you have future income to replenish it)

The savings and the “buffer fund” provide the ability to enter into the second phase, compounding. ?The buffer fund allows the savings to not be invaded for current use so they can be invested and compound their value into a greater amount.

Now, compounding is trickier than it may seem. ?Assets must be selected that will grow their value including dividend payments over a reasonable time horizon, corresponding to a market cycle or so (4-8 years). ?Growth in value should be in excess of that from expanding stock market multiples or falling interest rates, because you want to compound in the future, and low interest rates and high stock market multiples imply that future compounding opportunities are lower.

Thus, in one sense, you don’t benefit much from a general rise in values from the stock or bond markets. ?The value of your portfolio may have risen, but at the cost of lower future opportunities. ?This is more ironclad in the bond market, where the cash flow streams are fixed. ?With stocks and other risky investments, there may be some ways to do better.

1) With asset allocation, overweight out-of-favor asset classes that offer above average cashflow yields. ?Estimates on these can be found at GMO or Research Affiliates. ?Rebalance into new asset classes when they become cheap.

2) Growth at a reasonable price investing: invest in stocks that offer capital growth opportunities at a inexpensive price and a margin of safety. ?These companies or assets need to have large opportunities in front of them that they can reinvest their free cash flow into. ?This is harder to do than it looks. ?More companies look promising and do not perform well than those that do perform well.

3) Value investing: Find undervalued companies with a margin of safety that have potential to recover when conditions normalize, or find companies that can convert their resources to a better use that have the willingness to do that. ?As your companies do well, reinvest in new possibilities that have better appreciation potential.

4) Distressed investing: in some ways, this can be?market timing, but be willing to take risk when things are at their worst. ?That can mean investing during a credit crisis, or investing in countries where conditions are somewhat ugly at present. ?This applies to risky debt as well as stocks and hybrid instruments. ?The best returns come out of investing near the bottom of a?panic. ?Do your homework carefully here.

5) Avoid losses. ?Remember:

  • Margin of safety. ?Valuable asset well in excess of debts, rule of law, and a bargain price.
  • In dealing with distress, don’t try to time the bottom — maybe use a 200-day moving average rule to limit risk and invest when the worst is truly past.
  • Avoid the areas where the hot money is buying and own assets being acquired by patient investors.

Adjust your portfolio infrequently to harvest things that have achieved their potential and reinvest in promising new?opportunities.

That brings me to the final skirmish, distribution.

Remember when I said:

You don’t benefit much from a general rise in values from the stock or bond markets. ?The value of your portfolio may have risen, but at the cost of lower future opportunities.

That goes double in the distribution phase. The objective is to convert assets into a stream of income. ?If interest rates are low, as they are now, safe income will be low. ?The same applies to stocks (and things like them) trading at high multiples regardless of what dividends they pay.

Don’t look at current income. ?Look instead at the underlying economics of the business, and how it grows value. ?It is far better to have a growing income stream than a high income stream with low growth potential.

Also consider the risks you may face, and how your assets may fare. ?How are you exposed to risk?from:

  • Inflation
  • Deflation and a credit crisis
  • Expropriation
  • Regulatory change
  • Trade wars
  • Etc.

And, as you need, liquidate some of the assets that offer the least future potential for your use. ?In retirement, your buffer might need to be bigger because the lack of wage income takes away a hedge against unexpected expenses.

Conclusion

There are other issues, like taxes, illiquidity, and so forth to consider, but this is the basic idea on how to convert present excess income into a robust income stream in retirement. ?Managing a pile of assets for income to live off of is a challenge, and one that most people?are not geared up for, because poor planning and emotional decisions lead to subpar results.

Be wise and?aim for the best future opportunities with a margin of safety, and let the retirement income take care of itself. ?After all, you can’t rely on the markets or the policymakers to make income opportunities easy. ?Choose wisely.

Advice on Organizing Asset Allocations and Managers

Advice on Organizing Asset Allocations and Managers

Photo Credit: Roscoe Ellis

I was reading an occasional blast email from my friend Tom Brakke, when he mentioned a free publication from Redington, a UK asset management firm that employs actuaries, among others. I was very impressed with what I read in the 32-page publication, and highly recommend it to those who select investment managers or create asset allocations, subject to some caveats that I will list later in this article.

In the UK, actuaries are trained to a higher degree to deal with investments than they are in the US. The Society of Actuaries could learn a lot from the Institute of Actuaries in that regard. As a former Fellow in the Society of Actuaries, I was in the vanguard of those trying to apply actuarial principles to risk management, both when I managed risks for insurance companies, worked for non-insurance organizations, and manage money for upper middle class individuals and small institutions. Redington’s thoughts are very much like mine in most ways. As I see it, the best things about their investment reasoning are:

  • Risk management must be both quantitative and qualitative.
  • Risk is measured relative to client needs and thus the risk of an investment is different for clients with different needs. ?Universal measures of risk like Sharpe ratios, beta and standard deviation of asset returns are generally inferior measures of risk. ?(DM: But they allow the academics to publish! ?That’s why they exist! ?Please fire consultants that use them.)
  • Risk control methods must be?implemented by clients, and not countermanded if they want the risk control to work.
  • Shorting requires greater certainty than going long (DM: or going levered long).
  • Margin of safety is paramount in investing.
  • Risk control is more important when things are going well.
  • It is better to think of alternatives in terms of the specific risks that they pose, and likely future compensation, rather than look at track records.
  • Illiquidity should be taken on with caution, and with more than enough compensation for the loss of flexibility in future asset allocation decisions and cash flow needs.
  • Don’t?merely avoid risk, but take risks where?there is more than fair compensation for the risks undertaken.
  • And more… read the 32-page publication from Redington if you are interested. ?You will have to register for emails if you do so, but they seem to be a classy firm that would honor a future unsubscribe request. ?Me? ?I’m looking forward to the next missive.

Now, here are a few places where I differ with them:

Caveats

  • Aside from pacifying clients with lower volatility, selling puts and setting stop-losses will probably lower returns for investors with long liabilities to fund, who can bear the added volatility. ?Better to try to educate the client that they are likely leaving money on the table. ?(An aside: selling short-duration at-the-money puts makes money on average, and the opposite for buying them. ?Investors with long funding needs could dedicate 1% of their assets to that when the payment to do so is high — it’s another way of profiting from offering insurance in of for a crisis.)
  • Risk parity strategies are overrated (my arguments against it here:?one, two).
  • I think that reducing allocations to risky assets when volatility gets high is the wrong way to do it. ?Once volatility is high, most of the time the disaster has already happened. ?If risky asset valuations show that the market is offering you significant deals, take the deals, even if volatility is high. ?If volatility is high and valuations indicate that your opportunities are average to poor at best, yeah, get out if you can. ?But focus on valuations relative to the risk of significant loss.
  • In general, many of their asset class articles give you a good taste of the issues at hand, but I would have preferred more depth at the cost of a longer publication.

But aside from those caveats, the publication is highly recommended. ?Enjoy!

What do we ‘know’ about investing — but can’t prove with stats?

What do we ‘know’ about investing — but can’t prove with stats?

What do we ?know? about investing ? but can?t prove with stats?

msantoli:

image

The statistical revolutions that have overtaken sports, business and markets have bred suspicion of any observation or assertion not backed up by hard numbers.

This is a good thing in most respects. Yet experts who study these complex realms surely have ideas about how they work based on?

What do we ?know? about investing ? but can?t prove with stats? was originally published on The Aleph Blog

Theme: Overlay by Kaira