Category: Stocks

The Odd Man Out

The Odd Man Out

At present I own a position in the Japan Smaller Capitalization Fund.? One of the things that I talk less about in my investing, is my willingness to allow some professionals closer to the situation manage a small amount of the assets, if they have a good track record, and the area of the global markets is deeply out of favor.? When I do this, it is typically for just one investment, and not more than 5% of the total portfolio.

Japanese small caps?? Definitely out of favor.? When I look at the top ten holdings of the Japan Smaller Capitalization Fund, I can justify holding them on a book value basis, and on an earnings basis, relative to the low interest rates in Japan, they make sense as well.

Now, the fund is trading at a premium to its NAV, so I don’t recommend purchases, at present.? perhaps the ETF SPDR Russell/Nomura Small Cap Japan would be better [JSC].? At a premium of 8% on JOF, I would swap for JSC.? That level would discount the good investing of JOF versus the index of JSC.? Either way, I like Japanese small caps, and I am happy to hold them for a while.

Full disclosure: long JOF

A Comment on SFAS 159

A Comment on SFAS 159

I am ambivalent about fair value accounting standards because they ruin comparability of financial statements across companies.? Recently, SFAS 159 has come into the news because some securities firms used it to book gains because the market value of debt that they issued had fallen.? Four notes:

1) They had no choice, they had to do it.? Their debt has liquid markets — those are level 1 and at worst level 2? liabilities.

2) Many of the assets that they carry have credit risk also.? The pressures that are leading the prices of their debt to fall, are also causing the carrying value of some of their assets to fall as well.

3) If credit markets for their debt improve, they will have to write those liabilities up to higher values.? Even if creditworthiness stays the same, the passage of time will make the liabilities rises in value as they get closer to the ultimate payoff.

4) In bankruptcy, their obligation to pay par does not change.? It is not as if they can pay the reduced market? value to pay off their debt, except through a deal agreed to by the court and plaintiffs.

Look, I don’t like the confusion SFAS 159 creates at this point any more than the next guy, but the gains here will likely reverse over time, absent bankruptcy.? As an analyst, I strip those gains out of income, and I should strip out losses on the asset side that I think will reverse as well.

We can change the way that gains and losses are reported — book, market, model, hybrid… but we can’t change the ultimate cash flows from the business, which is what will ultimately drive the value of the firm.? Be careful and conservative here, as accrual entries get more subjective, they become less trustworthy, and managements on average release more into income from accrual entries than they ought to.

Again, Not Worried About Reinsurance Group of America

Again, Not Worried About Reinsurance Group of America

From the 6/2 RealMoney Columnist Conversation:


David Merkel
Rebalancing Sales, and a Buy
6/2/2008 4:08 PM EDT

Late last week, I had two rebalancing sells, Charlotte Russe and Smithfield. Today, two more, Honda Motor and Nam Tai Electronics. As the market has risen (or, some of my stocks at least), cash has been building up, and I have added some of my own free cash to the Broad Market portfolio. I’m at about 14% cash.

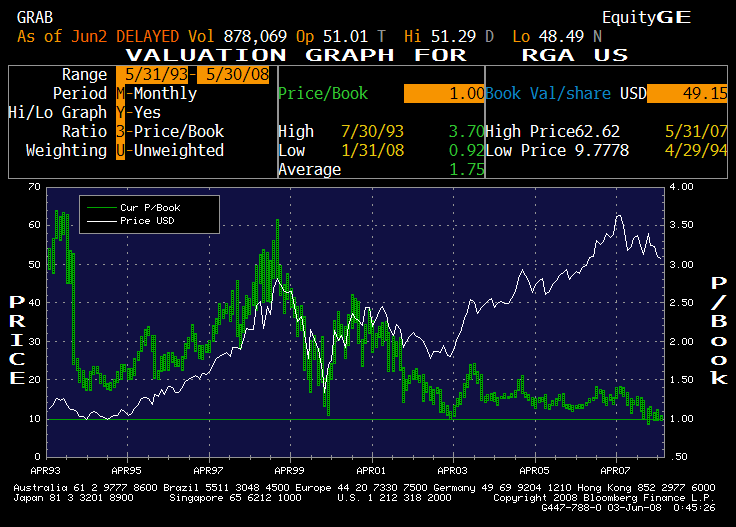
So, it’s time to buy something, though I am waiting on the market to show a little more weakness before I act. But, though dinner may wait, perhaps an appetizer is in order: today I added to my position in Reinsurance Group of America. MetLife finally decides to shed this noncore asset in a tax-free stock swap, allowing current MetLife shareholders to swap their MetLife shares for shares in RGA.

RGA should get a higher multiple as a “pure play” life reinsurer; that will come later. Today was the selling pressure in advance of the new supply. I like the management team at RGA, and think this will allow them the freedom to add value on their own. One other odd kicker… it might allow them to do more reinsurance business with MetLife, because they will be independent and thus truly be a third party.

Position: long CHIC SFD HMC NTE RGA

A few additional notes, for me long only means running with 0-20% cash. I don’t go above 20%; I don’t borrow. Under normal conditions, I like running around 5-7% cash. If the NAHC stake is counted in, (arbitrage gets a pseudo-cash return) then we are at that 20% upper limit.

That leads me to take a few actions — I have bumped up my central band for my holdings by 16%. Translated, the points at which I do buy and sell rebalancing trades has risen 16%, as has my normal position size. Looking back through the years, back to 1992 when I started value investing, my position sizes were 5% of what they are today, and back then I had 10 positions, not 35. There’s been growth. 🙂

My second action was a temporary purchase of some RGA. I doubled my position temporarily, because I think most analysts will smile on the deal, and RGA has always been a good buy at book value.

No telling whether buying at 1.0x book will continue to be a good idea in the future. RGA is a well-run company in an oligopolistic industry. The management is smart and conservative. They have international growth opportunities, and now, possible new business from MetLIfe. The moat is wide here. You can’t reverse engineer the #2 life reinsurer in the US and the World.

So, I’m happy with my position here. That said, I may trade away the speculative part of my holdings in the short run, and I may buy some MetLife as well. MetLife is cheap, though not as cheap as RGA, but I suspect when MetLife offers RGA shares in exchange for MetLife shares, they will have to make the tradeoff sweet in order to get some flexible institutional investors to do the swap. Why? MetLife is a large cap stock that is very diversified. RGA is a midcap that is not as diversified. MetLife is a well-respected brand name. RGA? Who?

Insurance is opaque; reinsurance is doubly so. There are no comparables for RGA. MetLife has Pru, Principal, Lincoln National, and a few more. So, I may speculate on MetLife in order to get some cheap RGA. Most likely, I’ll need to see the terms, but if RGA is up a lot tomorrow, and MetLife is not, I may just do the swap.

Note to my readers: one odd thing about my blog is that I write about a wide number of issues. I know I have been doing more on my stock investing lately, but that is partially due to the lack of news on the macro front. That’s the nature of what I do. I am an investor that pays attention to the global economy. I’m trying to make money off my insights, and not merely report on what is happening. I hope some of it rubs off on my readers also, and that you personally benefit from it. For those who find my blog to be a confusing melange — well, that’s who I am, a generalist whose interests are broad.

But, if you like the individual stock coverage, let me know. If you hate it, let me know also.

Full disclosure: long CHIC SFD HMC NTE RGA NAHC LNC

A Good Month — A Good Year, so far

A Good Month — A Good Year, so far

Of the 35 stocks in my portfolio, only 4 lost money for me in May: Magna International, Group 1 Automotive, Reinsurance Group of America, and Hartford Insurance.? My largest gainer, OfficeMax, paid for all of the losses and then some.

I am only market-weight in energy, so that was not what drove my month.? Almost everything worked in May: company selection, industry selection, etc.? My other big gainers were: Charlotte Russe, Helmerich & Payne, Japan Smaller Capitalization Fund, and Ensco International.? I have often said that I am a singles hitter in investing — this month is a perfect example of that.

Now, looking at the year to date, I am not in double digits yet, but I am getting close — I am only 3.6% below my peak unit value on 7/19/07.? My win/loss ratio is messier: 15 losses against 32 wins.? It takes the top 5 wins to wipe out all of the losses.? The top 5: National Atlantic, Cimarex, Helmerich & Payne, Arkansas Best, and Ensco International.? Energy, Trucking, and a lousy insurance company that undershot late in 2007.

The main losers: Deerfield Triarc (ouch), Valero, Royal Bank of Scotland, Avnet, and Deutsche Bank.

I much prefer talking about my portfolio than individual stock ideas, because I think people are easily misled if you offer a lot of single stock ideas.? I have usually refused to do that here; I am not in the business of touting stocks.? I do like my management methods, though, and I like writing about those ideas.? If I can make my readers to be erudite thinkers about investing; I have done my job.

So, with that, onto the rest of 2007.? I don’t believe in sitting on a lead — I am always trying to do better, so let’s see how I fail or succeed at that in the remainder of 2007.

PS — When I have audited figures, I will be more precise.? You can see my portfolio, for now, at Stockpickr.com.

Full disclosure: long VLO AVT NAHC XEC HP ESV MGA GPI RGA HIG OMX CHIC JOF

Industry Ranks

Industry Ranks

Time for another dose of my industry ranks.? Here’s the list, complete with the ideas that are most attractive for me to investigate:

Remember, this uses the Value Line Industries, and it can be used in Value mode (green industries), or Momo mode (Red industries)? I look to buy from the green list, but I have a tendency to let companies that I own that are on the red list hang around.? Momentum tends to persist in the short run, and I have usually trimmed exposure due to my rebalancing discipline.

My next reshaping is not until early July, but I expect that it will be a doozy, because I will redeploy proceeds from National Atlantic, as well as a new slug of cash that I have received.? I’m running at 12% cash now, but if you count in National Atlantic, it is more like 18%.? That has to come down, so in a month or so, I will have to deploy cash.? I’m looking for a downdraft to do it in, but those don’t always come on schedule.

Full disclosure: long NAHC

A Quick Run Through a few of my Indicators

A Quick Run Through a few of my Indicators

After this article, I plan on doing a run through some longer-dated thoughts of mine — I figure when things are relatively quiet, it is time to start thinking about the bigger picture.

Quiet? Are things quiet now? Well, sorta… we still have problems:

  • We still have an oversupply of houses.
  • Investment banks are still overlevered in their swap books.
  • Commercial property prices are beginning to fall, and that will have negative effects on the equityholders, and those who finance them.
  • Though there is no logical replacement for the US Dollar as the global reserve currency, the US is gaming the system, passing inflation through to the rest of the world. Maybe the world doesn’t need a reserve currency. In any case, there are a lot of annoyed central bankers looking to drop their peg to the US dollar at a convenient time that doesn’t hurt their home economies badly.
  • We are still waiting for the junk issuance from 2004-2006 to start defaulting in size.
  • Our retiree healthcare cost crisis is coming in five years, and will last for two decades.
  • The pension crisis comes in the next 5-10 years, and will last for two decades.
  • Most of the demographic crises will cover the developed world.

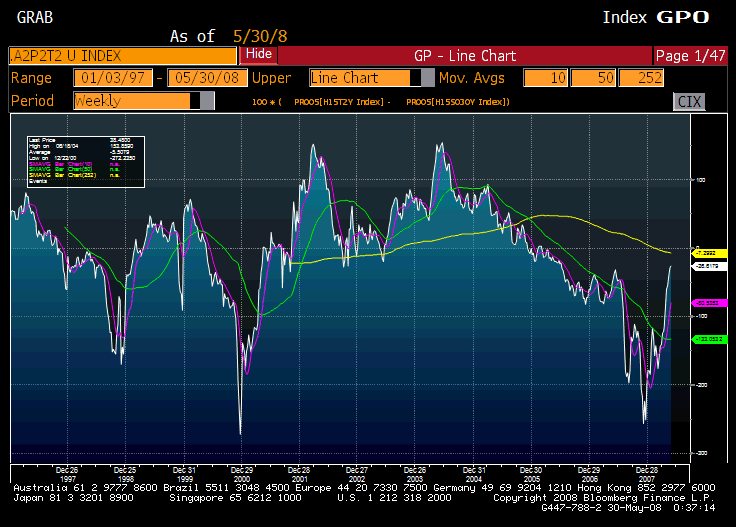
But as for now, the news flow is light, and nothing is presently cratering. Consider the short-term lending markets:

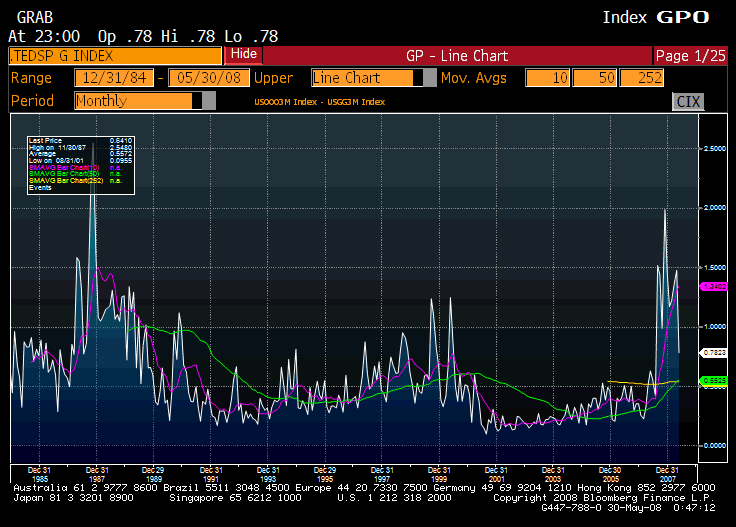
This graph shows the difference between yields on A2/P2 commercial paper and the 2-year Treasury. What this says is that a BBB company can borrow unsecured for a month at 2.7%. Not bad. Now look at the Treasury-Eurodollar [TED] spread:

Things have improved. The TED spread is down to 0.78%. To me, normal is 60 bp or lower. The question still remains as to what happens when the Fed begins withdrawing its new lending facilities.? As it stands now, they seem to be increasing them further.? (I don’t get it.)

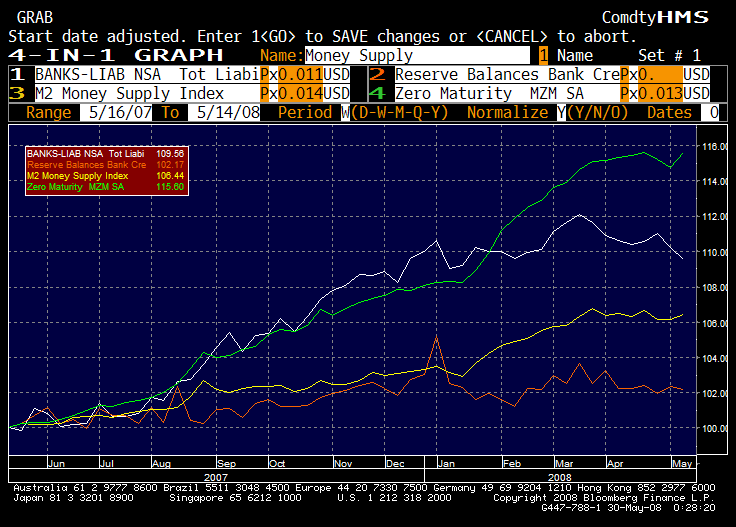
In the midst of this, the Fed has not increased the monetary base in a loosening cycle. The last permanent injection of funds was 5/3/07, long before they started to cut rates. What growth in credit has come from a loosening of the leverage policy toward the banks.

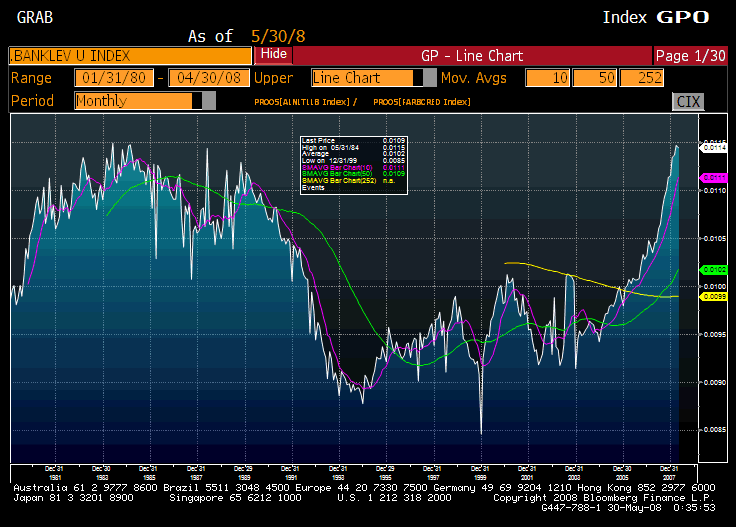
As you can see, we have hit levels of total liabilities of the banking system versus the monetary base of the Federal reserve that we haven’t seen since the early 80s. (I need to multiply that graph by 1000 to show that the multiple is 11x. Oops.)

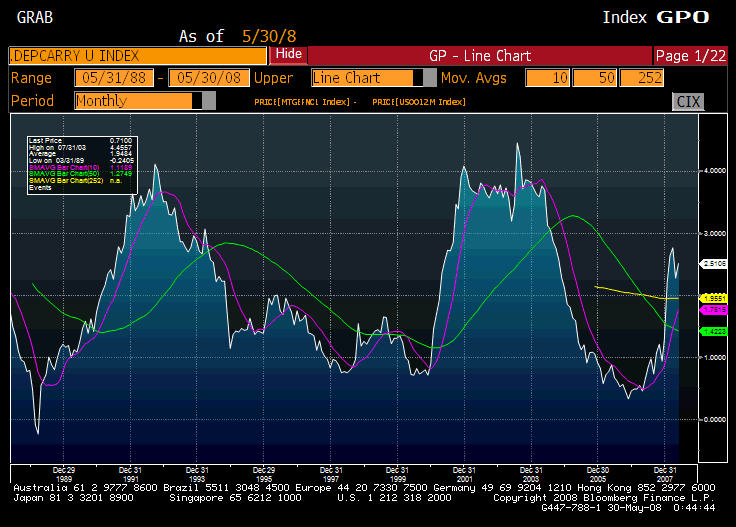
But, my proxy for bank profitability on new money shows that if you can borrow at 12 month US LIBOR, and lend to fund Fannie Mae 30-year mortgage passthroughs, you can make good money now.

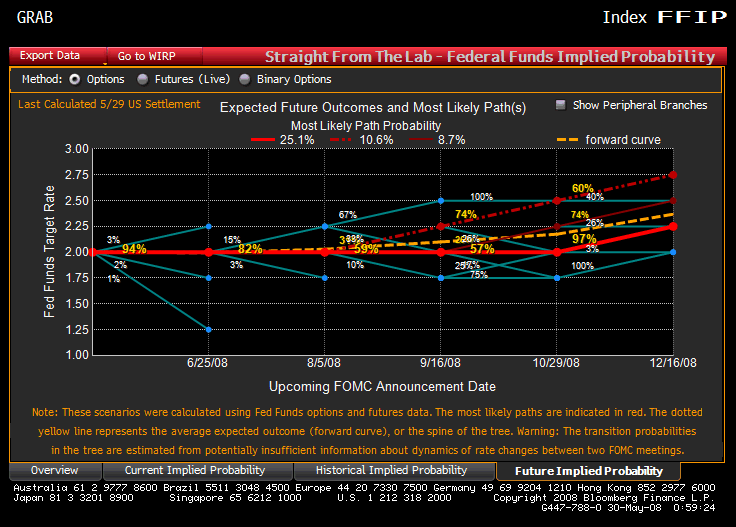
What of Fed funds policy? The market is expecting a 25bp hike in December. I think they are dreaming, but if you are going to bet, you have to know the line.


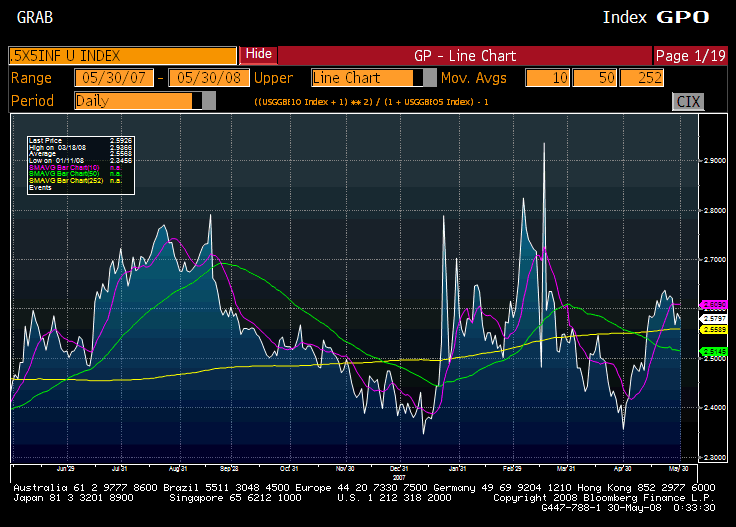
What of inflation expectations? Above is my 5-years forward 5-year inflation graph. The expectations of inflation are low, at least as far as institutional investors are concerned, even as the measure of inflation underlying TIPS rolls ahead at 4% or so.

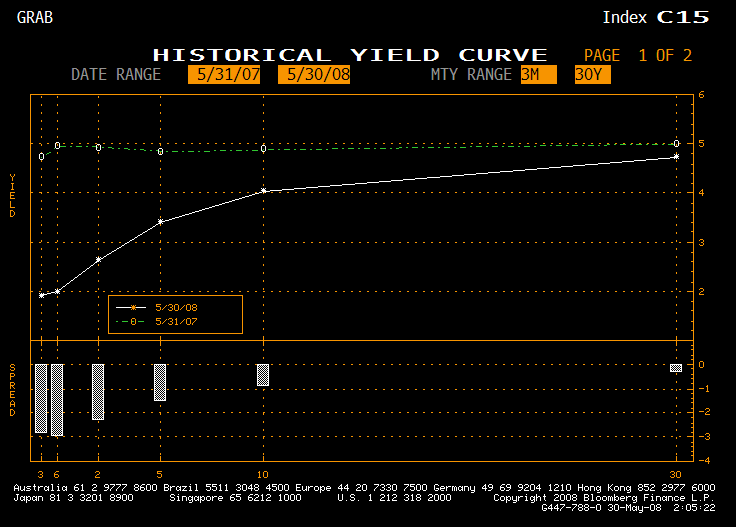
At least the yield curve has resumed a normal shape, as noted before, that will be good for the banks in the long run.

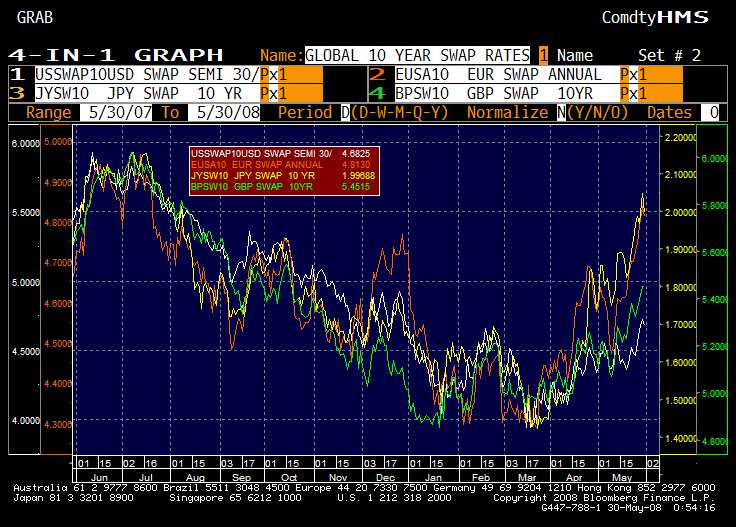
Now, since mid-March, global long rates have bottomed.? I use 10-year swap rates here because they are more comparable than government bond rates.? From my viewpoint, this is due to an increase in expected nominal growth for the Gross World Product.? I can’t tell whether that is coming through inflation or real growth, but I am guessing at mainly inflation.

So, after all of this, where do I stand?

  • We still have problems to work through. (See top list above.)
  • The short term lending markets have largely normalized.? So has the yield curve.
  • The economy may not be in recession.? Then again, it is probably close to the line.
  • Long-term implied inflation measures are quiet amid a jump in global inflation measures.
  • Global long rates are rising.
  • If the banks can lend, they can make decent money on new loans.
  • The Fed is still trying to be “too cute,” solving problems through unorthodox means.? Hey, for now it is good, but who can tell what the long term effects will be.? I am still a skeptic here.? Until they unwind the new lending schemes, and return to a clean balance sheet, the game is not over.
Going BATS over Yahoo Finance

Going BATS over Yahoo Finance

I’ve used Yahoo Finance since 1997, I think.? What a great resource.? Today, they announced the return of free real-time quotes.? Nice, though I went through three phases in my reaction.? The first was, “Yes, the whole real-time market.” The second was, “What, just an ECN?”? The third was, “Okay, they trade 9% of all shares traded… that’s not ideal, but that’s pretty good.”

Now, how could Yahoo improve this?? At present, the ECN real-time quotes are only available on single stock quotes.? Create a view where they can be applied to portfolios, and things gets a lot better.? Let those quotes stream, and you have an amazing service.

Blowing the Bubble Bigger

Blowing the Bubble Bigger

Maybe there is something different about the way that neoclassical economists and historians approach things. I am a bit of a generalist, so I try to look at things from many angles. The two books that I cited in my recent book review on bubbles were written by historians, not economists. Let me cite my summary of Kindleberger’s paradigm:

  • Loose monetary policy
  • People chase the performance of the speculative asset
  • Speculators make fixed commitments buying the speculative asset
  • The speculative asset?s price gets bid up to the point where it costs money to hold the positions
  • A shock hits the system, a default occurs, or monetary policy starts contracting
  • The system unwinds, and the price of the speculative asset falls leading to
  • Insolvencies of those that borrowed to finance the assets
  • A lender of last resort appears to end the cycle

That’s not the way a neoclassical economist views the world. Either men are rational, or, their errors tend to cancel each other out in the short run. Certainly there are never destabilizing feedback loops. Errors on the part of one person don’t lead others to make the same errors.

It is said that neoclassical economics cannot explain the existence of marketing and financial markets, without relaxing their rationality assumptions significantly. As an economist trained in the neoclassical school, I think we forget that these are assumptions that are made in order to get the math to work, not the way things actually work in the world. People are influenced by other people, and they do stupid things as a result, even when there is money on the line. (Maybe, especially when there is money on the line, due to the effects of fear and greed.)

Anyway, when I wrote my last post, I figured that someone would take issue with the concept of bubbles. The commenter raises a few issues, some of which are answered in the article itself.

  • What’s the definition of a bubble? When does something become a bubble?
  • When did housing become a bubble? Who identified it?

Another commenter, more polite, poses these questions:

  • Don’t they effectively borrow to finance the oil futures market?
  • Was the internet a bubble?
  • Isn’t housing unique, in that the speculators can walk away so easily?

In an attempt to answer these questions, “What’s the definition of a bubble? When does something become a bubble? Was the internet a bubble?” consider this piece from RealMoney’s Columnist Conversation:


David Merkel
Bubbling Over
1/21/05 4:38 PM ET
In light of Jim Altucher’s and Cody Willard’s pieces on bubbles, I would like to offer up my own definition of a bubble, for what it is worth.A bubble is a large increase in investment in a new industry that eventually produces a negative internal rate of return for the sector as a whole by the time the new industry hits maturity. By investment I mean the creation of new companies, and new capital-raising by established companies in a new industry.This is a hard calculation to run, with the following problems:

1) Lack of data on private transactions.
2) Lack of divisional data in corporations with multiple divisions.
3) Lack of data on the soft investment done by stakeholders who accept equity in lieu of wages, supplies, rents, etc.
4) Lack of data on corporations as they get dissolved or merged into other operations.
5) Survivorship bias.
6) Benefits to complementary industries can get blurred in a conglomerate. I.e., melding “media content” with “media delivery systems.” Assuming there is any synergy, how does it get divided?

This makes it difficult to come to an answer on “bubbles,” unless the boundaries are well-defined. With the South Sea Bubble, The Great Crash, and the Nikkei in the 90s, we can get a reasonably sharp answer — bubbles. But with industries like railroads, canals, electronics, the Internet it’s harder to come to an answer because it isn’t easy to get the data together. It is also difficult to separate out the benefits between related industries. Even if there has been a bubble, there is still likely to be profitable industries left over after the bubble has popped, but they will be smaller than what the aggregate investment in the industry would have justified.

To give a small example of this, Priceline is a profitable business. But it is worth considerably less today than all the capital that was pumped into it from the public equity markets, not even counting the private capital they employed. This would fit my bubble description well.

Personally, I lean toward the ideas embedded in Manias, Panics, and Crashes by Charles Kindleberger, and Devil take the Hindmost by Edward Chancellor. From that, I would argue that if you see a lot of capital chasing an industry at a price that makes it compelling to start businesses, there is a good probability of it being a bubble. Also, the behavior of people during speculative periods can be another clue.

It leaves me for now on the side that though the Internet boom created some valuable businesses, but in aggregate, the Internet era was a bubble. Most of the benefits seem to have gone to users of the internet, rather than the creators of the internet, which is similar to what happened with the railroads and canals. Users benefited, but builders/operators did not always benefit.

In the internet bubble, there wasn’t that much debt, aside from vendor financing. Some faced the obligations of paying taxes on employee stock options, without having the cash to do so. Others speculated on margin, favoring the long side, of course. The real bubble was the low cost of equity capital, which led to the creation of dubious businesses, and weird stock price movements at IPOs. Say what you want about the present era, the IPO market is relatively calm, and the few deals getting done seem to have some quality.

Regarding the oil futures markets, yes, many participants are levered, but the commodity funds which are huge typically are not. Most of the selling to them comes from the oil companies, which find it profitable to lock in prices at $60, $70, $80…. $130, you get it. In that sense, I don’t think the majority of the activity is coming from levered players that are active investors — the commodity funds are passive hoarders, and the oil companies have a commercial interest.

For another example, consider the silver bubble in the late 70s / early 80s. The Hunt brothers tried to corner the silver market. In the process, the price of silver touched $54/ounce. What stopped them?

  • COMEX limited their ability to hold silver futures.
  • The Fed tightened monetary policy.
  • Silver came from everywhere to meet demand. People sold the family silver, mines that were closed reopened, mines that were marginal began producing like the was no tomorrow.

That last point is why I think it is very hard to corner any commodity, and why bubbles don’t last. Supply overwhelms speculative demand. The speculative demand in this environment is coming from a bunch of nerds who advise pension funds. This isn’t hot money.

This brings me to the last point, regarding housing: “When did housing become a bubble? Who identified it? Isn’t housing unique, in that the speculators can walk away so easily?”

Housing became a bubble when lenders loosened underwriting standards and offered lending terms that were atrocious — what lender in his right mind would ignore equity, recourse, and amortization? Yet in a mania to earn current profits, many lenders did. The bubble started in 2003, and crested in 2005. I posted on this for four years 2003-2007. I posted at RealMoney as it was cresting, with my main article in May 2005, and several more through the remainder of the year.

There were many others who also pointed at the bubble, but as with all bubbles, the naysayers are at the fringe. It can’t be otherwise.

Regarding the ability of the housing speculators to walk away, I like Tanta’s line at Calculated Risk that there aren’t many true walk aways. Most people abandoning their former homes have tried to keep them, and have lost a lot in the process. Away from that, the lenders do screen delinquencies for likely ability to pay. If there are significant assets in a state that allows for recourse, you can bet the lawyers are active.

In closing, I think the concept of a bubble is meaningful. It is a series of two self-reinforcing cycles, one positive, and one negative. These cycles occur because market players chase past performance, suffering from greed as prices rise, and fear as they fall. Any lending to finance the speculation intensifies the size and the speed of the event.

PS — if it helps at all, my equity investing methods borrow from these ideas. I am always trying to analyze industry cycles, to make money and avoid losses. So far it has worked well.

On Industry Selection

On Industry Selection

Recently I received an e-mail:

David,
Always enjoy your blog – very thought provoking, and I’ve learned a lot from reading you across a variety of topics. Assuming I haven’t missed this in an older post… one thing you mention as a key investment strategy is finding the right industry at the right time, and I’ve never seen a very good explanation of how one goes about that. In one of Jim Cramer’s recent books he offered a sort of stylized graph outlining a general playbook to that effect – I’ll send it to you if you’d like – but I’d like to get a primer on how you go about industry over/underweights.

Thanks and Best,
JC

It made me think that I should go through my basic principles of industry selection, and explain them.? JC mentions Cramer’s “playbook” — that’s the classical guide to what industries do best in an “ordinary” business cycle.? Personally, I think Cramer’s views on industry selection are more complex than that, largely for the reason that I don’t follow the “playbook” in any strict sense: global demand is more important than US demand alone for many industries.? The old playbook is no longer valid, until we get a totally integrated world economy.? (Side note: we will never get that — some war will upset the globalization — it is the nature of mankind.)

Anyway, I have four basic tenets when looking at industries:

  • Buy strong companies in weak industries when the industry pricing outlook seems hopeless.
  • Buy moderate to strong companies in strong industries where the earnings power and duration are underestimated.
  • Underweight/Ignore/Short industries where pricing power is likely to be negative for several more years, and especially industries that are in terminal decline.
  • Avoid fad industries.? There are P/E levels that no industry can grow into.

My best example of #1 is the P&C insurance industry in early 2000.? Total gloom.? I bought a lot of The St. Paul then.? Another example: Steel in 2001-2002.? I bought Nucor.

For #2, think of the energy industry — current stock prices embed oil prices far below current levels.? Or, think of the life insurance industry — low P/Es, but the demographic trends are in their favor.

On the third one, think of newspapers, whose richest revenue sources are getting eaten up by the internet.

For the last one, think of the internet/tech bubble 1998-2000.? Very few companies that were hot then are at higher prices now.

I share the results of my industry model once a quarter at minimum.? But I don’t use my model blindly.? For example, lending financials and housing have been cheap for some time, but I have avoided them.? They are cheap for a reason.

My main model uses the Value Line ranking system, and uses the nominal rank, and how it is different from the average historical rank.? It can be used in two ways: highly rated industries can be analyzed to see where the pricing power is not reflected in the stock prices yet.? Low rated industries should be analyzed for the possibility or reversal due to undeserved hopelessness.

But you can create your own model just from a series of index prices.? The idea is to look at industries that either have strong momentum that you think is deserved, or industries with weak momentum where things seem very bad but not terminal.? You can even modify it to look at industries that have bad performance over the past 3-5 years, but have rebounded over the past 6-12 months.

Behind all of that, remember my rule: sharp movements tend to mean-revert, slow, grinding, fitful movements tend to persist.? Things that are too certain tend to disappoint, while those things that are less certain tend to surprise.

One reason I have done well over the past 7+ years is that I have been willing to let my industry selection vary considerably from where the indexes have been.? If you think that you have insight into the longer-term earnings power of industries, then take your opportunity, and deviate from market weightings.

More on AIG

More on AIG

Aside from Abnormal Returns (one of my favorites, good to see him back), my comments on AIG were also cited by Felix Salmon at Market Movers.? I tried to post this comment there, but the software would not let me, and I have no idea why:

Thanks, Felix.? With the Wells Notice served to Hank Greenberg, this chapter of the AIG story is not over yet.

Sometime in the future, I’ll find and post a copy of the memo where Hank Greenberg discovered the massive under-reserving at ALICO Japan, giving his response to the problem… but given the billion dollar hole, it was amazing that AIG did not miss earnings that quarter, because it was much larger than their quarterly earnings.

And some of my insurance analyst friends wonder why I don’t find AIG to be cheap…

But, regarding the recent AIG news flow, my timing is not something that I attribute to skill.? I don’t believe in luck, but that Greenberg would get the Wells Notice so soon, that AIG would indicate willingness to sell off non-core units, or that they would raise significantly more capital than they previously indicated was not something I would have expected would happen the next day.

As I mentioned at RealMoney back when Greenberg left AIG, my experience in my three years inside AIG was that we (the small actuarial unit that I was in in Wilmington, Delaware) found five reserve errors worth more than $100 million, but none of them ever upset AIG’s quarterly earnings.? That is why I remain a skeptic on AIG.

Theme: Overlay by Kaira