Category: Value Investing

Classic: Investing Is About the Whole Portfolio

Classic: Investing Is About the Whole Portfolio

I wrote the following article for RealMoney in August 2005. ?I don’t like handing out individual stock ideas. ?I would rather teach people how to think about stocks and other assets, because my individual ideas will be wrong 30% of the time, and I will garner a lot of complaints from them. ?I will get few thanks from the 70% I got right. ?The ratio corresponds to that which Jesus had healing the lepers.

That said, those that invested in this portfolio for two years did well. ?Okay, read on:

==-=-==-=–=-==-=-=-=-=-=-=-=–=-=-===-=-=-=-=-=-=-

I’m not crazy about giving individual stock ideas on?RealMoney?because all investing is best viewed in a portfolio context. Individual stock ideas are important, but I believe portfolio construction and management are more important.

Too many investors are looking for the next hot company when they should really be looking for a consistent theory of how to produce reliable returns while minimizing downside risk.

In my column?Evolution of an Investment Style, I tried to describe how I achieve above-average returns while trying to squeeze out risk. This is not an easy process, but it is achievable if you think about investing in the same way an intelligent businessman thinks about his own firm.

That’s what my seven rules from that column are all about.

One of the first things you’ll notice is that there doesn’t seem to be any rhyme or reason to the order in which the stocks are listed. There is a logic here, but the order is based on the timing of initial purchases. Stocks that I have held the longest are on top, and stocks that I have bought for the first time most recently are at the bottom.

This helps me see on a day-to-day and week-to-week basis, which group of ideas are doing well. If my newest are doing well, there may be some mean-reversion happening in valuations.

If my oldest are doing well, there may be a bit of momentum happening for those that have already reverted to the mean. Because I tend to make shifts to the portfolio quarterly in groups of four or so stocks, I can see themes working out as I look at performance in the order that stocks were purchased.

The Current Portfolio

Listed below are the stocks in my portfolio. They are roughly equal-weighted.


Value With a Twist
David Merkel’s current holdings
Name Aug. 10 Close P/E Yield Market Cap P/E (This Year) P/B P/S
Cemex (CX:NYSE) 46.94 6.99 2.51 16.80 8.98 1.83 1.45
Dycom (DY:NYSE) 23.50 21.08 1.15 20.98 2.01 1.13
Cytec (CYT:NYSE) 48.25 14.87 0.83 2.22 14.26 1.81 1.18
Ameron (AMN:NYSE) 37.25 21.08 2.14 0.32 10.35 1.14 0.49
Allstate (ALL:NYSE) 58.04 11.62 2.04 38.79 9.33 1.74 1.13
Unilever PLC (UL:NYSE) 41.19 19.40 3.51 66.36 13.18 6.90 1.32
Liz Claiborne (LIZ:NYSE) 41.80 14.18 0.54 4.57 13.71 2.43 0.94
Fresh Del Monte (FDP:NYSE) 25.46 10.80 3.91 1.47 10.97 1.37 0.46
Montpelier (MRH:NYSE) 34.27 11.12 4.08 2.17 7.53 1.49 2.36
PartnerRe (PRE:NYSE) 62.92 7.43 2.26 3.47 8.84 1.00 0.84
ConocoPhillips (COP:NYSE) 65.64 9.66 2.07 91.39 8.42 2.00 0.71
SPX Corp. (SPW:NYSE) 45.36 3.75 2.22 3.41 17.43 1.21 0.76
Canadian National Railway (CNI:NYSE) 67.44 16.43 1.26 18.57 15.36 2.44 3.23
Petro Canada (PCZ:NYSE) 79.42 18.95 0.74 20.83 12.13 2.78 1.67
Stone Energy (SGY:NYSE) 53.71 9.63 1.44 7.86 1.51 2.34
Barclays PLC (BCS:NYSE ADR) 42.39 12.67 4.22 68.39 11.54 2.20 2.85
Valero Energy (VLO:NYSE) 90.77 10.74 0.49 23.30 10.14 2.92 0.37
Toyota (TM:NYSE ADS) 78.42 11.93 1.24 128.10 11.12 1.53 0.75
Sappi (SPP:NYSE ADS) 10.88 51.92 2.78 2.46 90.00 1.13 0.50
Apache (APA:NYSE) 71.93 11.09 0.46 23.61 9.46 2.48 3.60
Premcor (PCO:NYSE) 81.05 9.80 0.08 7.24 9.91 2.75 0.38
Ryerson Tull (RT:NYSE) 19.37 6.05 1.28 0.49 5.13 1.05 0.10
Jones Apparel (JNY:NYSE) 29.03 13.14 1.79 3.44 12.10 1.31 0.70
Neenah Paper (NP:NYSE) 31.45 20.09 0.93 0.46 20.09 2.40 0.63
Johnson Controls (JCI:NYSE) 57.46 12.39 1.70 11.03 12.83 1.91 0.39
Japan Smaller Capitalization Fund (JOF:NYSE) 11.81 5.20 0.19 50.00 0.98 108.19
Pfizer (PFE:NYSE) 26.39 20.04 3.43 196.20 13.39 2.92 3.70
Sara Lee (SLE:NYSE) 20.02 13.31 3.83 15.76 13.51 4.61 0.80
Repsol (REP:NYSE) 29.61 14.95 2.19 36.15 8.98 2.00 0.80
Premium Standard (PORK:Nasdaq) 14.76 6.70 0.41 0.46 9.07 1.10 0.40
Anglo American (AAUK:Nasdaq ADR) 26.72 11.68 2.62 39.62 10.32 1.59 1.53
ABN AMRO (ABN:NYSE) 24.73 11.54 7.52 41.28 10.25 1.78 1.61
Gold Kist (GKIS:Nasdaq) 18.93 8.60 0.97 7.86 2.46 0.90
Dana (DCN:NYSE) 15.01 11.73 3.12 2.26 12.92 0.98 0.24
SABESP (SBS:NYSE) 17.14 8.00 4.52 1.95 10.05 0.54 0.98
11.68 2.04 4.57 10.97 1.81 0.90
Source: David Merkel, Yahoo!


This Portfolio Is Weird

Even though I manage this portfolio the same way that a “long-only” mutual fund manager would, because my portfolio is diversified by country and capitalization, it doesn’t fit any of the neat classifications common to mutual funds. I’m not running a mutual fund for which I’m anxious to gather assets, so this doesn’t bother me. Given that, I will now describe the way the portfolio breaks down by country, capitalization, sector and industry.


Sector Mix
The makeup of this portfolio defies easy categorization
Source: David Merkel

A notable characteristic of the portfolio is that 34% of it is non-U.S. Even adding back the two Bermuda reinsurers (which only trade in the U.S.), the percentage foreign is 29%. This is high enough that it would be hard to call this a domestic fund, but low enough that it can’t be an international or global fund. Why do it this way? Because I believe it offers the best returns to a U.S. investor. I try to buy stocks that operate in stable parts of the world, with reasonable legal systems. I consider information, war and expropriation risks. When something outside the U.S. seems too cheap, I buy it, but I don’t force myself to stay inside or outside of the U.S.

My approach to market capitalization is not as idiosyncratic. I am “all capitalization,” which is done by a number of mutual funds. I am probably more large-cap now than I have been in years. Small-caps generally don’t offer the valuation discount that I like to see when buying something off of the beaten path. Mid-caps I normally like best, because they typically have the stability of large-caps, but still have enough potential to grow, like some small-caps do. At present, many large-caps seem quite cheap, so I have more of them than normal.

The most important thing to look for in market capitalization is rule No. 4 from the column I mentioned above: “Purchase companies appropriately sized to serve their market niches.” Some businesses need scale in order to be profitable. Other businesses favor the entrance of smaller competitors following a niche strategy. “Is the business the right size in order to prosper?” is a question that intelligent investors ask.

Sector/Industry Mix

Looking at both the sector and industry mix, Jim Cramer would probably gong me in his radio show’s “Am I Diversified?” segment. Well, no, I’m not diversified, at least not by sector and industry. I can hear the comments: Where’s the tech and telecom??Pfizer?is not enough for health care. Only one utility, and that one’s in an emerging market? You’re too overweight in materials and energy. Agriculture has been a loser for years. You’re joking, right?

I’ve always run an undiversified portfolio, because intelligent sector rotation can add value. Industries tend to trend in the short run and revert to the mean over the intermediate term. I try to analyze where the pricing power of industries is as I evaluate companies for investment. There are two things that get me primed for purchase:

  • Things are abysmal and no one wants to invest there. (Think of auto parts.)
  • Or, stock prices have not caught up to the industry pricing cycle. (Think of energy.)

That’s how I view it. I want to be in industries that are underrated, whether that’s due to a bruising bear market in an industry, or because of an abundance of skepticism in the face of improving fundamentals.

Valuation Parameters

The summary statistics of my portfolio are shown in the table below.


The Numbers at a Glance
Category Median Value
P/E last year 11.7x
P/E this year 11.0x
P/E next year 10.4x
P/Book 1.8x
P/Sales 0.9x
Yield 2.00%
Range 72%
ROE 18%
Source: David Merkel

You can tell that my portfolio broadly fits into the “traditional value” style. I like my modified form of Graham and Dodd, with tweaks from Marty Whitman and a number of other notable value investors. That said, it’s my unique synthesis, and it has paid off for me in performance. Buying them cheap is critical to both good performance and risk control.

You might adopt my style or you might not; it takes some effort to do well with it. But the important thing is thinking through your portfolio management process to make sure that it’s fundamentally sound, businesslike, intelligently contrarian and something that fits into the way you live your life. Life is broader than investing, and management techniques must be small enough in time use for them to be a part of a broader, well-balanced life. You have my best wishes as you work out your own investment management style.


Full disclosure: still long VLO, IBA, JOF

On Analyzing 13Fs

On Analyzing 13Fs

In the fourth quarter of 2011, I decided that I needed to analyze the 13F filings of major investors who I thought were bright. ?The first stage was looking at track records, and then finding the 13F filings. ?Some investment management companies ?make them difficult to find. ?And, prior to three quarters ago, formatting issues allowed managers to make it a lot more difficult to compare 13F data across managers.

But now data must be submitted in a uniform format, using extensible markup language [XML]. ?That can be fed into Excel with little effort, and much of the prior data scrubbing goes away. ?That data scrubbing took an extra day at least.

That said, the central challenge for someone that does not have a Bloomberg terminal is converting the CUSIP numbers [Committee on Uniform Securities Identification Procedures numbers] into ticker symbols. ?Those numbers are owned by the American Banking Association, and they charge a pretty penny to use them. ?I asked the folks at AAII [American Association of Individual Investors] to include a CUSIP field ?in their deluxe stock screening package, and they said something like, “Are you kidding? ?Do you know what the American Bankers Association charges for it?!”

When I started, I asked my bright, then 12-year old daughter to build up our own CUSIP to Ticker database. ?She worked for many hours, producing a significant database for which I paid her well. ?Since that time, I have maintained that database.

After I download via XML all of the manager reports that I want to follow, I sort out all of the CUSIPs I have never seen before, and find their tickers.

What used to take a week now takes a little more than a day in total, start to finish.

One thing that I do differently than some others in analyzing 13F filings is that I am interested in what percentage of the market capitalization the positions represent, and how large the net increase in positions is relative to market capitalization.

After that I look at three things:

  1. What are the largest holdings as a group as a whole as a percentage of market cap,
  2. What are the largest net increases in holdings as a group as a whole as a percentage of market cap, and
  3. What ideas are new, that no one invested in last quarter, and two or more invested in this quarter?

Now I am not saying that I have the formula right, but this feels right to me. ?I invite readers to suggest their own ways of screening through 13Fs to determine the most worthy investment ideas.

But before I leave for the evening, another boon: here are the tickers generated by my 13F methods this quarter:

AAL, ADT, ALSN, AN, BCS, BIOS, BRX, CAM, CAR, CCI, CLH, COH, CSLT, CSTM, CTRP, CTXS, CYH, DAR, DDC, DSW, DV, DVA, ENDP, ENT, EPE, ESRT, EVTC, FLXN, GHC, GLPI, GME, GS, HMHC, HOLX, HW, IBP, IDIX, JNPR, KATE, KIN, KN, KSU, LNN, LPNT, MDR, MTOR, NADL, NCLH, NMIH, NUAN, PAH, PBF, PHH, PLCM, POST, QEP, QLIK, RCII, RDN, REIS, RFMD, RH, RLD, RPXC, SBAC, SC, SFUN, SNMX, STAY, SWI, SYMC, TDG, TLM, TLMR, TQNT, TRLA, TRW, TWI, USG, VECO, VIPS, VOCS, VOXX, VRTX, WPP, XL, XONE, YRCW, ZINC

After the last few articles, you know almost all of the companies that I am considering investing in versus my current portfolio. ?Have look as you like, and maybe a few of them are good investment ideas.

Playing for Pennies, Risking Dollars

Playing for Pennies, Risking Dollars

I try to avoid investments where the upside is limited, but the downside is unlimited. ?That’s the way I feel about junk bonds now. ?Have junk?yields been lower?before?? No, we have eclipsed the time in 2013 when the junk?market was in a yield frenzy, until Bernanke uttered the word “taper.”

There are a lot of desperate retirees seeking income, assuming it is free, and not merely a return of capital. ?There are a lot of desperate people seeking certainty in investing and do not realize that dividends are a handmaiden of value, and not value itself.

There are a lot of desperate pension plans looking to make up for lost time, and hoping against hope, buying dividend paying and growth stocks, high-yield bonds, alternatives like hedge funds, private equity, etc., at the wrong time.

Those are the things you should buy when stocks are cheap and people are scared to death. ?You sell them when people are confident, and valuations are high.

Valuations are high; not nosebleed high as in 2000, but high as in comparable to the peak in 2007. ?Could things go higher? ?Yes, but you are playing for pennies and risking dollars in the process. ?Those with a value and quality discipline will likely fare better in the process, but markets are messy, and what actually happens will be a surprise.

Thus I would encourage you to consider the credit quality of your stocks and bonds. ?What kind of shock could they withstand? ?When yields?are?low, like they are now, the system is less resilient to credit crises. ?Be aware, and be on your guard.


That Looks Like a Good Idea!

That Looks Like a Good Idea!

Today I start my quarterly analysis of my portfolio. ?I do it once per quarter to take the emotion out of it and make it businesslike.

But in-between analyses, I read. ?I read a lot of stuff, and occasionally I see ideas where I say, “That looks like a good?idea!” ?After that, I record the ticker symbol and throw away the reason why it seemed good.

Why do I do it this way? ?Several reasons:

1) Quick decisions are rarely good ones. ?Lots of people have slick pitches. ?Far better to wait a while, and analyze the opportunity coldly, and compare it against other ideas.

2) If I buy this, what should I sell? ?Not that you have?to sell but it is a good exercise to make you improve the portfolio. ?It might indeed be a good idea, but you may have better ideas still in your current portfolio.

3) I need to analyze all opportunities through the same prism, and I need to understand them myself, not just what someone else told me. ?If I don’t understand why I am buying, I will not understand when to sell.

The truth is, the need for urgency in investing is overrated. ?If an idea is good today, it will likely be good three months from now. ?Few investment ideas move linearly, and many ideas seem to fail before succeeding. ?Most companies that I have averaged down on have proven to be successes.

So take your time, analyze dispassionately, and compare new possibilities versus existing positions. ?And don’t trade much. ?It takes time for most investment these to work out. ?So choose a small number of new ideas to enter your portfolio, while selling a similar number of old ideas.

I don’t normally do this, and I might not do it in the future, but here are the tickers for the companies that looked like a good idea over the last three months:

ABC, ADP, AGN, AGU, ALTV, AMED, AMGN, ANH, APD, BAGL, BAM, BAX, BBBY, BBT, BCR, BCS, BWP, CAM, CAN, CDI, CHL, CHRW, CLR, COH, COP, CTXS, CVU, DDEJF, DDS, DGSE, DLLR, DLR, DRI, EFII, EGAS, EOG, EP, ESRX, FDO, FSYS, FUL, FWM, GCI, GEL, GG, HA, HK, HLF, HRB, ICE, INOD, INVC, JBLU, JSAIY, KM, KMI, KMP, KR, LH, LNCO, LNVGF, LNVGY, LUK, MAT, MCD, MCO, MFA, MGA, MHLD, MOD, MON, MRO, MSG, MU, MUR, NABZY, NBL, NCR, NOG, NOK, NSANY, NSIT, NSRGF, NTE, OGZPY, OPY, ORCL, OXY, OZM, PBI, PCL, PCM, PDCO, PEP, PERY, PLAB, POT, PZE, QBCRF, RAD, RCII, RCKY, REP, ROST, RYN, SAFM, SANM, SE, SLW, SNBC, SNTA, SWM, SYK, TEN, TGT, TSN, TSO, TU, UCFC, UL, UNP, URBN, VE, VOD, WACLY, WHR, WLP, WMB, WMT, WSBC, XEC

As with anything I write, do your own “due diligence.” ?But thanks for reading me. ?I appreciate all of my readers.

Unlikely Bid for Tower Group

Unlikely Bid for Tower Group

Tuesday, a subsidiary of Eurohold Group, Euroins Insurance Group, announced a $3.75 bid for Tower Group. ?I think it is bogus. ?Here’s why:

  • At the price they are paying, they are offering more than their net worth to buy Tower Group $215MM vs $190MM.
  • They would pay a 2x+ premium over book to buy Tower when they trade at ~70% of book.
  • They have no overlapping lines, geographically. ?It would be cheaper for Eurohold to buy a Bermuda shell and poach some talent, if what they want to do is diversify.
  • TWGP isn’t even worth the $2.50 that ACP Re is offering.
  • The language in the “offer” is weaker than that of many “letters of intent” I have read, much less a binding offer.

Now, let me take one step back, and say that the numbers I calculated above derive from documents written in Bulgarian that I have translated mechanically. ?I may have made mistakes.

Also, a fool and his money are soon parted. ?If Eurohold is foolish, a bid could be made where economics doesn’t matter. ?After all of my dealings with foreign insurers, I have seen many ill-thought-out deals.

Kudos to the guy who sold near $3 on Tuesday. ?He got the best outcome out of this sordid mess. ?Opposite for the one that bought.

As for me, I have no position. ?I rarely short, and there is no significant margin of safety in owning TWGP. ?The odds of the operating subsidiaries as a group?having not enough surplus?to exceed?the?relevant company action level risk based capital??for the group as a whole is not high, but is not zero. ?That is the one condition that can break the $2.50 deal with ACP Re.

Now let’s see how the first quarter earnings come in. ?That will say a lot.

As an aside, the bonds of Tower Group offer about as much upside, and less downside than the equity does, if the ACP Re deal is the only real deal.


Illusory Investment Income

Illusory Investment Income

Yield is an illusion, whether it comes from stocks, REITs, preferred stocks, bonds, loans,?limited partnerships, etc. ?Yield from investments is not the same as being a farmer with chickens, where each day you can collect eggs, enjoy or sell them, and your net worth is not affected by harvesting the eggs.

I say this because one has to consider the enterprise paying the dividends, interest, or distributions. ?What are the odds that the enterprise might have to scale back or eliminate dividends or distributions? ?What are the odds that the enterprise might default on interest payments?

I have said it, and I will say it again: focus on the health and growth of the enterprises, and not on the dividends (and buybacks). ?The ’70s had many people buying stocks with high yields, dividends often exceeding what earnings could deliver.

Some naively say, “Dividends don’t lie.” ?Well yes, the money you receive is yours, but is the company as healthy after the dividend? ?Will they be able to keep it up? ?Often that is not the case.

In an era of financial repression, where the Fed punishes savers who deserve a better return, many reach to try to get a higher income off of investments. ?In the process they end up taking a lot of risk that their income streams will be cut through dividend decreases, and outright defaults on interest payments.

Income payments rely on the health of the entities making payments. ?This means that an intelligent income investor acts like a value investor, and looks for overall prosperity of the enterprise as security for the payments and growth in payments he would like to receive.

Now dividends and stock buybacks do signal the willingness of management to hand assets back to shareholders and maximize short-term returns to shareholders. ?Even debt finance, with an unwillingness to issue more equity is usually a sign of a management team that is shareholder oriented. ?But both of these findings rely on the idea that the management team has not overextended itself, such that they risk insolvency,?cutting the dividend, or reducing the buyback.

Broader investment variables to indicate growth in the value of the enterprise have more punch than the shareholder income measures. ?Look at earnings, book value, growth in book value, cash flow from operations, and free cash flow?instead. ?And with industrials, sales per share is often the best indicator, particularly in a market like the present one where sales growth is anemic.

Okay, look at the shareholder income-based measures if you must, but analyze:

  • The payout ratio — are they paying out more to shareholders than they are earning? ?What if earnings decline? ?Will they maintain the payouts?
  • Times interest earned — how secure are the interest payments relative to earnings?
  • How likely are they to safely raise the payouts to equity? ?Growth in dividends is often more important the the level of dividends. ?The best performing REITs have had lower payouts that grew more rapidly.

Guard the return of your money, rather than seek a high return on your money. ?When the ?credit cycle turns negative, and it will turn negative, it always does, management teams that have been too aggressive will get punished. ?Try to avoid the punishment.

I write this as an equity manager that has an above average yield on investments, but the yield stems from low price-to-earnings, -sales, -cash flow, -free cash flow and -book. ?15% of my companies don’t pay a dividend, and I don’t care. ?If the management teams have good places to reinvest money to grow value, that is the best place of all to be. ?Buffett loves investing excess cash if he can find highly productive places to do so.

With all that said, analyze companies for growth in value, safety, and prudent use of free cash flow. ?If income is a part of capital discipline, well good, but be aware of the risks in an adverse economic scenario. ?When the tide goes out, we find out who has been swimming naked.


Industry Ranks May 2014

Industry Ranks May 2014

Industry Ranks 6_1521_image002

My main industry model is illustrated in the graphic. Green industries are cold. Red industries are hot. If you like to play momentum, look at the red zone, and ask the question, ?Where are trends under-discounted?? Price momentum tends to persist, but look for areas where it might be even better in the near term.

If you are a value player, look at the green zone, and ask where trends are over-discounted. Yes, things are bad, but are they all that bad? Perhaps the is room for mean reversion.

My candidates from both categories are in the column labeled ?Dig through.?

You might notice that I have no industries from the red zone. That is because the market is so high. I only want to play in cold industries. They won?t get so badly hit in a decline, and they might have some positive surprises.

If you use any of this, choose what you use off of your own trading style. If you trade frequently, stay in the red zone. Trading infrequently, play in the green zone ? don?t look for momentum, look for mean reversion. I generally play in the green zone because I hold stocks for 3 years on average.

Whatever you do, be consistent in your methods regarding momentum/mean-reversion, and only change methods if your current method is working well.

Huh? Why change if things are working well? I?m not saying to change if things are working well. I?m saying don?t change if things are working badly. Price momentum and mean-reversion are cyclical, and we tend to make changes at the worst possible moments, just before the pattern changes. Maximum pain drives changes for most people, which is why average investors don?t make much money.

Maximum pleasure when things are going right leaves investors fat, dumb, and happy ? no one thinks of changing then. This is why a disciplined approach that forces changes on a portfolio is useful, as I do 3-4 times a year. It forces me to be bloodless and sell stocks with less potential for those with more potential over the next 1-5 years.

I like some technology stocks here, some industrials, some retail?stocks, particularly those that are strongly capitalized.

I?m looking for undervalued industries. I?m not saying that there is always a bull market out there, and I will find it for you. But there are places that are relatively better, and I have done relatively well in finding them.

At present, I am trying to be defensive. I don?t have a lot of faith in the market as a whole, so I am biased toward the green zone, looking for mean-reversion, rather than momentum persisting. The red zone is pretty cyclical at present. I will be very happy hanging out in dull stocks for a while.

That said, some dull companies are fetching some pricey valuations these days, particularly those with above average dividends. This is an overbought area of the market, and it is just a matter of time before the flight to relative safety reverses.

The Red Zone has a Lot of Financials; be wary of those. I have been paring back my reinsurers, but I have been adding to P&C insurers. What I find fascinating about the red momentum zone now, is that it is loaded with cyclical companies.

In the green zone, I picked almost all of the industries. If the companies are sufficiently well-capitalized, and the valuation is low, it can still be an rewarding place to do due diligence.

Will cyclical companies continue to do well? Will the economy continue to limp along, or might it be better or worse?

But what would the model suggest?

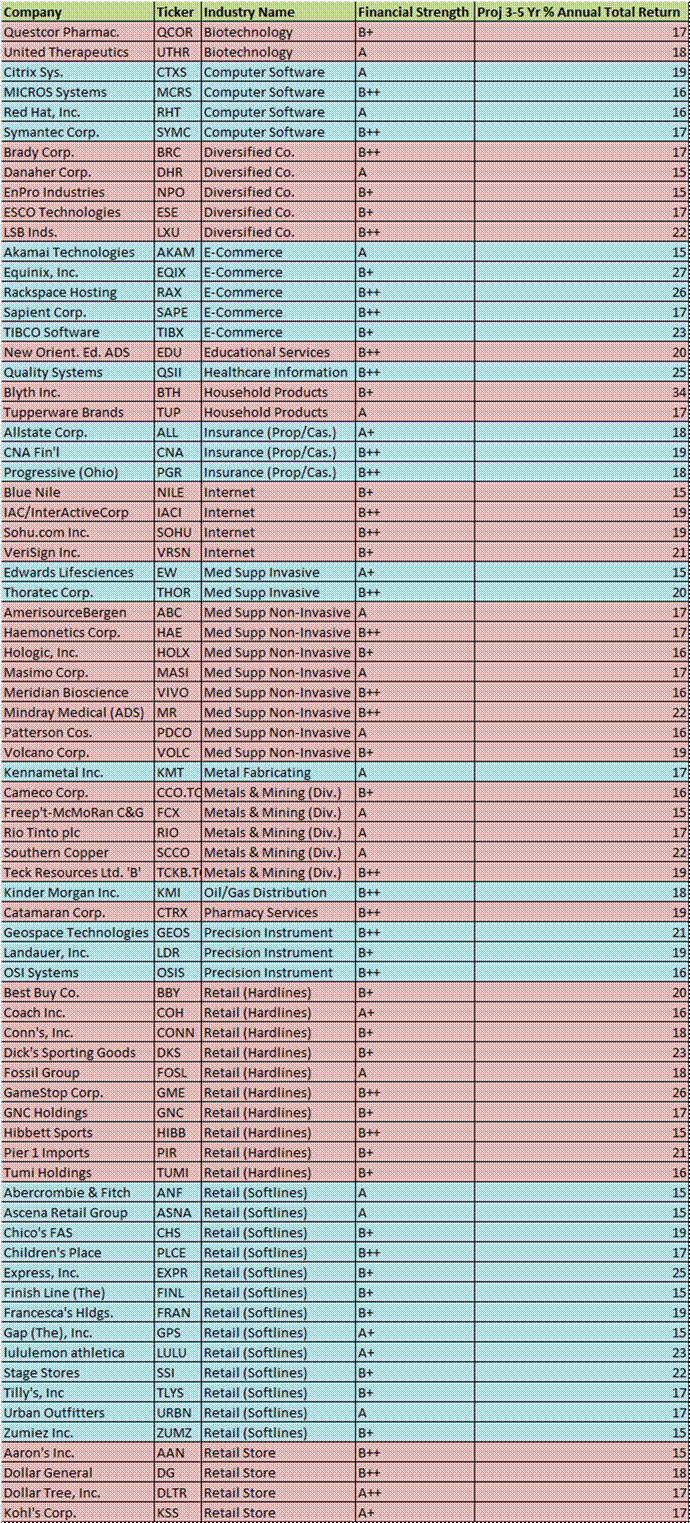
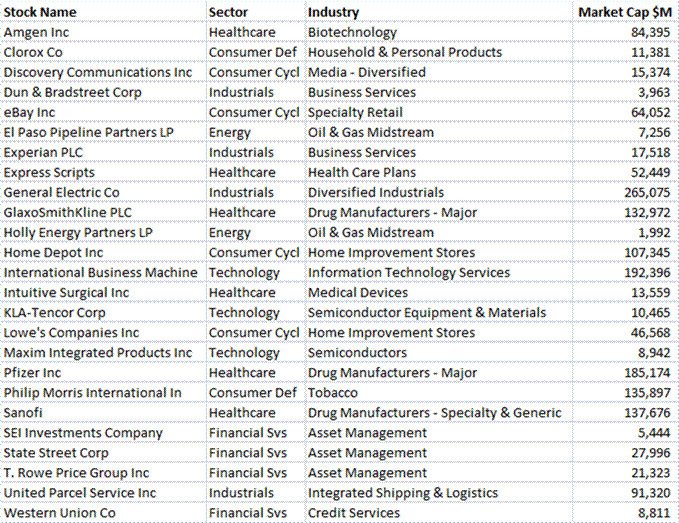
Ah, there I have something for you, and so long as Value Line does not object, I will provide that for you. I looked for companies in the industries listed, but in the top 5 of 9 balance sheet safety categories, and with returns estimated over 12%/year over the next 3-5 years. The latter category does the value/growth tradeoff automatically. I don?t care if returns come from mean reversion or growth.

But anyway, as a bonus here are the names that are candidates for purchase given this screen. Remember, this is a launching pad for due diligence, not hot names to buy.

I’ve tightened my criteria a little because the number of stocks passing last quarter’s screen was much higher, which was likely an artifact of earnings expectations rolling forward another year.

Anyway, enjoy the list of purchase candidates — I know that I will:

Industry Ranks 6_19997_image002

Full Disclosure: long SYMC

Book Review: The 52-Week Low Formula

Book Review: The 52-Week Low Formula

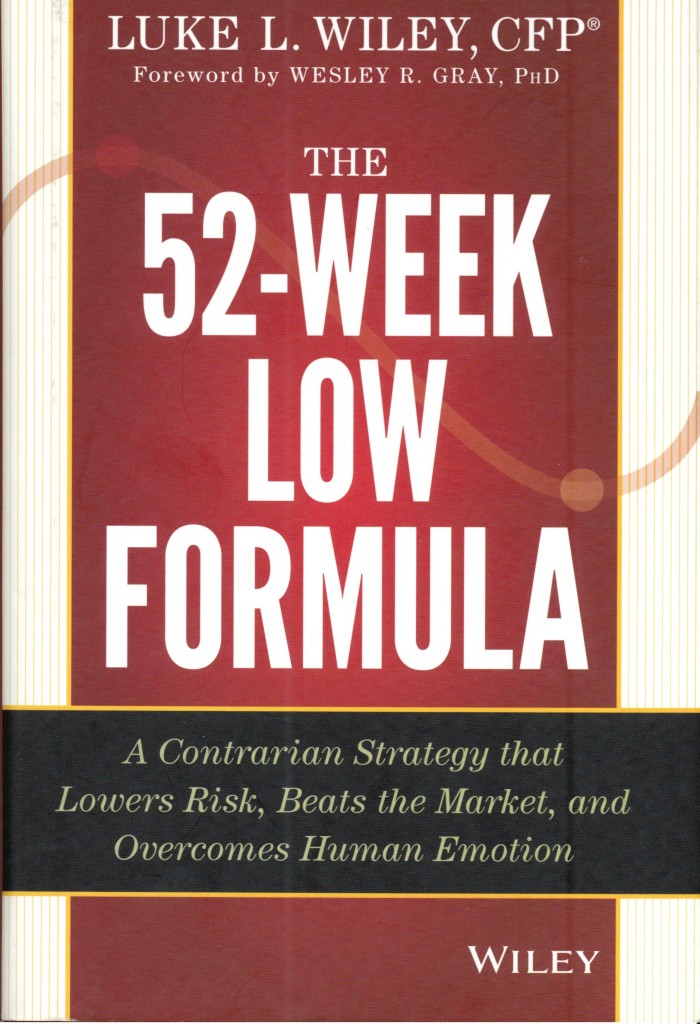
52wk I usually don’t like reviewing books that say, “Follow this formula, and you will make lotsa money. ?Thus it was with some hesitance that I requested this book. ?I did it partly off of Tweedy, Browne’s study, which is aptly titled, “What Has Worked in Investing.” ?For those reading at Amazon, Google “Tweedy Browne What has Worked” for the link. ?Stocks that hit new 52-week lows on average are ready to rebound. ?So why don’t people buy them?

Are you kidding? ?Look at that chart! ?Do you really want to catch a falling knife?! ?You want to throw good money after bad!? ?Why do you want to buy that dog, anyway…

Shhh. ?The competition is gone. ?There are no friends of failure. ?But made some companies get unfairly tarred as losers, when it is simply a good company that made a few mistakes.

That is the idea behind this book. ?Analyze companies from which?most market players ?have fled. ?Look for those with ?the following characteristics:

  1. They must have a durable competitive advantage.
  2. They must must a strong free cash flow yield.
  3. They must have a return on invested capital that exceeds the cost of that capital.
  4. They must not have too much debt relative to free cash flow.

I Had Troubles Getting to Solla Sollew

But here’s the big problem, and advantage, of the book. ?He does not give you the “secret sauce.” ?He gives you the principles. ?Indeed he can’t give a formula, because many of his criteria don’t admit an easy formula. ?You can’t calculate free cash flow from looking at GAAP accounting — you would need to know what portion of capital expenditure is to maintain existing assets, and that is nowhere disclosed. ?Typically, when you see free cash flow in screening software, all capital expenditure is deducted from cash flow from operations, producing too conservative of a figure.

Thus we can’t replicate points 2 & 4. ?What about 1 & 3? ?Companies do not comes with tags saying “Durable Competitive Advantage” and “No Durable Competitive Advantage.” ?That is a judgment call. ?You could use Morningstar’s Moat Ratings, or Gross Margins as a fraction of assets. ?The author does not give explicit guidance. ?As to point 3, the main problem is that we don’t know what a company’s cost of capital is. ?There are a lot of assumptions lying behind that, and they matter a great deal.

The easiest?of his five criteria to calculate is the price vs the 52-week low. ?Still, he doesn’t give us a threshold.

So What Good is This Book?!

Unless you are an expert, not much good, unless you simply want to play the 52-week low anomaly. ?That said, actionable strategy would be to review the 52-week lows, and analyze companies with low debt and high past profitability that seem to have a franchise that is not easily attacked. ?I think the theory is solid. ?That said, it does no give a lot of the details, not that most readers would understand it if they did.

This book is good, in that it is realistic. ?Though not explicit, it informs you that it is very difficult to choose superior stocks, and it it does not give you a cut-and-dried method.

So If You Can’t Do It Yourself, Then What Is This Book?!

Though the disclosure at the end says otherwise, this book is an advertisement for the author’s method of money management. ?In none of his five criteria does he get sharp. ?The general principles are correct, but you aren’t given the tools to use them. ?That means if you want to use them, you must go through the author.

Verification

They have a website –?52weeklow.com, but it is not laden with data as the book intimates, as of the day that I write this. ?That would be worth seeing.

Quibbles

On pages 74-75 he gives a strained view of margin of safety,?comparing free cash flow yields to the 10-year Treasury yield. ?Margin of safety is more of a balance sheet construct, asking how likely is is that a company will get into financial stress. ?What he is actually measuring here is valuation. ?What he is doing is not wrong, but it is mislabeled. ?Also remember, you can estimate free cash flow, but you never know for sure.

Also, as mentioned before, we have no idea of what his thresholds are and how he actually implements the strategy.

Thus after this article are two attempts to work out the strategy. ?What should not be surprising is that there are no companies on both lists.

Summary

This is a good book, but average investors should not buy it, because they can’t implement it.??If you still want that, you can buy it here:?The 52-Week Low Formula: A Contrarian Strategy that Lowers Risk, Beats the Market, and Overcomes Human Emotion.

Full disclosure: The PR flack asked me if I wanted the book, and I said “yes.”

If you enter Amazon through my site, and you buy anything, I get a small commission.? This is my main source of blog revenue.? I prefer this to a ?tip jar? because I want you to get something you want, rather than merely giving me a tip.? Book reviews take time, particularly with the reading, which most book reviewers don?t do in full, and I typically do. (When I don?t, I mention that I scanned the book.? Also, I never use the data that the PR flacks send out.)

Most people buying at Amazon do not enter via a referring website.? Thus Amazon builds an extra 1-3% into the prices to all buyers to compensate for the commissions given to the minority that come through referring sites.? Whether you buy at Amazon directly or enter via my site, your prices don?t change.

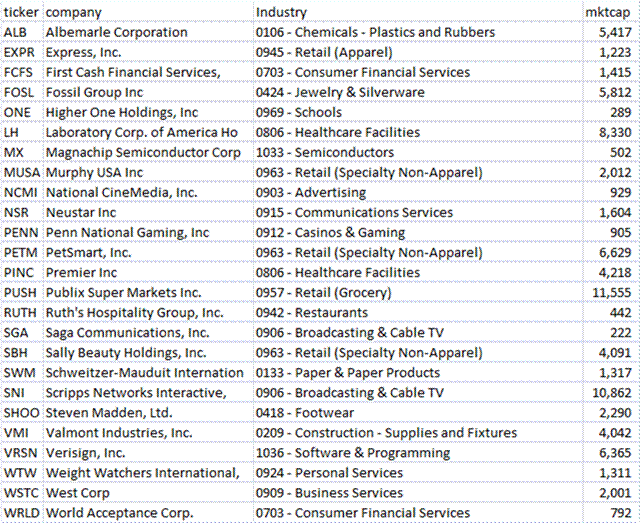
Application Attempt One

These were the companies selected — Morningstar Wide Moat, 5% Free Cash Flow Yield, Less than 20% above the 52-week low.

one

And here is the second try: Gross margins as a ratio of Assets over 13%, free cash flow yield over 5%, Long-term debt as a ratio of free cash flow greater than five,?less than 20% above the 52-week low.

two

Not one alike on the two lists. ?Tells you that his book would be very difficult to implement. ?*I* don’t know how I would implement it.

A Letter From a Reader with a New Investing Website

A Letter From a Reader with a New Investing Website

Okay, here goes… this is an experiment. ?I received the following letter:

David,

?You know investing inside and out. Given your expertise (as well as your ability to translate from financial speak to something that readers can really understand), I was hoping to get your opinion of the Market Power Indicator app from Stocks for the Week (http://stocksfortheweek.com/).

?We?re not pitching for coverage ? currently, we?re looking for feedback to make sure we?re creating a financial tool that will be really useful for people.

?We?re both looking for your insight as a financial expert, but also as a writer with an audience that looks for in-depth information in order to make financial decisions.

?In particular, we?re looking for answers to these three questions:

  • How do you look up stock information now?
  • How does Market Power Indicator compare to how you typically look up stocks now?
  • What would help you trust the Safety Score and other information in Market Power Indicator?
  • What features or changes would convince you to use our app on a regular basis?

If you?re willing to help us out, we?ve tried to keep things simple.

Sign up is really easy: if you go to http://stocksfortheweek.com/ and click the ?Sign Up? button, you can just click to create an account with a social media account like Twitter or Facebook. You should wind up at a page to create a stock watchlist.

From there, click around and see what you think. Just hit reply and let us know what you think through email.

We appreciate any time you can give us.

I did find it easy to create the account, and in general the site seems pretty well organized. ?I took all of my portfolio, and put it into the watchlist. ?28 of 38 companies were accepted. ?Those that weren’t accepted were small cap or foreign. ?Your coverage is spotty.

On the page where I could look at my watchlist, I tried sorting it by recommendation date, and it did not sort well.

I could not figure out what your algorithm was for investment-worthiness. ?My portfolio scored highly on your safety rankings, but 2 were “buy,” 35 were “hold,” and 1 was “sell.” ?If so much of my portfolio was hold, it does not make much sense. ?My portfolio is very strongly a “value” portfolio.

You need to be explicit as to what the holding period is for your recommendations. ?What time period are these over? ?How frequently do you expect people to turn their portfolios over? ?And if you do show performance on your recommendations, whether long or short, you should compare it to the S&P 500 or Russell 1000 over the same period.

If your recommendations have an aggregate performance, that should be revealed. ?Even with individual stocks, my initial test was?Leucadia National — the trades suggested by your model regularly lost. ?I suppose I could go through your universe, but I don’t have time. ?So, what proof do you have that your selection methods work?

To my readers, this site is worth trying out, ?but I do not give it a full endorsement. ?If you manager your own stocks, give it a try, and see what you think.

An Alternative to the Efficient Markets Hypothesis

An Alternative to the Efficient Markets Hypothesis

I read an article today, The Fallibility of the Efficient Market?Theory: A New Paradigm.?? Good article, made me look through a major article cited:?An Institutional Theory of Momentum and Reversal.

The former article explains in basic terms what the authors have illustrated. ?The latter article, provides all of the complex math. ?I get 50%+ of ?it, and I think it is right. ?This explains value, momentum, and mean-reversion, the largest anomalies that trouble the?Efficient Markets Hypothesis.

This article deserves more attention from quants and academics. ?The only thing that troubles me about it is that they assume a normal distribution for security returns.

Have a read, and for those that can understand the math, if you disagree with it, let me know.

Theme: Overlay by Kaira