The Financial Report of the United States Government 2016
The Financial Report of the United States Government 2016

Composition of Liabilities 1994-2016

=================================================

The last time I wrote about this was four years ago. ?I have covered this topic off and on for the last 25 years. ?As usual, the report got released during a relatively dead time, January 12th, where most people were listening to the preparations for the inauguration. ?I’ll give them some credit though — not as much of a dead time as usual; it was in the middle of a work week, AND earlier than usual. ?(It would be nice to know when it’s coming, though.)

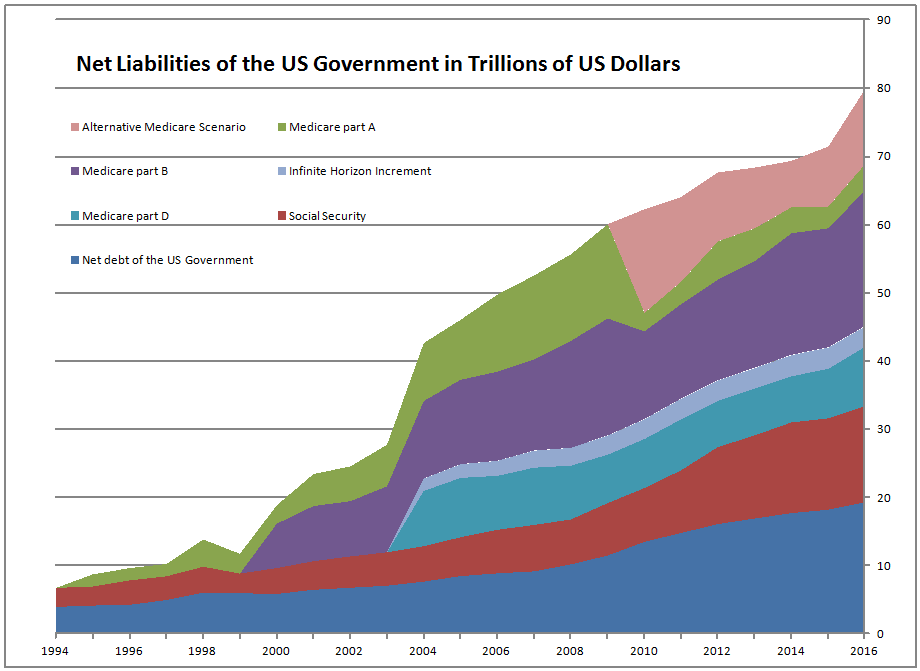
I have two main messages to go with my two graphs. ?The first message is one I have been saying before — beware some of the estimates that you hear, should you hear them at all. ?No one wants to talk about this, but what few that do will look at a few headline numbers and leave it there. ?Really you have to look at it for years, and look at the footnotes and other explanatory sections in the back when things seemingly change for no good reason. ?Also, you have to add all the bits up. ?No one will do that for you. ?Even with that, you are relying on the assumptions that the government uses, and they are not biased toward making the estimates sound larger. ?They tend to make them smaller.

Thus you will see two things that adjust the headline figures. ?In 2004, when Medicare part D was created, the Financial Report of the US Government began mentioning the Infinite Horizon Increment. ?Now, that liability always existed, but the actuaries began calculating how solvent is the system as a whole if it were permanent, as opposed to lasting 75 years.

The second is the Alternative Medicare Scenario. ?When the PPACA (Obamacare) was created in 2010, there was considerable chicanery in the cost estimates. ?The biggest part was that they assumed Medicare Part A (HI) would cost a lot less because they would reduce the amount that they would reimburse. ?They legislated away costs by assuming them away, and then each year Congress would restore the funding so that there wouldn’t be a firestorm when doctors stopped taking Medicare. ?But they left it in for budget and forecast purposes, and showed what the projections would be like if these cuts never took place in what they called the?Alternative Medicare Scenario.

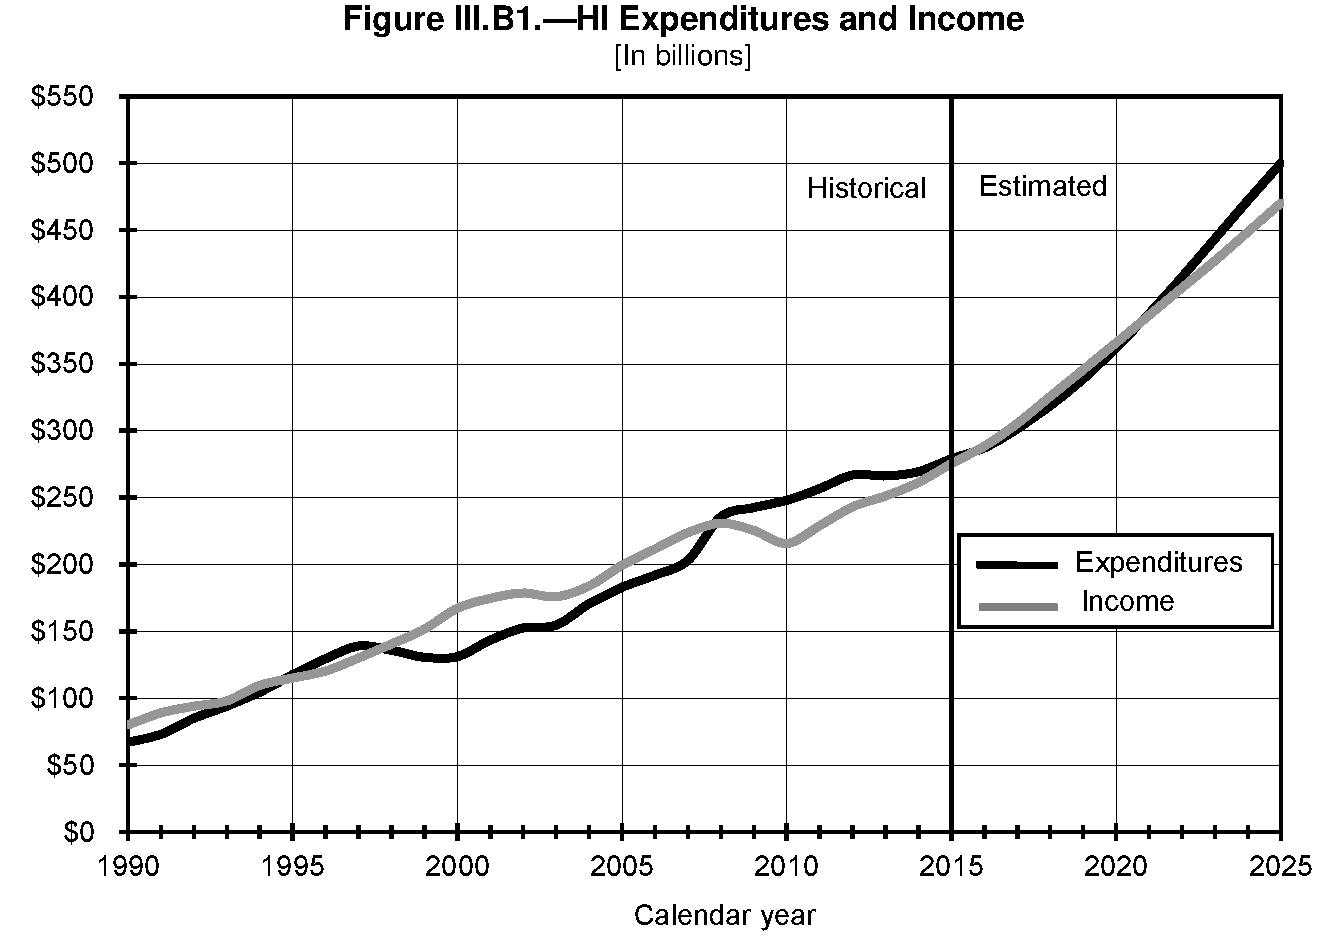
So, did the cuts to Medicare part A take place? No.
Graph Credit: The Boards of Trustees of the Federal Hospital Insurance Trust Fund
Graph Credit: The Boards of Trustees of the Federal Hospital Insurance Trust Fund?(page 54)

As you can see they have gone up almost every year since 2010. The liability should not have gone down. If you think the?Alternative Medicare Scenario is conservative enough, the liability has remained relatively constant since 2010, not diminished dramatically.

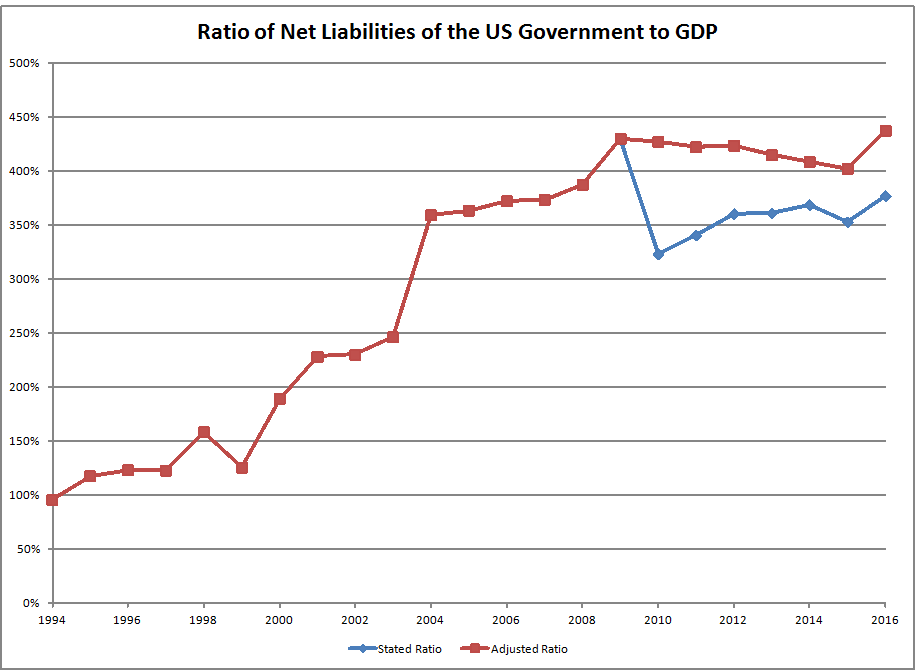
How is the load relative to GDP? ?It keeps growing, but since 2010 at a less frantic clip. ?The adjusted ratio below includes the?Alternative Medicare Scenario.

Final Notes

Remember that we have had a recovery since 2009. ?The statistics never assume that we will have another recession, much less a full fledged crisis like 2008-9. ?Without adjustment, the Medicare part A trust fund will run out in 2028. ?There is no provision for what the reimbursements will be made if the trust fund runs dry. ?Social Security’s trust fund will run out a few years after that, and instead of getting 12 checks a year, people will only get 9 of that same amount. ?If there is a significant recession, those statistics will move forward by an unknown number of years. ?Without congressional action, because there will be a recession, I would expect that both will run out somewhere in the middle of the 2020s, and then the real political fun will begin.

The tendency has been over time to turn these from entitlements to old age welfare schemes. ?FDR always wanted them to be self funded entitlements with everybody getting roughly the same treatment by formula, because he wanted the program to have widespread legitimacy across all classes, and no sense of stigma for being a poor old person on the dole.

Given the strategies that exist around qualifying for Medicaid, those days are gone, so I would expect that benefits will be limited for those better off, inflation adjustments eliminated, taxes raised to some degree, eligibility ages quickly raised a few more years, with elimination of strategies that allow people to get more out of the system by being clever. ?(As an example, expect the favorable late retirement factors to get reduced, and the early retirement factors to go down even more.)

Does this sound fun? ?Of course not, but remember that cultures are larger than economies, which are larger than governments. ?The cultural need for supporting poor elderly people will lead funding to continue, unless it makes the government, and the culture as a whole fail in the process, and that would never happen, right?

Streaking Into the Record Books?

Streaking Into the Record Books?

Well, this market is nothing if not special. ?The S&P 500 has gone 84 trading days without a loss of 1% or more. ?As you can see in the table below, that ranks it #17 of all streaks since 1950. ?If it can last through February 27th, it will be the longest streak since 1995. ?If it can last through March 23rd, it will be the longest streak since 1966. ?The all-time record (since 1950) would take us all the way to June.

Here’s another way to think about this — look at the VIX. ?It closed today at 10.85. ?Sleepy, sleepy… no risk to be found. ?When you don’t have any significant falls in the market, the VIX tends to sag. ?Aside from the election, which is an exception to the rule, the last two peaks of the VIX over the last six months were after 1%+ drops in the S&P 500.

The same would apply to credit spreads, which are also tight. ?No one expects a change in liquidity, a credit event, a national security incident, etc. ?But as I commented on Friday:

This is an awkward time when you have a lot of people arguing that the market CAN’T GO HIGHER! ?Let me tell you, it can go higher.

Will it go higher? ?Who knows?

Should it go higher? ?That’s the better question, and may help with the prior question. ?If you’re thinking strictly about absolute valuation, it shouldn’t go higher — we’re in the mid-80s on a percentile basis. ?On a relative valuation basis, where are you going to go? ?On a momentum basis, it should go higher. ?It’s not a rip-roarer in terms of angle of ascent, which bodes well for it. ?The rallies that fail tend to be more violent, and this one is kinda timid.

We sometimes ask in investing “who has the most to lose?” ?As in my tweet above, that very well could be asset allocators with low stock allocations that conclude that they need to chase the rally. ?Or, retail waking up to how great this bull market has been, concluding that they have been missing out on “free money.”

Truth, I’m not hearing many people at all banging the drum for this rally. ?There is a lot of skepticism.

As for me, I don’t care much. ?It’s not a core skill of mine, nor is it a part of my business. ?I am finding cheap stocks still, and I will keep investing through thick and thin, unless the 10-year forecast model that I use says future returns are below 3%/year. ?Then I will hedge, and encourage my clients to do so as well.

Until then, the game is on. ?Let’s see how far this streak goes.

==========================================

Streaks of over 50 days since 1950

Rank Date Streak Year
1 10/8/1963 154 1963
2 2/28/1966 154 1966
3 6/7/1954 142 1954
4 6/3/1964 131 1964
5 4/17/1961 119 1961
6 7/26/1957 115 1957
7 6/12/1985 112 1985
8 5/17/1995 110 1995
9 12/15/1995 105 1995
10 10/30/1967 103 1967
11 5/13/1958 102 1958
12 11/2/1993 95 1993
13 11/24/2006 94 2006
14 2/12/1993 87 1993
15 8/15/1952 86 1952
16 12/20/1968 85 1968
17 2/10/2017 84 2017
18 8/31/1979 82 1979
19 11/30/1964 81 1964
20 6/2/1950 75 1950
21 6/1/1965 75 1965
22 8/23/1972 74 1972
23 5/8/1972 73 1972
24 2/4/1953 70 1953
25 4/24/1962 67 1962
26 7/16/2014 66 2014
27 10/14/1958 65 1958
28 6/10/1969 65 1969
29 12/2/1996 65 1996
30 1/27/2004 65 2004
31 2/3/1994 63 1994
32 1/4/1962 60 1962
33 8/18/1976 60 1976
34 12/20/1985 60 1985
35 9/18/1961 58 1961
36 5/14/1971 58 1971
37 2/9/1989 58 1989
38 7/19/1968 57 1968
39 1/19/2006 56 2006
40 10/18/1951 55 1951
41 9/13/1978 55 1978
42 2/27/1963 54 1963
43 3/29/1977 54 1977
44 6/23/2016 54 2016
45 8/21/1953 53 1953
46 7/11/1960 53 1960
47 11/19/1969 52 1969
48 9/8/1994 52 1994
49 9/8/2016 51 2016
Steeling Themselves For Pension Benefit Cuts

Steeling Themselves For Pension Benefit Cuts

Photo Credit: Tony Hisgett?|| Only 20 years more and I can retire with a full pension!

========================================================

Aside from the bankruptcy of a plan sponsor, the benefits of someone being paid their pension can’t be cut. ?Right?

Well, mostly true. ?With governments in trouble, benefits have been cut, as in Rhode Island, Detroit, and a variety of other places with badly managed finances. ?Usually that’s a big political fight. ?Concessions come partly as a result that you could end up with less if you fight it, and don’t take the deal.

With corporations, the protection of the Pension Benefits Guarantee Corporation [PBGC] has kept pensions safe up to a limit — as of 2016, up to roughly $60K/year for those retiring at age 65 (less for younger retirees) from single-employer plans, and $12,870/year at most for those in multiemployer plans. ?(For some complexities, read more here. ?Also note that the PBGC itself is underfunded and faces antiselection problems as well.)

Multiemployer plans are an inherently weak structure, because?insolvent employers can’t contribute to fund plan deficits, and typically, multiemployer plans arise from collective bargaining arrangements, so that the firms employing the laborers are all in the same industry. ?Insolvency in industries, particularly where there is collective bargaining pushing up costs and limiting work process flexibility, tends to be correlated across firms. ?My poster child for that was the steel industry in 2002, where 20+ firms went insolvent. ?Employer insolvencies in an underfunded multiemployer plan affect all participants, including those working for solvent firms. ?(Note that solvent employers have to pay their pro-rata?share of underfunding in order to exit a multiemployer plan, as I noted for UPS in this article.)

Now in 2014, Congress passed a law called the?Kline-Miller Multiemployer Pension Reform Act of 2014. ?That allowed the PBGC, together with the Departments of Treasury and Labor, to negotiate benefit cuts to the pension plans in order to avoid the plans going insolvent — at which point, all pensioners would be limited to the PBGC limits for their payments. ?Workers in the plan — active, vested, and retired, would have to vote on any deal. ?Majority of those voting wins, so to speak.

The first plan to successfully go through this procedure and cut benefits to participants happened a few weeks ago, in the Iron Workers Local 17 Pension fund. ?Average benefits were cut 20%, with some cut as much as 60%, and some not cut at all. ?The plan was funded to a 24% level, and there are only 632 active employed workers to cover the benefits of 2,042 participants. ?The fund would likely run out of money in 2024. ?Note that only 900+ voted on the cuts, with the cuts passing at roughly 2-1.

There are at least four other multiemployer plans with similar applications to cut benefit payments. ?Prior to this four other multiemployer plans had such applications denied — there were a variety of reasons for the denials: the cuts were done in an inequitable way in some cases, return assumptions were unreasonably high, etc.

My original source for this piece is note by David Gonzales of Moody’s. ?They rate these actions as credit positive because it potentially ends the process where an underfunded multiemployer plan would encourage an employer to default because it can’t afford the liability. ?Somewhat perverse in a way, because the pain has to go somewhere on an underfunded plan — it’s all a question of who gets tapped. ?Note that it also protects the PBGC Multiemployer Trust, which itself is likely to run out of money by 2025. ?After that, those relying on the PBGC for multiemployer pension payments get zero, unless something changes.

For those wanting 30 pages of informative data on scope of the matter, here is a useful piece from the Congressional Research Service.

Final Note

You might think this is an extreme situation, and yes, it is extreme. ?It’s not so extreme that there aren’t other underfunded plans as bad off as this multiemployer plan. ?I would encourage everyone who has a defined benefit plan to take a close look at their funded status. ?I don’t care about what your state constitution says on protecting your pension benefits. ?If the cash gets close to running out, “the?powers that be” will find a way around that. ?After all, what happened with the?Iron Workers Local 17 Pension Fund was illegal prior to 2014. ?Now it is 2017, and benefits were cut.

Because of underfunding, there will be more cuts. ?Depend on that happening for the worst funds, and at least run through the risk analysis of what you would do if your pension benefit were cut by 20% for a municipal plan, or to the PBGC limit for a corporate plan. ?Why? ?Because it could happen.

Yield = Poison (3)

Yield = Poison (3)

Photo Credit: Brent Moore || Watch the piggies run after scarce yield!

=======================================================

If you do remember the first time I wrote about yield being poison,?you are unusual, because it was the first real post at Aleph Blog. ?A very small post — kinda cute, I think when I look at it from almost ten years ago… and prescient for its time, because a lot of risky bonds were about to lose value (in 19 months), aside from the highest quality bonds.

I decided to write this article this night because I decided to run my bond momentum model — low and behold, it yelled at me that everyone is grabbing for yield through credit risk, predominantly corporate and emerging markets, with a special love for bank debt closed end funds.

I get the idea — short rates are going to rise because the Fed is tightening and inflation is rising globally, and there is no credit risk anymore because economic growth is accelerating globally — it’s not just a US/Trump thing. ?I just have a harder time playing the game because we are in the wrong phase of the credit cycle — profit growth is nonexistent, and debts are growing.

I have a few other concerns as well. ?Even if encouraging exports and discouraging imports aids the US economy for a while (though I doubt it — more jobs rely on exports than are lost by imports, what if there is retaliation?) there is a corresponding opposite impact on the capital account — less reinvestment in the US. ?We could see higher yields…

That said, I would be more bearish on the US Dollar if it had some real competition. ?All of the major currencies have issues. ?Gold, anyone? ?Low short rates and rising inflation are the ideal for gold. ?Watch the real cost of carry go more negative, and you get paid (sort of) for holding gold.

If growth and inflation?persist globally (consider some of the work @soberlook has ?been doing at The WSJ Daily Shot — a new favorite of mine, even his posts are?too big) then almost no bonds except the shortest bonds will be any good in the intermediate-term — back to the ’70s phrase “certificates of confiscation.” ?One other effect that could go this way — if the portion of Dodd-Frank affecting bank leverage is repealed, the banks will have a much greater ability to lend overnight, which would be inflationary. ?Of course, they could just pay special dividends, but most corporations lean toward growing the business, unless they are disciplined capital allocators.

But it is not assured that the current growth and inflation will persist. ?M2 Monetary velocity is still low, and the long end of the yield curve does not have yield enough priced in for additional growth and inflation. ?Either long bonds are a raving sell, or the long end is telling us we are facing a colossal fake-out in the midst of too much leverage globally.

Summary

I’m going to stay high quality and short for now, but I will be watching for the current trends to break. ?I may leg into some long Treasuries, and maybe some foreign bonds. ?Gold looks interesting, but I don’t think I am going there. ?I’m not making any big moves in the short run — safe and short feels pretty good for the?bond portfolios that I manage. ?I think it’s a time to preserve principal — there is more credit risk than the market is pricing in. ?It might take a year or two to get there, or it might be next month… I would simply say stay flexible and look for a time where you have better opportunities. ?There is no fat pitch at present for long only investors like me.

Postscript

To those playing with fire buying dividend paying common stocks, preferred stocks, MLPs, etc. for yield — if we hit a period where credit risk becomes obvious — all of your “yield plays” will behave like stocks in a poisoned sector. ?There could be significant dividend cuts. ?Dividends are not guaranteed like bonds — bonds must pay or it is bankruptcy. ?Managements avoid defaulting on their bonds and loans, but will not hesitate to cut or not pay dividends in a crisis — it is self-preservation, at least in the short-run. ?Even if they get replaced by angry shareholders, the management typically gets some sort of parachute if the company survives, and far less in bankruptcy.

One final note on this point — stocks that have a lot of yield buyers behave more like bonds. ?If bond yields rise above current stock earnings yields, the stock prices will fall to reprice the yield of the stock, even if there is no bankruptcy risk.

And, if you say you can hold on and enjoy the rising dividends of your high quality companies? ?Accidents happen, the same way they did to some people who bought houses in the middle of the last decade. ?Many could not ride out the crisis because of some life event. ?Make sure you have a margin of safety. ?In a really large crisis, the return on risk assets may look decent from ten years before to ten years after, but a lot of people get surprised by their need to draw on those assets at the wrong moment — bad events come in bunches, when the credit cycle goes bust. Be careful, and don’t reach for yield.

The Band Marches On

The Band Marches On

Photo Credit: Mike Morbeck?|| On Wisconsin! On Wisconsin!

=============================================================

It was shortly after the election when I last moved my trading band. ?Well, time to move it again, this time up 4%, with a small twist. ?I’m at my cash limit of 20%, with a few more stocks knocking on the door of a rebalancing sale, and none near a rebalancing buy. ?(To decode this, you can read my article on portfolio rule seven.) ?Here is portfolio rule seven:

Rebalance the portfolio whenever a stock gets more than 20% away from its target weight. Run a largely equal-weighted portfolio because it is genuinely difficult to tell what idea is the best. Keep about 30-40 names for diversification purposes.

This is my interim trading rule, which helps me make a little additional money for clients by buying relatively low and selling relatively high. ?It also reduces risk, because higher prices are riskier than lower prices, all other things equal.

There are two companies that are double-weights in my portfolio, one half-weight, and 32 single-weights. ?The half-weight is a micro-cap that is difficult to buy or sell. (Patience, patience…) ?With cash near 20%, a?single-weight currently runs around 2.2% of assets, with buying happening near 1.75%, and selling near 2.63%.

But, I said there was a small twist. ?I’m going to add another single-weight position. ?I don’t know what yet. ?Also, I’m leaving enough in reserve to turn one of the single-weights into a double-weight. ?That company is a well-run Mexican firm that has ?had a falling stock price even though it is still performing well. ?If it falls another 10%, I will do more than rebalance. ?I will rebalance and double it.

Part of the reason for the move in both number of positions and position size at the same time is that both the half-weight and one single-weight that is at the top of its band are being acquired for cash, and so they (3.5% of assets) behave more like cash than stocks.

Thus, amid a portfolio that has been performing well, I am adjusting my positioning so that if the market continues to do well, the portfolio doesn’t lag much, or even continues to outperform. ?I’m not out to make big macro bets; I will make a small bet that the market is high, and carry above average cash, but it will all get deployed if the market falls 25%+ from here.

I keep the excess cash around for the same reason Buffett does. ?It gives you more easy options in a bad market environment. ?Until that environment comes, you’ll never know how valuable is is to keep some extra cash around. ?Better safe, than sorry.

Redacted Version of the February 2017 FOMC Statement

Redacted Version of the February 2017 FOMC Statement

Photo Credit: eflon?|| Ask to visit the Medieval dining hall! ?Really!

===============================================================

December 2016 February 2017 Comments
Information received since the Federal Open Market Committee met in November indicates that the labor market has continued to strengthen and that economic activity has been expanding at a moderate pace since mid-year. Information received since the Federal Open Market Committee met in December indicates that the labor market has continued to strengthen and that economic activity has continued to expand at a moderate pace. No real change.
Job gains have been solid in recent months and the unemployment rate has declined. Job gains remained solid and the unemployment rate stayed near its recent low. No real change.
Household spending has been rising moderately but business fixed investment has remained soft. Household spending has continued to rise moderately while business fixed investment has remained soft. No real change.
  Measures of consumer and business sentiment have improved of late. New sentence.
Inflation has increased since earlier this year but is still below the Committee’s 2 percent longer-run objective, partly reflecting earlier declines in energy prices and in prices of non-energy imports. Inflation increased in recent quarters but is still below the Committee’s 2 percent longer-run objective. Shades their view of inflation up.
Market-based measures of inflation compensation have moved up considerably but still are low; most survey-based measures of longer-term inflation expectations are little changed, on balance, in recent months. Market-based measures of inflation compensation remain low; most survey-based measures of longer-term inflation expectations are little changed, on balance. What would be a high number, pray tell?? TIPS are showing higher inflation expectations since the last meeting. 5y forward 5y inflation implied from TIPS is near 2.15%, up 0.07%? from December.
Consistent with its statutory mandate, the Committee seeks to foster maximum employment and price stability. Consistent with its statutory mandate, the Committee seeks to foster maximum employment and price stability. No change. Any time they mention the ?statutory mandate,? it is to excuse bad policy. But don?t blame the Fed, blame Congress.
The Committee expects that, with gradual adjustments in the stance of monetary policy, economic activity will expand at a moderate pace and labor market conditions will strengthen somewhat further. Inflation is expected to rise to 2 percent over the medium term as the transitory effects of past declines in energy and import prices dissipate and the labor market strengthens further. The Committee expects that, with gradual adjustments in the stance of monetary policy, economic activity will expand at a moderate pace, labor market conditions will strengthen somewhat further, and inflation will rise to 2 percent over the medium term. Drops references to falling energy prices stopping, and wage pressures. Strengthens language on inflation, which is a slam dunk, given that it is there already on better inflation measures than the PCE deflator.

CPI is at +2.1% NOW, yoy.

Near-term risks to the economic outlook appear roughly balanced. The Committee continues to closely monitor inflation indicators and global economic and financial developments. Near-term risks to the economic outlook appear roughly balanced. The Committee continues to closely monitor inflation indicators and global economic and financial developments. No change.
In view of realized and expected labor market conditions and inflation, the Committee decided to raise the target range for the federal funds rate to 1/2 to 3/4 percent. In view of realized and expected labor market conditions and inflation, the Committee decided to maintain the target range for the federal funds rate at 1/2 to 3/4 percent. No change. Builds in the idea that they are reacting at least partially to expected future conditions in inflation and labor.
The stance of monetary policy remains accommodative, thereby supporting some further strengthening in labor market conditions and a return to 2 percent inflation. The stance of monetary policy remains accommodative, thereby supporting some further strengthening in labor market conditions and a return to 2 percent inflation. No change. They don?t get that policy direction, not position, is what makes policy accommodative or restrictive.? Think of monetary policy as a drug for which a tolerance gets built up.

What would a non-accommodative monetary policy be, anyway?

In determining the timing and size of future adjustments to the target range for the federal funds rate, the Committee will assess realized and expected economic conditions relative to its objectives of maximum employment and 2 percent inflation. In determining the timing and size of future adjustments to the target range for the federal funds rate, the Committee will assess realized and expected economic conditions relative to its objectives of maximum employment and 2 percent inflation. No change.
This assessment will take into account a wide range of information, including measures of labor market conditions, indicators of inflation pressures and inflation expectations, and readings on financial and international developments. This assessment will take into account a wide range of information, including measures of labor market conditions, indicators of inflation pressures and inflation expectations, and readings on financial and international developments. No change.? Gives the FOMC flexibility in decision-making, because they really don?t know what matters, and whether they can truly do anything with monetary policy.
In light of the current shortfall of inflation from 2 percent, the Committee will carefully monitor actual and expected progress toward its inflation goal. In light of the current shortfall of inflation from 2 percent, the Committee will carefully monitor actual and expected progress toward its inflation goal. No change.
The Committee expects that economic conditions will evolve in a manner that will warrant only gradual increases in the federal funds rate; the federal funds rate is likely to remain, for some time, below levels that are expected to prevail in the longer run. However, the actual path of the federal funds rate will depend on the economic outlook as informed by incoming data. The Committee expects that economic conditions will evolve in a manner that will warrant only gradual increases in the federal funds rate; the federal funds rate is likely to remain, for some time, below levels that are expected to prevail in the longer run. However, the actual path of the federal funds rate will depend on the economic outlook as informed by incoming data. No change.? Says that they will go slowly, and react to new data.? Big surprises, those.
The Committee is maintaining its existing policy of reinvesting principal payments from its holdings of agency debt and agency mortgage-backed securities in agency mortgage-backed securities and of rolling over maturing Treasury securities at auction, and it anticipates doing so until normalization of the level of the federal funds rate is well under way. This policy, by keeping the Committee’s holdings of longer-term securities at sizable levels, should help maintain accommodative financial conditions. The Committee is maintaining its existing policy of reinvesting principal payments from its holdings of agency debt and agency mortgage-backed securities in agency mortgage-backed securities and of rolling over maturing Treasury securities at auction, and it anticipates doing so until normalization of the level of the federal funds rate is well under way. This policy, by keeping the Committee’s holdings of longer-term securities at sizable levels, should help maintain accommodative financial conditions. No change.? Says it will keep reinvesting maturing proceeds of treasury, agency debt and MBS, which blunts any tightening.
Voting for the FOMC monetary policy action were: Janet L. Yellen, Chair; William C. Dudley, Vice Chairman; Lael Brainard; James Bullard; Stanley Fischer; Esther L. George; Loretta J. Mester; Jerome H. Powell; Eric Rosengren; and Daniel K. Tarullo. Voting for the FOMC monetary policy action were: Janet L. Yellen, Chair; William C. Dudley, Vice Chairman; Lael Brainard; Charles L. Evans; Stanley Fischer; Patrick Harker; Robert S. Kaplan; Neel Kashkari; Jerome H. Powell; and Daniel K. Tarullo. Full agreement; new people.


Comments

  • The FOMC holds, but deludes itself that it is still accommodative.
  • The economy is growing well now, and in general, those who want to work can find work.
  • Maybe policy should be tighter. The key question to me is whether lower leverage at the banks was a reason for ultra-loose policy.
  • The change of the FOMC?s view is that inflation is higher. Equities are stable and bonds fall a little. Commodity prices rise and the dollar weakens.
  • The FOMC says that any future change to policy is contingent on almost everything.

The global economy is growing, inflation is rising globally, the dollar is rising, and the 30-year Treasury has not moved all that much relative to all of that. ?My guess is that the FOMC could get the Fed funds rate up to 2% if they want to invert the yield curve. ?A rising dollar will slow the economy and inflation somewhat.

Aside from that, I am looking for what might blow up. ?Maybe some country borrowing too much in dollars? ?Tightening cycles almost always end with a bang.

On Human Fertility, Part 5

On Human Fertility, Part 5

Data from the CIA Factbook

========================

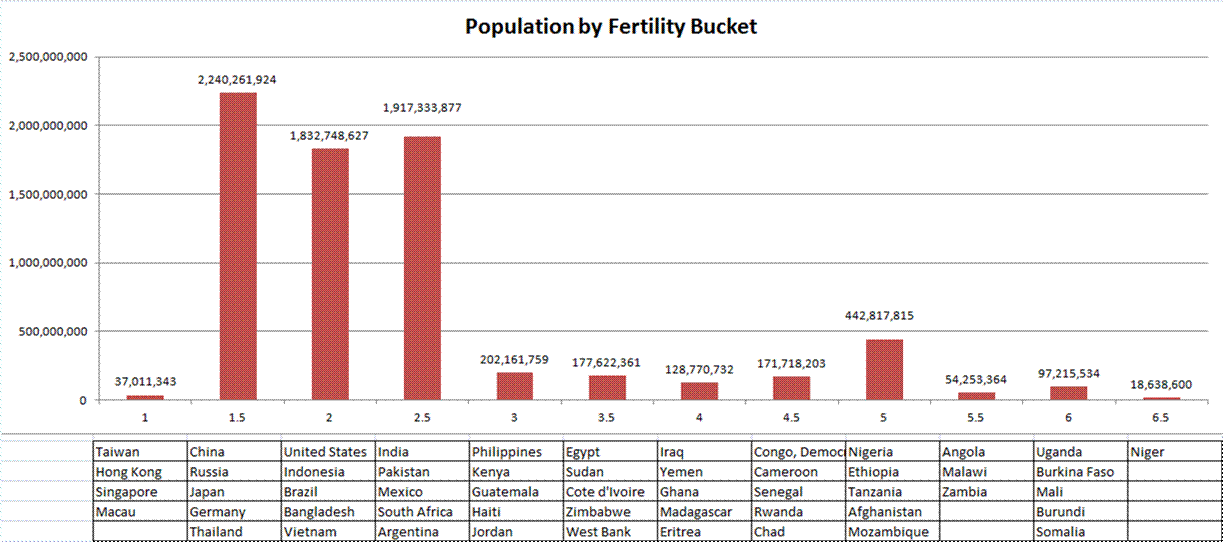
I write about this every now and then, because human fertility is falling faster then most demographers expect. Using the CIA Factbook for data, the present total fertility rate for the world is 2.407 births per woman that survives childbearing. That is down from 2.425 in 2014, 2.467 in 2012, and 2.489 in 2010.? At this rate, the world will be at replacement rate (2.1), somewhere between 2035 and 2040. That?s a lot earlier than most expect, and it makes me suggest that global population will top out somewhat below 9?Billion in 2050, lower and earlier than most expect.

Have a look at the Total Fertility Rate by group in the graph above. The largest nations for each cell are listed below the graph. Note Asian nations to the left, and African nations to the right.

Africa is so small, that the high birth rates have little global impact. Also, AIDS consumes their population, as do wars, malnutrition, etc.

The Arab world is also slowing in population growth. When Saudi Arabia at?replacement rate (2.11), you can tell that the women are gaining the upper hand there, which is notable given the polygamy is permitted.

In the Developed world, who leads in fertility? Israel at 2.66. Next is France at 2.07 (Arabs), New Zealand at 2.03, Iceland at 2.01, Ireland at 1.98 (up considerably), UK at 1.89, Sweden at 1.88, and the US at 1.87, which is below replacement. The US?still grows from immigration, as does France.

Most of the above is a quick update of my prior pieces, which have some additional crunchy insights. ?When I look at the new data, I wonder if developed nations might not finally be waking up to the birth dearth. ?Take a look at this graph:

Now, the bottom left is a little crammed. ?What if I expand it?

I did the second graph in order to make the point that nations with fertility below 1.76 in 2010 tended to increase their fertility, while those above 1.76 tended to decrease it. ?Not that you should trust any statistical analysis, but if you could, this is statistically significant at a level well above 99%. ?(Note: this is an ordinary least squares regression. ?Every “nation” is weighted equally. ?If I get asked nicely, I could do a weighted least squares regression which gives heavy weight to China, India and the US, and less weight to Somalia, the West Bank, and Tonga. ?I don’t think the result would change much.)

I’m chuckling a little bit as I write this, because this is an interesting result, and one that I never thought I would be writing when I started this project. ?Interesting, huh? ?My guess is that there is a limit to how much you can get people to reduce family sizes before they begin to question the idea. ?Older parents may say, “What was that all about?” but children are usually fun and cute when they are little if they are reasonably disciplined.

One final note: I’ve been running into a lot of demographic articles of late, but this was the one that got me to write this:?The World’s Most Populous Country Is Turning Gray. ?The barbaric “One Child Policy” of China is having its impact; demography is often destiny. ?That said, over the last six years China’s total fertility rate has moved from 1.54 to 1.60.

As it says in the article:

Births in 2016 reached 17.86 million, the most since 2000, rising by 1.91 million from 2015, the National Health and Family Planning Commission said this month. That still falls short of the official projection. Last June, the ministry estimated there would be an increase of 4 million new births every year until 2020. China will continue to implement the two-child policy to promote a balanced population, the plan said.

Fertility doesn’t turn on a dime. ?When women conclude that the rewards of society (money, power, approval of peers) go to those with fewer children, that’s a tough cultural idea to overcome. ?I would conclude that it will take a lot longer than a single five-year plan to turn around birthrates in China… if they can be turned around at all. ?All across Asia, marriages happen at lesser rates, happen later, and produce fewer children. ?China is one of the more notable examples.

PS — Picky note: the two-child policy in China is only available to a husband and wife where at least one is an “only child.” ?It won’t create a balanced population near replacement rate, as everyone else must have only one child (with exceptions).

Call Me When You Have A Real Insurance Company!

Call Me When You Have A Real Insurance Company!

Photo Credit: eflon?|| The?title of the article comes from a comment Greenberg supposedly made to Buffett when AIG was much bigger than Berkshire Hathaway — times change…

============================

The?title of the article comes from a comment Greenberg supposedly made to Buffett when AIG was much bigger than Berkshire Hathaway [BRK] — times change…

It’s come to this: AIG has sought out reinsurance from BRK to cap the amount of losses they will pay for prior business written. ?It’s quite a statement when you are willing to pay $10 billion in order to have BRK pay 80% of claims over $25 billion, up to $20 billion in total. ?At $50 Billion in claims AIG is on its own again.

So what business was covered? ?A lot. ?This is the one of the biggest deals of its type, ever:

The agreement covers 80% of substantially all of AIG?s U.S. Commercial long-tail exposures for accident years 2015 and prior, which includes the largest part of AIG?s U.S. casualty exposures during that period. AIG will retain sole authority to handle and resolve claims, and NICO has various access, association and consultation rights.

Or as was said in the Wall Street Journal article:

The pact covers such product lines as workers? compensation, directors? and officers? liability, professional indemnity, medical malpractice, commercial automobile and some other liability policies.

Now, AIG is not among the better P&C insurance companies for reserving out there. ?2.5 years ago, they made the Aleph Blog Hall of Shame for P&C reserving. ?Now if you would have looked on the last 10-K on page 296 for item 8, note 12, you would note that AIG’s reserving remained weak for?2014 and 2015 as losses and loss adjustment expenses incurred for the business of prior years continued positive.

For AIG, this puts a lot of its troubles behind it, after the upcoming writeoff (from the WSJ article):

AIG, one of the biggest sellers of insurance by volume to businesses around the globe, also said it expects a material fourth-quarter charge to boost its claims reserves. AIG declined to comment on the possible size. Its fourth-quarter earnings will be released next month.

For BRK, this is an opportunity to make money investing the $10 billion as claims on the long-tail business get paid out slowly. ?It’s called float, which isn’t magic, but Buffett has done better than most at investing the float, and choosing insurance business to write and reinsure that doesn’t result in large losses for BRK.

I expect BRK to make an underwriting profit on this, but let’s assume the worst, that BRK pays out the full $20 billion. ?Say the claims come at a rate of $5 billion/year. ?The average payout period would be 7.5 years, and BRK would have to earn 9.2% on the float to break even. ?At $3.75B/yr, the figures would be 10 years and 6.9%. ?At $2.5B/yr, 15 years and 4.6%.

This doesn’t seem so bad to me — now I don’t know how bad reserve development will be for AIG, but BRK is usually pretty careful about underwriting this sort of thing. That said BRK has a lot of excess cash sitting around already, and desirable targets for large investments are few. ?This had better make an underwriting profit, or a small loss, or maybe Buffett is ready for the market to fall apart, and thus the rate he can earn goes up.

All that said, it is an interesting chapter in the relationship between the two companies. ?If BRK wasn’t the dominant insurance company of the US after the 2008 financial crisis, it definitely is now.

Full disclosure: long BRK/B for myself and clients

Trump and Conflicts of Interest

Trump and Conflicts of Interest

Photo Credit: www.GlynLowe.com

======================

I was driving to a meeting of the Baltimore CFA Society, and listening to Bloomberg Radio, which was carrying President-Elect Trump’s Press Conference. I didn’t think too much about what I heard until Sheri Dillon talk about what was being done to eliminate conflicts of interest. Here is an excerpt:

Some have asked questions. Why not divest? Why not just sell everything? Form of blind trust. And I?d like to turn to addressing some of those questions now.

Selling, first and foremost, would not eliminate possibilities of conflicts of interest. In fact, it would exacerbate them. The Trump brand is key to the value of the Trump Organization?s assets. If President-elect Trump sold his brand, he would be entitled to royalties for the use of it, and this would result in the trust retaining an interest in the brand without the ability to assure that it does not exploit the office of the presidency.

[snip]

Some people have suggested that the Trump ? that President-elect Trump could bundle the assets and turn the Trump Organization into a public company. Anyone who has ever gone through this extraordinarily cumbersome and complicated process knows that it is a non-starter. It is not realistic and it would be inappropriate for the Trump Organization.

It went on from there, but I choked on the last paragraph that I quoted above. (Credit: New York Times, not all accounts carried the remarks of Ms. Dillon, a prominent attorney with the firm Morgan Lewis who structured the agreements for Trump) ?As I said before:

An IPO of the Trump Organization was?realistic. ?I’m not saying it could have been done by the inauguration, but certainly by the end of 2017, and likely a lot earlier. ?I’ve seen insurance companies go through IPO processes that took a matter of months, a few because they had to sell the company to raise liquidity quickly for some reason.

In an IPO, Trump, all of Trump’s children and anyone else with an equity interest would have gotten their proportionate share of the new public company. ?Trump could have provided a lot of shares for the IPO, and instructed the trustee for his assets to sell it off?the remainder over the next year or so.

While difficult, this would not have been impossible or imprudent. ?Trump?might lose some value in the process, but hey, that should be part of the cost for a very wealthy man who becomes President of the US. ?There would be the countervailing advantage that all capital gains are eliminated, and who knows, that might settle his existing negotiations with the IRS.

Ending the counterfactual, though conflict of interest rules don’t apply to the President, Trump had?an opportunity to eliminate all conflicts of interest, and did not take it.

PS — Many major hotels are in the “name licensing” business — I also don’t buy the argument that Trump could not sell off the organization in entire, with no future payments for the rights of using the name. ?A bright businessman could create a new brand easily. ?It’s been done before.

Distrust Forecasts, Part 2

Distrust Forecasts, Part 2

Photo Credit: D.C.Atty || Scrawled in 2008, AFTER the crash started

=============================

Comments are always appreciated from readers, if they are polite. ?Here’s a recent one from the piece?Distrust Forecasts.

You made one statement that I don?t really understand. ?Most forecasters only think about income statements. Most of the limits stem from balance sheets proving insufficient, or cash flows inverting, and staying that way for a while.?

What is the danger of balance sheets proving insufficient? Does that mean that the company doesn?t have enough cash to cover their ?burn rate??

Not having enough cash to cover the burn rate can be an example of this. ?Let me back up a bit, and speak generally before focusing.

Whether economists, quantitative analysts, chartists or guys who pull numbers out of the air, most people do not consider balance sheets when making predictions. ?(Counterexample: analysts at the ratings agencies.) ?It is much easier to assume a world where there are no limits to borrowing. ?Practical example #1 would be home owners and buyers during the last financial crisis, together with the banks, shadow banks, and government sponsored enterprises that financed them.

In economies that have significant private debts, growth is limited, because of higher default probabilities/severity, and less capability of borrowing more should defaults tarry. ?Most firms don?t like issuing equity, except as a last resort, so restricted ability to borrow limits growth. High debt among consumers limits growth in another way ? they have less borrowing capacity and many feel less comfortable borrowing anyway.

Figuring out when there is “too much debt” is a squishy concept at any level — household, company, government, economy, etc. ?It’s not as if you get to a magic number and things go haywire. ?People have a hard time dealing with the idea that as leverage rises, so does the probability of default and the severity of default should it happen. ?You can get to really high amounts of leverage and things still hold together for a while — there may be extenuating circumstances allowing it to work longer — just as in other cases, a failure in one area triggers a lot more failures as lenders stop lending, and those with inadequate liquidity can refinance and then fail.

Three?More Reasons to Distrust Predictions

1) Media Effects — the media does not get the best people on the tube — they get those that are the most entertaining. ?This encourages extreme predictions. ?The same applies to people who make predictions in books — those that make extreme predictions sell more books. ?As an example, consider this post from Ben Carlson on Harry Dent. ?Harry Dent hasn’t been right in a long time, but it doesn’t stop him from making more extreme predictions.

For more on why you should ignore the media, you can read this ancient article that I wrote for RealMoney in 2005, and updated in 2013.

2) Momentum Effects — this one is two-sided. ?There are?momentum effects in the market, so it’s not bogus to shade near term estimates based off of what has happened recently. ?There are two problems though — the longer and more severe the rise or fall, the more you should start downplaying momentum, and increasingly think mean-reversion. ?Don’t argue for a high returning year when valuations are stretched, and vice-versa for large market falls when valuations are compressed.

The second thing is kind of a media effect when you begin seeing articles like “Everyone Ought to be Rich,” etc. ?”Dow 36,000″-type predictions come near the end of bull markets, just as “The Death of Equities’ comes at the end of Bear Markets. ?The media always shows up late; retail shows up late; the nuttiest books show up late. ?Occasionally it will fell like books and pundits are playing “Can you top this?” near the end of a cycle.

3) Spurious Math — Whether it is the geometry of charts or the statistical optimization of regression, it is easy to argue for trends persisting longer than they should. ?We should always try to think beyond the math to the human processes that the math is describing. ?What levels of valuation or indebtedness are implied? ?Setting new records in either is always possible, but it is not the most likely occurrence.

With that, be skeptical of forecasts.


Theme: Overlay by Kaira