Month: April 2016

Goes Down Double-Speed (Update 3)

Goes Down Double-Speed (Update 3)

Photo Credit: Vincent Nguyen
S&P 500 at turning points
Data Credit: Ed Yardeni

This is the fourth article in this series, and is here because the S&P 500 is now in its second-longest bull market since 1928, having just passed the bull market that ended in 1956.? ? Yeah, who’da thunk it?

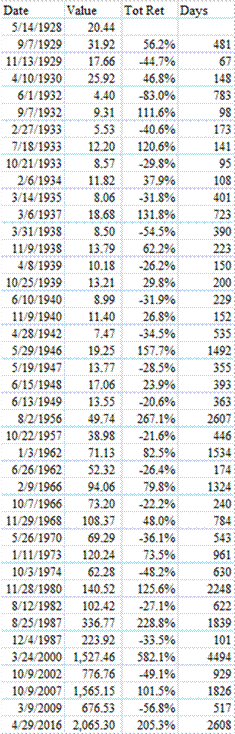
This post is a little different from the first three articles, because I got the data to extend the beginning of my study from 1950 to 1928, and I standardized my turning points using the standard bull and bear market definitions of a 20% rise or fall from the last turning point. ?You can see my basic data to the left of this paragraph.

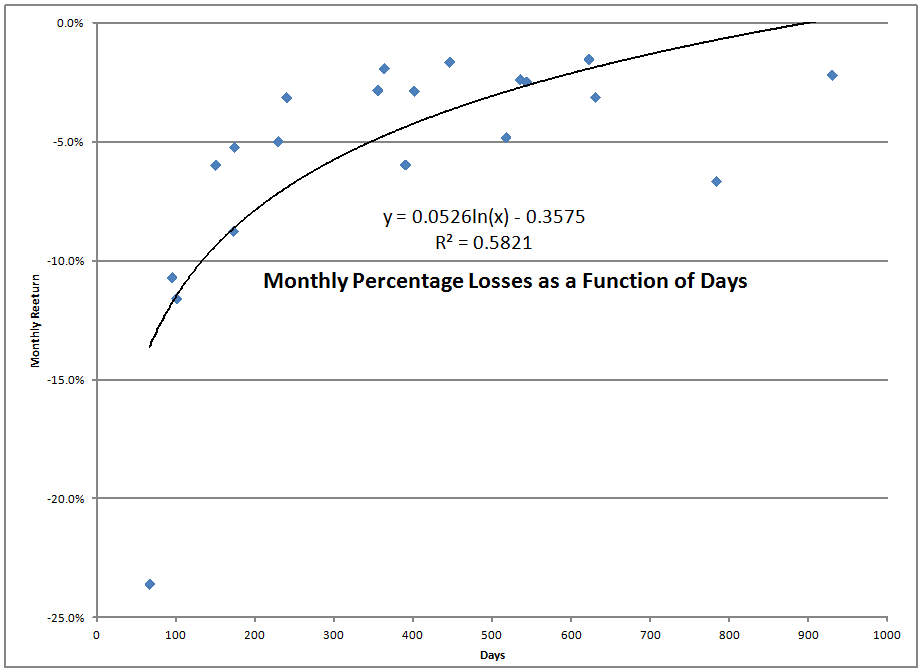
Before I go on, I want to show you two graphs dealing with bear markets:

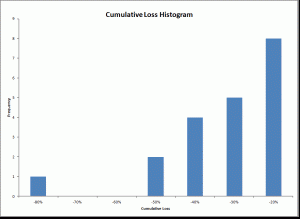
As you can see from the first graph, small bear markets are much more common than large ones. ?Really brutal bear markets like the biggest one in the Great Depression were so brutal that there is nothing to compare it to — financial leverage collapsed that had been encouraged by government policy, the Fed, and a speculative mania among greedy people.

The second graph tells the same story in a different way. ?Bear markets are often short and sharp. ?They don’t last long, but the intensity in term of the speed of declines is a little more than?twice as fast as the rises of bull markets. ?If it weren’t for the fact that bull markets last more than three times as long on average, the sharp drops in bear markets would be enough to keep everyone out of the stock market.

Instead, it just keeps many people out of the market, some entirely, but most to some degree that would benefit them.

Oh well, on to the gains:

Like bear markets, most bull markets are small. ?The likelihood of a big bull market declines with size. ?The current bull market is the fourth largest, and the one that it passed in duration was the second largest. ?As an aside, each of the four largest bull markets came after a surprise:

  1. (1987-2000) 1987: We knew the prior bull market was bogus. ?When will inflation return? ?It has to, right?
  2. (1949-56) 1949: Hey, we’re not getting the inflation we expected, and virtually everyone is finding work post-WWII
  3. (1982-7) 1982: The economy is in horrible shape, and?interest rates are way too high. ?We will never recover.
  4. (2009-Present) 2009: The financial sector is in a shambles, government debt is out of control, and the central bank is panicking! ?Everything is falling apart.
Sometimes you win, sometimes you lose...
Sometimes you win, sometimes you lose…

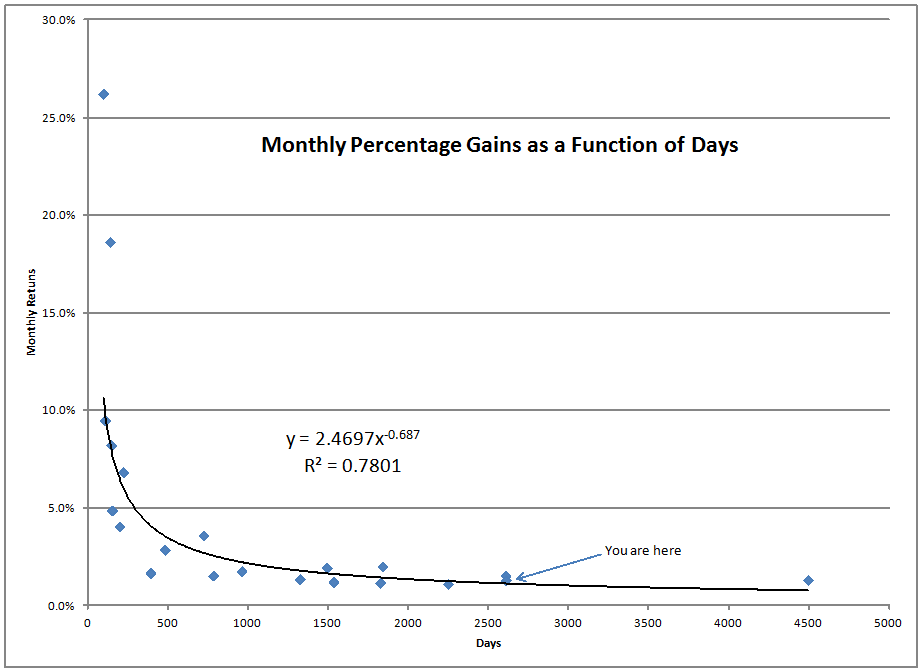
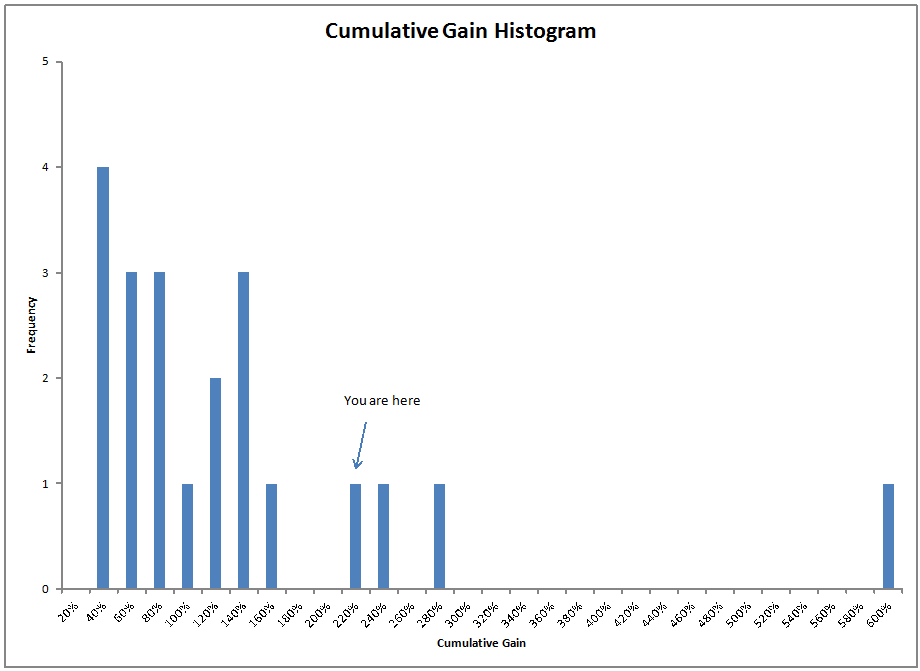
Note the two dots stuck on each other around 2800 days. ?The arrow points to the lower current bull market, versus the higher-returning bull market 1949-1956.

Like bear markets, bull markets also?can be short and sharp, but they can also be long and after the early sharp phase, meander upwards. ?If you look through the earlier articles in this series, you would see that this bull market started as an incredibly sharp phenomenon, and has become rather average in its intensity of monthly returns.

Conclusion

It may be difficult to swallow, but this bull market that is one of the longest since 1928 is pretty average in terms of its monthly average returns for a long bull market. ?It would be difficult for the cost of capital to go much lower from here. ?It would be a little easier for corporate profits to rise from here, but that also doesn’t seem too likely.

Does that mean the bull is doomed? ?Well, yes, eventually… but stranger things have happened, it could persist for some time longer if the right conditions come along.

But that’s not the way I would bet. ?Be careful, and take opportunities to lower your risk level in stocks somewhat.

PS — one difference with the Bloomberg article linked to in the first paragraph, the longest bull market did not begin in 1990 but in 1987. ?There was a correction in 1990 that fell just short of the -20% hurdle at -19.92%, as mentioned in this Barron’s article. ?The money shot:

The historical analogue that matches well with these conditions is 1990. There was a 19.9% drop in the S&P 500, lasting a bit under three months. But the damage to foreign stocks, small-caps, cyclicals, and value stocks in that cycle was considerably more. Both the Russell and the Nasdaq were down 32% to 33%. You might remember United Airlines? failed buyout bid; the transports were down 46%. Foreign stocks were down about 30%.

And then Saddam Hussein invaded Kuwait.

That might have been the final trigger. The broad market top was in the fall of 1989, and most stocks didn?t bottom until Oct. 11, 1990. In the record books, it was a shallow bear market that didn?t even officially meet the 20% definition. But it was a damaging one that created a lot of opportunity for the rest of the 1990s.

FWIW, I remember the fear that existed among many banks and insurance companies that had overlent on?commercial properties in that era. ?The fears led Alan Greenspan to encourage the FOMC to lower rates to… (drumroll) 3%!!! ?And, that experiment together with the one in 2003, which went down to 1.25%, practically led to the idea that the FOMC could lower rates to get out of any ditch… which is now being proven wrong.

Redacted Version of the April 2016 FOMC Statement

Redacted Version of the April 2016 FOMC Statement

Caption from the WSJ: Regulators don?t think it is the place of Congress to second guess how they size up securities. Fed Chairwoman Janet Yellen said recently that legislation would ?interfere with our supervisory judgments.? PHOTO: BAO DANDAN/ZUMA PRESS
PHOTO CREDIT: BAO DANDAN/ZUMA PRESS
March 2016 April 2016 Comments
Information received since the Federal Open Market Committee met in January suggests that economic activity has been expanding at a moderate pace despite the global economic and financial developments of recent months. Information received since the Federal Open Market Committee met in March indicates that labor market conditions have improved further even as growth in economic activity appears to have slowed. FOMC shades GDP down and employment up.
Household spending has been increasing at a moderate rate, and the housing sector has improved further; however, business fixed investment and net exports have been soft. Growth in household spending has moderated, although households’ real income has risen at a solid rate and consumer sentiment remains high. Since the beginning of the year, the housing sector has improved further but business fixed investment and net exports have been soft. Shades down household spending.
A range of recent indicators, including strong job gains, points to additional strengthening of the labor market. A range of recent indicators, including strong job gains, points to additional strengthening of the labor market. No change.
Inflation picked up in recent months; however, it continued to run below the Committee’s 2 percent longer-run objective, partly reflecting declines in energy prices and in prices of non-energy imports. Inflation has continued to run below the Committee’s 2 percent longer-run objective, partly reflecting earlier declines in energy prices and falling prices of non-energy imports. Shades energy prices up, and prices of non-energy imports down.
Market-based measures of inflation compensation remain low; survey-based measures of longer-term inflation expectations are little changed, on balance, in recent months. Market-based measures of inflation compensation remain low; survey-based measures of longer-term inflation expectations are little changed, on balance, in recent months. No change.? TIPS are showing higher inflation expectations since the last meeting. 5y forward 5y inflation implied from TIPS is near 1.73%, up 0.08% from March.? Significant move since February 2016.
Consistent with its statutory mandate, the Committee seeks to foster maximum employment and price stability. Consistent with its statutory mandate, the Committee seeks to foster maximum employment and price stability. No change. Any time they mention the ?statutory mandate,? it is to excuse bad policy.
The Committee currently expects that, with gradual adjustments in the stance of monetary policy, economic activity will expand at a moderate pace and labor market indicators will continue to strengthen. The Committee currently expects that, with gradual adjustments in the stance of monetary policy, economic activity will expand at a moderate pace and labor market indicators will continue to strengthen. No change.
However, global economic and financial developments continue to pose risks. They moved this down two sentences, sort of, as global markets are calmer.
Inflation is expected to remain low in the near term, in part because of earlier declines in energy prices, but to rise to 2 percent over the medium term as the transitory effects of declines in energy and import prices dissipate and the labor market strengthens further. Inflation is expected to remain low in the near term, in part because of earlier declines in energy prices, but to rise to 2 percent over the medium term as the transitory effects of declines in energy and import prices dissipate and the labor market strengthens further. No change. CPI is at +0.9% now, yoy.

Shades inflation down in the short run due to energy prices.

The Committee continues to monitor inflation developments closely. The Committee continues to closely monitor inflation indicators and global economic and financial developments. Adds in monitoring of global economics and finance.
Against this backdrop, the Committee decided to maintain the target range for the federal funds rate at 1/4 to 1/2 percent. Against this backdrop, the Committee decided to maintain the target range for the federal funds rate at 1/4 to 1/2 percent. No change.
The stance of monetary policy remains accommodative, thereby supporting further improvement in labor market conditions and a return to 2 percent inflation. The stance of monetary policy remains accommodative, thereby supporting further improvement in labor market conditions and a return to 2 percent inflation. No change.? They don?t get that policy direction, not position, is what makes policy accommodative or restrictive.
In determining the timing and size of future adjustments to the target range for the federal funds rate, the Committee will assess realized and expected economic conditions relative to its objectives of maximum employment and 2 percent inflation. In determining the timing and size of future adjustments to the target range for the federal funds rate, the Committee will assess realized and expected economic conditions relative to its objectives of maximum employment and 2 percent inflation. No change.
This assessment will take into account a wide range of information, including measures of labor market conditions, indicators of inflation pressures and inflation expectations, and readings on financial and international developments. This assessment will take into account a wide range of information, including measures of labor market conditions, indicators of inflation pressures and inflation expectations, and readings on financial and international developments. No change.? Gives the FOMC flexibility in decision-making, because they really don?t know what matters, and whether they can truly do anything with monetary policy.
In light of the current shortfall of inflation from 2 percent, the Committee will carefully monitor actual and expected progress toward its inflation goal. The Committee expects that economic conditions will evolve in a manner that will warrant only gradual increases in the federal funds rate; the federal funds rate is likely to remain, for some time, below levels that are expected to prevail in the longer run. However, the actual path of the federal funds rate will depend on the economic outlook as informed by incoming data. In light of the current shortfall of inflation from 2 percent, the Committee will carefully monitor actual and expected progress toward its inflation goal. The Committee expects that economic conditions will evolve in a manner that will warrant only gradual increases in the federal funds rate; the federal funds rate is likely to remain, for some time, below levels that are expected to prevail in the longer run. However, the actual path of the federal funds rate will depend on the economic outlook as informed by incoming data. No change.? Says that they will go slowly, and react to new data.? Big surprises, those.
The Committee is maintaining its existing policy of reinvesting principal payments from its holdings of agency debt and agency mortgage-backed securities in agency mortgage-backed securities and of rolling over maturing Treasury securities at auction, and it anticipates doing so until normalization of the level of the federal funds rate is well under way. This policy, by keeping the Committee’s holdings of longer-term securities at sizable levels, should help maintain accommodative financial conditions. The Committee is maintaining its existing policy of reinvesting principal payments from its holdings of agency debt and agency mortgage-backed securities in agency mortgage-backed securities and of rolling over maturing Treasury securities at auction, and it anticipates doing so until normalization of the level of the federal funds rate is well under way. This policy, by keeping the Committee’s holdings of longer-term securities at sizable levels, should help maintain accommodative financial conditions. No change.? Says it will keep reinvesting maturing proceeds of agency debt and MBS, which blunts any tightening.
Voting for the FOMC monetary policy action were: Janet L. Yellen, Chair; William C. Dudley, Vice Chairman; Lael Brainard; James Bullard; Stanley Fischer; Loretta J. Mester; Jerome H. Powell; Eric Rosengren; and Daniel K. Tarullo. Voting for the FOMC monetary policy action were: Janet L. Yellen, Chair; William C. Dudley, Vice Chairman; Lael Brainard; James Bullard; Stanley Fischer; Loretta J. Mester; Jerome H. Powell; Eric Rosengren; and Daniel K. Tarullo. No change. Not quite unanimous.
Voting against the action was Esther L. George, who preferred at this meeting to raise the target range for the federal funds rate to 1/2 to 3/4 percent. Voting against the action was Esther L. George, who preferred at this meeting to raise the target range for the federal funds rate to 1/2 to 3/4 percent. One lonely voice that can think past the current consensus of neoclassical economists.

Comments

  • Policy continues to stall, as the economy muddles along.
  • But policy should be tighter. Savers deserve returns, and that would be good for the economy.
  • The changes for the FOMC?s view are that labor indicators are stronger, and GDP and household spending are weaker.
  • Equities rise and bonds rise. Commodity prices flat and the dollar falls.
  • The FOMC says that any future change to policy is contingent on almost everything.
  • The key variables on Fed Policy are capacity utilization, labor market indicators, inflation trends, and inflation expectations. As a result, the FOMC ain?t moving rates up much, absent much higher inflation, or a US Dollar crisis.
Big Returns, Narrow Doors

Big Returns, Narrow Doors

Photo Credit: Leslie Archard

Every now and then, you will run across a mathematical analysis where if you use a certain screening, trading, or other investment method, it produces a high return in hindsight.

And now, you know about it, because it was just published.

But wait. ?Just published?

Think about what doesn’t get published: financial research that fails, whether for reasons of error or luck.

Now, luck can simply be a question of timing… think of my recent post:?Think Half of a Cycle Ahead. ?What would happen to value investing if you tested it only over the last ten years?

It would be in the dustbin of failed research.

Just published… well… odds are, particularly if the data only goes back a short distance in time, it means that there was likely a favorable macro backdrop giving the idea a tailwind.

There is a different aspect to luck though. ?Perhaps a few souls were experimenting with something like the theory before it was discovered. ?They had excellent returns, and there was a little spread of the theory?via word of mouth and unsavory means like social media and blogs.

Regardless, one of the main reasons the theory worked was that the asset being bought by those using the theory were underpriced. ?Lack of knowledge by institutions and most of the general public was a barrier to entry allowing for superior returns.

When the idea became known by institutions after the initial paper was published, a small flood of money came through the narrow doors, bidding up the asset prices to the point where the theory would not only no longer work, but the opposite of the theory would work for a time, as the overpriced assets had subpar?prospective returns.

Remember how dot-com stocks were inevitable in March of 2000? ?Now those doors weren’t narrow, but they were more narrow than the money that pursued them. ?Such is the end of any cycle, and the reason why average investors get skinned chasing performance.

Now occasionally the doors of a new theory are so narrow that institutions don’t pursue the strategy. ?Or, the strategy is so involved, that even average quants can tell that the data has been tortured to confess that it was born in a place where the universe randomly served up a royal straight flush, but that five-leaf clover got picked and served up as if it were growing everywhere.

Sigh.

My advice to you tonight is simple. ?Be skeptical of complex approaches that worked well in the past and are portrayed as new ideas for making money in the markets. ?These ideas quickly outgrow the carrying capacity of the markets, and choke on their own success.

The easiest way to kill a good strategy is to oversaturate it too much money.

As such, I have respect for those with proprietary knowledge that limit their fund size, and don’t try to make lots of money in the short run by hauling in assets just to drive fees. ?They create their own barriers to entry with their knowledge and self-restraint, and size their ambitions to the size of the narrow doors that they walk through.

To those that use institutional investors, do ask where they will cut off the fund size, and not create any other funds like it that buy the same assets. ?If they won’t give a firm answer, avoid them, or at minimum, keep your eye on the assets under management, and be willing to sell out when they get reeeally popular.

If it were easy, the returns wouldn’t be that great. ?Be willing to take the hard actions such that your managers do something different, and finds above average returns, but limits the size of what they do to serve current clients well.

Then pray that they never decide to hand your money back to you, and manage only for themselves. ?At that point, the narrow door excludes all but geniuses inside.

OPEC and Game Theory

OPEC and Game Theory

Photo Credit: Istvan || Note OPEC HQ in Vienna

Most games in life are cooperative. ?Many are competitive. ?A few are perverse.

That’s what the crude oil market is like today. ?It reminds me of the prisoner’s dilemma. ?In the prisoner’s dilemma, two parties that would benefit from cooperating together tend not to do so because of other incentives that if both follow, they will both end up in a worse place.

This stems from three?problems facing?OPEC [Organization of the Petroleum Exporting Countries].

  1. The Saudis and the Iranians don’t want to take any action that would benefit the other, even if it would help themselves.
  2. It’s virtually impossible to keep member nations in OPEC from cheating, and producing more than their quota.
  3. Thanks to hydraulic fracturing (at least for now) there is enough supply outside of OPEC at inexpensive prices, that if OPEC cut production as a group, it might not gain as much of the benefit as they did in the ’70s and early ’80s.

Factors 1 and 2 interact, because even if there was a credible deal to cut production on the table, the Saudis likely think that the Iranians might cheat and produce more… leaving the Iranians much better off and the Saudis not that much better off.

We have to remember that the neoclassical model of man as a maximizer of utility or profits is often wrong. ?People and nations are envious, and will make do with less if it means those that they dislike are even worse off. ?The Saudis may be burning through their financial reserves quickly, but virtually everyone else in OPEC is worse off. ?The Saudis might think that they can drive a better deal inside OPEC when almost everyone else is desperate.

What this argues for is crude oil prices staying lower for a longer period of time — my guess is between $30 and $50 per barrel of Brent-type crude. ?What could change this?

  • Faster economic growth
  • Turmoil in oil producing regions that reduces supply
  • Depletion of short-life low-cost sources of crude (as is common with hydraulic fracturing)
  • Some clever third parties in OPEC find a way to get the Saudis and Iranians to cooperate while saving face, and no one cheats.

On the other side there is:

  • More cheating within OPEC
  • Weaker growth
  • Higher energy taxes
  • Further technological refinements that lower crude oil production costs further
  • Continued improvements in solar,?wind, and energy storage (primarily battery) technology.

At present, my guess is that the marginal barrels of crude oil are being extracted in North America, and probably will be out to 2020 or so. ?As such, I would encourage energy investors to stick with strong companies with a mix of low debt and cheap production costs. ?Also, look for companies that are misunderstood, that have other businesses away from energy but have been tarred with the low energy price story.

In summary, play it safe while the members of OPEC flounder in a game that they designed for themselves.

Estimating Future Stock Returns, Follow-up

Estimating Future Stock Returns, Follow-up

Idea Credit: Philosophical Economics Blog

Idea Credit: Philosophical Economics Blog

My most recent post,?Estimating Future Stock Returns?was well-received. ?I expected as much. ?I presented it as part of a larger presentation to a session at the Society of Actuaries 2015 Investment Symposium, and a recent meeting of the Baltimore Chapter of the AAII. ?Both groups found it to be one of the interesting aspects of my presentation.

This post is meant to answer three reasonable questions that got posed:

  1. How do you estimate the model?
  2. How do we understand what it is forecasting given multiple forecast horizons seemingly implied by the model?
  3. Why didn’t the model how badly the market would do in 2001 and 2008? ?And I will add 1973-4 for good measure.

Ready? ?Let’s go!

How to Estimate

In his original piece, @Jesse_Livermore freely gave the data and equation out that he used. ?I will do that as well. ?About a year before I wrote this, I corresponded with him by email, asking if he had noticed that the Fed changed some of the data in the series that?his variable used retroactively. ?That was interesting, and a harbinger for what would follow. ?(Strange things happen when you rely on government data. ?They don’t care what others use it for.)

In 2015, the Fed discontinued one of the series that was used in the original calculation. ?I noticed that when the latest Z.1 report came out, and I tried to estimate it the old way. ?That threw me for a loop, and so I tried to re-estimate the relationship using what data was there. ?That led me to do the following:

I tried to get all of them from one source, and could not figure out how to do it. ?The Z.1 report has all four variables in it, but somehow, the Fed’s Data Download Program, which one of my friends at a small hedge fund charitably referred to as “finicky” did not have that series, and somehow FRED did. ?(I don’t get that, but then there are a lot of things that I don’t get. ?This is not one of those times when I say, “Actually, I do get it; I just don’t like it.” ?That said, like that great moral philosopher Lucy van Pelt, I haven’t ruled out stupidity yet. ?To which I add, including my stupidity.)

The variable is calculated like this:

(A + D)/(A + B + C + D)

Not too hard, huh? ?The R-squared is just a touch lower from estimating it the old way… but the difference is not statistically significant. ?The estimation is just a simple ordinary least squares regression using that single variable as the independent variable, and the dependent variable being the total return on the S&P 500.

As an aside, I tested the variable over other forecast horizons, and it worked best over 10-11 years. ?On individual years, the model is most powerful at predicting the next year (surprise!), and gets progressively weaker with each successive individual year.

To make it concrete: you can use this model to forecast the expected returns for 2016, 2017, 2018, etc. ?It won’t be very accurate, but you can do it. ?The model gets more accurate forecasting over a longer period of time, because the vagaries of individual years average out. ?After 10-11 years, the variable is useless, so if I were put in charge of setting stock market earnings assumptions for a pension plan, I would do it as a step function, 6% for the next 10 years, and 9.5% per year thereafter… or in place of 9.5% whatever your estimate is for what the market should return normally.

On Multiple Forecast Horizons

One reader commented:

I would like to make a small observation if I may. If the 16% per annum from Mar 2009 is correct we still have a 40%+ move to make over the next three years. 670 (SPX March 09) growing at 16% per year yields 2900 +/- in 2019. With the SPX at 2050 we have a way to go. If the 2019 prediction is correct, then the returns after 2019 are going to be abysmal.

The first answer would be that you have to net dividends out. ?In March of 2009, the S&P 500 had a dividend yield of around 4%, which quickly fell as the market rose and dividends fell for about one year. ?Taking the dividends into account, we only need to get to 2270 or so by the March?of 2019, works out to 3.1% per year. ?Then add back a dividend yield of about 2.2%, and you are at a more reasonable 5.3%/year.

That said, I would encourage you to keep your eye on the bouncing ball (and sing along with Mitch… does that date me…?). ?Always look at the new forecast. ?Old forecasts aren’t magic — they’re just the best estimate a single point in time. ?That estimate becomes obsolete as conditions change, and people adjust their portfolio holdings to hold proportionately more or less stocks. ?The seven year old forecast may get to its spot in three years, or it may not — no model is perfect, but this one does pretty well.

What of 2001 and 2008? ?(And 1973-4?)

Another reader wrote:

Interesting post and impressive fit for the 10 year expected returns. ?What I noticed in the last graph (total return) is, that the drawdowns from 2001 and 2008 were not forecasted at all. They look quite small on the log-scale and in the long run but cause lot of pain in the short run.

Markets have noise, particularly during bear markets. ?The market goes up like an escalator, and goes down like an elevator. ?What happens in the last year of a ten-year forecast is a more severe version of what the prior questioner asked about the 2009 forecast of 2019.

As such, you can’t expect miracles. ?The thing that is notable is how well this model did versus alternatives, and you need to look at the graph in this article to see it (which was at the top of the last piece). ?(The logarithmic graph is meant for a different purpose.)

Looking at 1973-4, 2001-2 and 2008-9, the model missed by 3-5%/year each time at the lows for the bear market. ?That is a big miss, but it’s a lot smaller than other models missed by, if starting 10 years earlier. ?That said, this model would have told you prior to each bear market that future rewards seemed low — at 5%, -2%, and 5% respectively for the ?next ten years.

Conclusion

No model is perfect. ?All models have limitations. ?That said, this one is pretty useful if you know what it is good for, and its limitations.

Estimating Future Stock Returns

Estimating Future Stock Returns

Idea Credit: Philosophical Economics Blog
Idea Credit: Philosophical Economics, but I?estimated and designed the?graphs

There are many alternative models for attempting to estimate how undervalued or overvalued the stock market is. ?Among them are:

  • Price/Book
  • P/Retained Earnings
  • Q-ratio (Market Capitalization of the entire market /?replacement cost)
  • Market Capitalization of the entire market / GDP
  • Shiller?s CAPE10 (and all modified versions)

Typically these explain 60-70% of?the variation in stock returns. ?Today I can tell you there is a better model, which is not mine, I found it at the blog?Philosophical Economics.? The basic idea of the model is this: look at the proportion of US wealth held by private investors in stocks using the?Fed?s Z.1 report. The higher the proportion, the lower future returns will be.

There are two aspects of the intuition here, as I see it: the simple one is that when ordinary people are scared and have run from stocks, future returns tend to be higher (buy panic). ?When ordinary people are buying stocks with both hands, it is time to sell stocks to them, or even do IPOs to feed them catchy new overpriced stocks (sell greed).

The second intuitive way to view it is that it is analogous to Modiglani and Miller’s capital structure theory, where assets return the same regardless of how they are financed with equity and debt. ?When equity is a small component as?a percentage of market value, equities will return better than when it is a big component.

What it Means Now

Now, if you look at the graph at the top of my blog, which was estimated back in mid-March off of year-end data, you can notice a few?things:

  • The formula explains more than 90% of the variation in return over a ten-year period.
  • Back in March of 2009, it estimated returns of 16%/year over the next ten years.
  • Back in March of 1999, it estimated returns of -2%/year over the next ten years.
  • At present, it forecasts returns of 6%/year, bouncing back from an estimate of around 4.7% one year ago.

I have two more graphs to show on this. ?The first one below is showing the curve as I tried to fit it to the level of the S&P 500. ?You will note that it fits better at the end. ?The reason for that it is?not a total return index and so the difference going backward in time are the accumulated dividends. ?That said, I can make the statement that the S&P 500 should be near 3000 at the end of 2025, give or take several hundred points. ?You might say, “Wait, the graph looks higher than that.” ?You’re right, but I had to take out the anticipated dividends.

The next graph shows the fit using a homemade total return index. ?Note the close fit.

Implications

If total returns from stocks are only likely to be 6.1%/year (w/ dividends @ 2.2%) for the next 10 years, what does that do to:

  • Pension funding / Retirement
  • Variable annuities
  • Convertible bonds
  • Employee Stock Options
  • Anything that relies on the returns from stocks?

Defined benefit pension funds are expecting a lot higher returns out of stocks than 6%. ?Expect funding gaps to widen further unless contributions increase. ?Defined contributions face the same problem, at the time that the tail end of the Baby Boom needs returns. ?(Sorry, they *don’t* come when you need them.)

Variable annuities and high-load mutual funds take a big bite out of scant future returns — people will be disappointed with the returns. ?With convertible bonds, many will not go “into the money.” ?They will remain bonds, and not stock substitutes. ?Many employee stock options and stock ownership plan will deliver meager value unless the company is hot stuff.

The entire capital structure is consistent with low-ish?corporate bond yields, and low-ish volatility. ?It’s a low-yielding environment for capital almost everywhere. ?This is partially due to the machinations of the world’s central banks, which have tried to stimulate the economy by lowering rates, rather than letting recessions clear away low-yielding projects that are unworthy of the capital that they employ.

Reset Your Expectations and Save More

If you want more at retirement, you will have to set more aside. ?You could take a chance, and wait to see if the market will sell off, but valuations today are near the 70th percentile. ?That’s high, but not nosebleed high. ?If this measure got to levels 3%/year returns, I would hedge my positions, but that would imply the S&P 500 at around?2500. ?As for now, I continue my ordinary investing posture. ?If you want, you can do the same.

=–==-=-=-=-=-=–=-=-=-=-=-=-=-=-=-=-=-=-=-=-=-=-==–=

PS — for those that like to hear about little things going on around the Aleph Blog, I would point you to this fine website that has started to publish some of my articles in Chinese. ?This article?is particularly amusing to me with my cartoon character illustrating points. ?This is the English article that was translated. ?Fun!

Think Half of a Cycle Ahead

Think Half of a Cycle Ahead

Photo Credit: Robert Tuck || Of course, in half a cycle here, the moon will look the same


Financial markets are trendy and?noisy in the short-run, sensible in the long-run, and perverse in the intermediate-term.

What do I mean?

Something like this:?short-run movements are news-driven, and driven by people trying to catch up with the latest data. ?Many people imitate the behavior of others, and over the intermediate-term, some stock prices get out of whack. ?Some subset of industries, factors, and/or companies gets out of alignment, and are mispriced. ?In the long run, those pricing errors get corrected, but it takes years to get there.

Here’s an example. to make this tangible and understandable. ?As a factor, value has been bad for eight years or so, and as evidence I quote?Rob Arnott, from his article entitled, ?How Can ?Smart Beta? Go Horribly Wrong??

The value effect was first identified in the late 1970s, notably by Basu (1977), in the aftermath of the Nifty Fifty bubble, a period when value stocks were becoming increasingly expensive, priced at an ever-skinnier discount relative to growth stocks. More recently, for the past eight years, value investing has been a disaster with the Russell 1000 Value Index underperforming the S&P 500 by 1.6% a year, and the Fama?French value factor in large-cap stocks returning ?4.8% annually over the same period. But, the value effect is far from dead! In fact, it?s in its cheapest decile in history.

And then later he says:

How many practitioners who rely on the value factor take the time to gauge whether the factor is expensive or cheap relative to historical norms? If they took the time to do so today, they would find value is currently cheaper than at any time other than the height of the Nifty Fifty (1972?73), the tech bubble (1998?2003), and the global financial crisis (2008?09).

The underlining is mine, to give emphasis. Now I would like to quote from a very old article of mine, The Fundamentals of Market Tops that was originally published at RealMoney.com back in 2004:

You?ll know a market top is probably coming when:

a) The shorts already have been killed. You don?t hear about them anymore. There is general embarrassment over investments in short-only funds.

b) Long-only managers are getting butchered for conservatism. In early 2000, we saw many eminent value investors give up around the same time. Julian Robertson, George Vanderheiden, Robert Sanborn, Gary Brinson and Stanley Druckenmiller all stepped down shortly before the market top.

Point (b) is what I want to highlight? not that we have had many value managers forced into retirement recently, but value funds of all kinds have been losing clients. It?s like being fired fractionally, a sliver at a time, but it adds up to a lot.

Combine that with Arnott?s insight that the valuations of value stocks are at exceptionally low levels ? this gives me some hope that we are in the seventh inning or later in this market cycle regarding value investing.

Going Back a Step

Value isn’t the only cheap area presently — European stocks and emerging market stocks look cheap as well. ?When areas of the market with bad relative performance have a lot of people giving up on them to pursue recently successful strategies, that?helps to put in the bottom on the underperformers, and the top on the outperformers.

You can’t tell exactly when the process will end, but those jumping from one strategy to another, chasing performance, will just add a new set of losses to the old ones. ?The trick is to try to anticipate when the cycle will turn for a given market strategy, factor or industry. ?No one can do it perfectly, but it makes sense to act when relative valuations are in your favor.

Minimally, those that stick with a valid strategy through thick and thin can benefit from the strategy over the long-term… and that takes some courage, because there are times when your strategy will be out of favor. ?That’s what I do with value investing.

Maximally, you would sell a?strategy that you were invested in that was topping out in relative terms to buy a strategy?that has been trashed for a while, and might be ready to outperform. ?That’s even more difficult than sticking with one strategy through thick and thin. ?Everyone wants to buy a past winner, and nobody wants to buy a past loser. but that is what would offer large returns if the timing could be right. ?Another way of phrasing it, is to always look half a cycle ahead, to where a strategy will be when the excesses correct, or as is more likely, overcorrect, and take the appropriate action now.

Doing that is beyond me. ?I’m just grateful that the period of relative underperformance of value may be nearing its end.

If All Investments Were Private

If All Investments Were Private

Photo Credit: Falcon? Photography
Photo Credit: Falcon? Photography? || In this story, TSB stands for “The Storage Bank”

This piece is another one of my experiments, please bear with me.

“Measure Twice, Cut Once” — A very intelligent woman (I suspect) whose name never got recorded the first time it was uttered

“Only buy something that you?d be perfectly happy to hold if the market shut down for 10 years.” — Warren Buffett

Imagine for a moment:

  • The public secondary markets didn’t exist
  • Investment pooling vehicles were all private, and no one published NAV estimates
  • Stocks and bonds existed, but they were only formally offered through the companies themselves, and all private secondary trading was subject to a right of first refusal on the part of the issuing corporation. ?This includes short-term debts like commercial paper.
  • Banks and life insurance companies still offer products to retail savers/investors, but nonforfeiture laws didn’t exist, and CD penalty clauses were very ugly. ?In other words, because of no public secondary markets, the price of liquidity was very high, with a strong incentive to hold financial instruments to their maturity date.
  • Accounting rules are only partially standardized.
  • Deposit insurance still exists.
  • So does limited liability.

In this thankfully fictitious world, what would investing be like?

The main factor would be that liquidity would be dear. ?Because the “out” doors for liquidity are thin or closed for a long time, money would go into any investment only after great study. ?The 4 Cs of credit would be present with a vengeance –?character, capacity, capital and conditions — and character would be chief among them as J. P. Morgan famously said.

This would be true even if one were investing in the stock of a firm, rather than the debt. ?Investing in such a world, even with limited liability, is tantamount to an economic marriage back in a time where divorce was mostly for cause, and not easy to get.

You’d have to be very certain of what you were doing. ?Perhaps you would diversify, but one would quickly realize how difficult it can be to keep up with a bunch of private firms — we take for granted how information flows today, but with private firms, you are subject to the board and management. ?What do they choose to share with outside passive minority investors?

Excursus: It is said that it is easy to teach a child to say “please,” because it is the equivalent of “gimme.” ?It is harder to teach them “thank you,” until they realize that it means, “I’d like an option on the next deal.”

Why would private firms choose to be open with outside private minority investors? ?They want a continuing flow of capital, and with no secondary markets, that can be difficult. ?Granted, there are always hucksters that say with P. T. Barnum, who is alleged to have said, “There’s a sucker born every minute.” ?Those characters exist regardless of market structure, but in a healthy culture, they are a small minority in the markets.

The same would apply to the debt markets. ?The fourth C, Conditions, would also impact matters. ?If you can’t get out easily/cheaply, then you will limit the term of the borrowing at which you are willing to lend, unless there are features allowing for participation in the upside, such as stock conversion rights.

You might also find that insolvency becomes a very personal matter, as prior capital providers who know the business better than others, are invited to “prepackaged reorganizations” when the business is illiquid or insolvent. ?The bankruptcy code might still exist, but gaining enough data on a firm in trouble would probably prove difficult. The board and management, unless legally?compelled, might not find it in their interests to be open. ?Control is a valuable option, one that is only surrendered when the situation is virtually hopeless.

That said, a man very good at estimating character and business value could make some amazing profits, because “in the land of the blind, a one-eyed man is king.” ?And, the opposite would be true for many, as they get taken advantage of by less scrupulous management teams.

Back to the Present

“…[R]isk control is best done on the front end. ?On the back end, solutions are expensive, if they are available at all.” ?– Me, in this article, and a bunch of others.

The purpose of what I just wrote is to get you to think about an illiquid world as a limiting concept. ?All of the problems of our world are there, usually in a form that is less severe than we experience because of the benefit of liquid secondary markets and vehicles for diversification.

If valuable for no other reason, market panics make liquidity disappear, and it is useful to think about what you will do in an absence of liquidity before the time of trouble happens. ?The same is true of corporations needing liquidity. ?Buffett said something to the effect of, “Get financing before you need it; it may not be available later.”

It’s also useful to consider more carefully the financial commitments that you make, so that you don’t make so many blunders. ?(True for me, too.) ?The ability to trade out of investments is useful but limited, because we don’t always recognize when we are wrong, and mechanical trading rules can lead us to the “death by one thousand cuts.”

Beyond that, realize that character does matter. ?A lot. ?The government tries as hard as it can, but it is far better at punishing fraud after the fact than it is catching fraud before the fact. ?It will always be that way because the law is tilted in favor of the one in control; it has to be, or property rights are meaningless. ?But consider those that try to warn about financial disasters — they do not get listened to until it is too late. ?Madoff, Enron, housing bubble, various short sellers alleging improprieties, etc., etc. ?Very few listen to them, because seeming success talks far louder than an outsider.

My counsel is the same as always, just look at the risk control quote above. ?But to make it stark, ask yourself this, a la Buffett, “Would you still buy this if you couldn’t sell it for ten years?” ?Then measure twice, thrice, ten times if needed, and cut once.

Theme: Overlay by Kaira