
There are many alternative models for attempting to estimate how undervalued or overvalued the stock market is. ?Among them are:
- Price/Book
- P/Retained Earnings
- Q-ratio (Market Capitalization of the entire market /?replacement cost)
- Market Capitalization of the entire market / GDP
- Shiller?s CAPE10 (and all modified versions)
Typically these explain 60-70% of?the variation in stock returns. ?Today I can tell you there is a better model, which is not mine, I found it at the blog?Philosophical Economics.? The basic idea of the model is this: look at the proportion of US wealth held by private investors in stocks using the?Fed?s Z.1 report. The higher the proportion, the lower future returns will be.
There are two aspects of the intuition here, as I see it: the simple one is that when ordinary people are scared and have run from stocks, future returns tend to be higher (buy panic). ?When ordinary people are buying stocks with both hands, it is time to sell stocks to them, or even do IPOs to feed them catchy new overpriced stocks (sell greed).
The second intuitive way to view it is that it is analogous to Modiglani and Miller’s capital structure theory, where assets return the same regardless of how they are financed with equity and debt. ?When equity is a small component as?a percentage of market value, equities will return better than when it is a big component.
What it Means Now
Now, if you look at the graph at the top of my blog, which was estimated back in mid-March off of year-end data, you can notice a few?things:
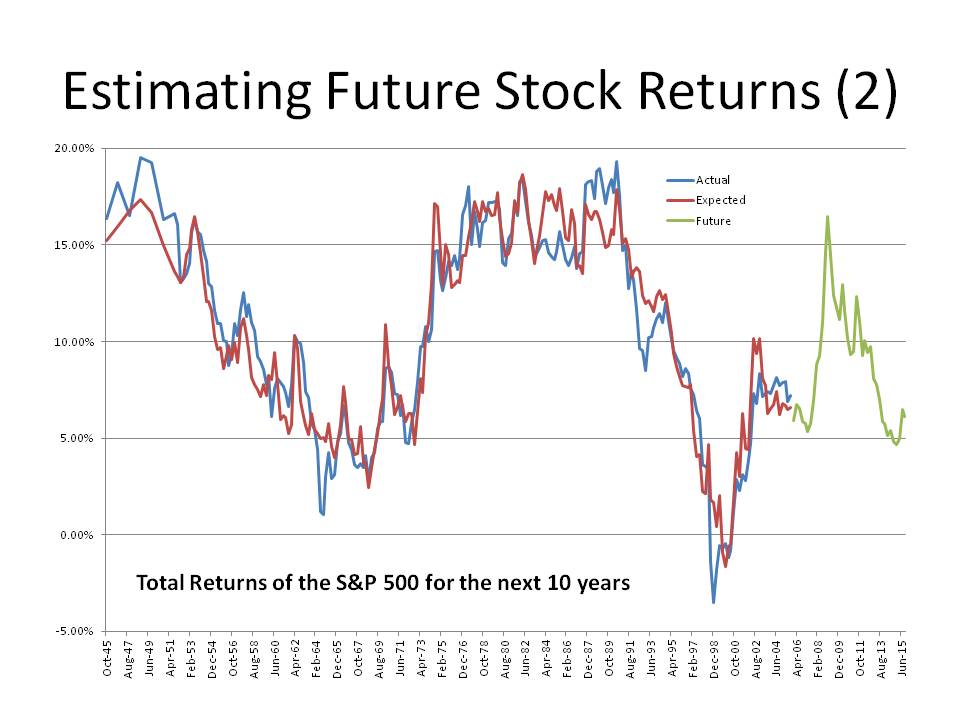
- The formula explains more than 90% of the variation in return over a ten-year period.
- Back in March of 2009, it estimated returns of 16%/year over the next ten years.
- Back in March of 1999, it estimated returns of -2%/year over the next ten years.
- At present, it forecasts returns of 6%/year, bouncing back from an estimate of around 4.7% one year ago.
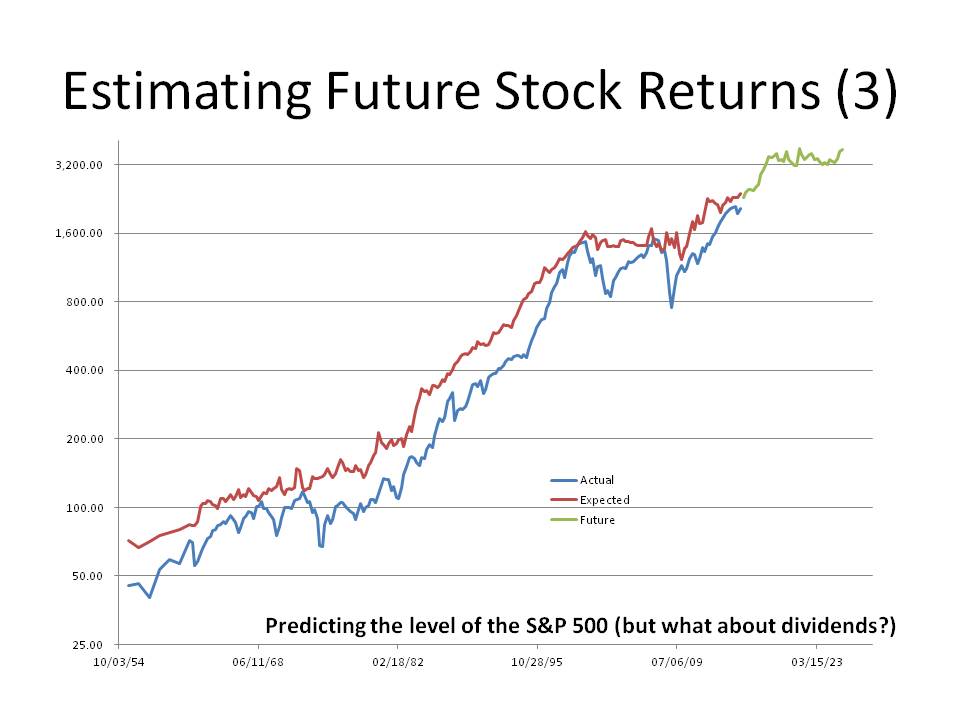
I have two more graphs to show on this. ?The first one below is showing the curve as I tried to fit it to the level of the S&P 500. ?You will note that it fits better at the end. ?The reason for that it is?not a total return index and so the difference going backward in time are the accumulated dividends. ?That said, I can make the statement that the S&P 500 should be near 3000 at the end of 2025, give or take several hundred points. ?You might say, “Wait, the graph looks higher than that.” ?You’re right, but I had to take out the anticipated dividends.
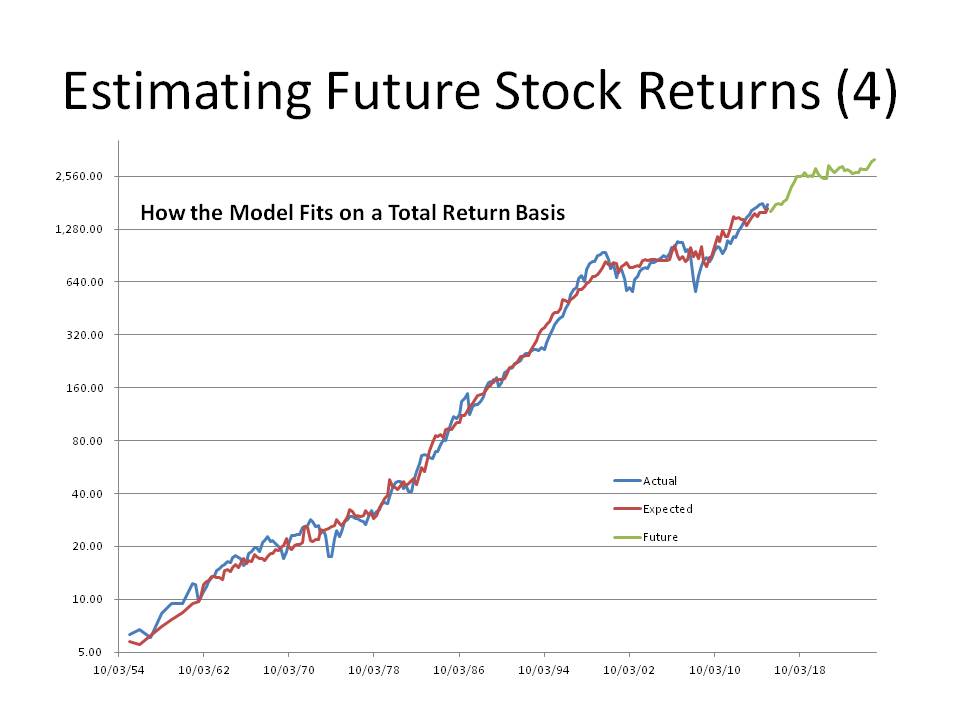
The next graph shows the fit using a homemade total return index. ?Note the close fit.
Implications
If total returns from stocks are only likely to be 6.1%/year (w/ dividends @ 2.2%) for the next 10 years, what does that do to:
- Pension funding / Retirement
- Variable annuities
- Convertible bonds
- Employee Stock Options
- Anything that relies on the returns from stocks?
Defined benefit pension funds are expecting a lot higher returns out of stocks than 6%. ?Expect funding gaps to widen further unless contributions increase. ?Defined contributions face the same problem, at the time that the tail end of the Baby Boom needs returns. ?(Sorry, they *don’t* come when you need them.)
Variable annuities and high-load mutual funds take a big bite out of scant future returns — people will be disappointed with the returns. ?With convertible bonds, many will not go “into the money.” ?They will remain bonds, and not stock substitutes. ?Many employee stock options and stock ownership plan will deliver meager value unless the company is hot stuff.
The entire capital structure is consistent with low-ish?corporate bond yields, and low-ish volatility. ?It’s a low-yielding environment for capital almost everywhere. ?This is partially due to the machinations of the world’s central banks, which have tried to stimulate the economy by lowering rates, rather than letting recessions clear away low-yielding projects that are unworthy of the capital that they employ.
Reset Your Expectations and Save More
If you want more at retirement, you will have to set more aside. ?You could take a chance, and wait to see if the market will sell off, but valuations today are near the 70th percentile. ?That’s high, but not nosebleed high. ?If this measure got to levels 3%/year returns, I would hedge my positions, but that would imply the S&P 500 at around?2500. ?As for now, I continue my ordinary investing posture. ?If you want, you can do the same.
=–==-=-=-=-=-=–=-=-=-=-=-=-=-=-=-=-=-=-=-=-=-=-==–=
PS — for those that like to hear about little things going on around the Aleph Blog, I would point you to this fine website that has started to publish some of my articles in Chinese. ?This article?is particularly amusing to me with my cartoon character illustrating points. ?This is the English article that was translated. ?Fun!
I would like to make a small observation if I may. If the 16% per annum from Mar 2009 is correct we still have a 40%+ move to make over the next three years. 670 (SPX March 09) growing at 16% per year yields 2900 +/- in 2019. With the SPX at 2050 we have a way to go. If the 2019 prediction is correct, then the returns after 2019 are going to be abysmal.
Whew, for a rank amateur, finding the data source is tough. Following your summary prescription, “look at the proportion of US wealth held by private investors in stocks,” is it these rows in the Z.1 Summary Table L.6 “Assets and Liabilities of the Personal Sector”:
( 16 Corporate equities
+ 17 Mutual fund shares)
divided by
1 Total financial assets
?
Or is that close enough of a metric to follow? I had trouble trying to derive anything from the source posting, yours seems clearer.
Thanks.
(For reference, Z.1 found here: https://www.federalreserve.gov/releases/z1/current/ )
Here is the data used: https://research.stlouisfed.org/fred2/graph/?g=qis
Not quite. I’ll have a post on this soon, because my implementation is a little different than Philosophical Economics. Like him, I want to share it, so that others can work with it, critique it, etc.
What about crisis? Nobody expects it. How to do it when nobody will?
Hi David,
How does the model perform when forecasting inflation-adjusted returns? Also, is there a similar statistic available from other central banks to evaluate this model’s accuracy in other stock markets?
I don’t forecast inflation-adjusted returns. I forecast inflation separately using a different sort of model. I think that forecasting real returns is a little loopy, because inflation and stock returns come from different processes.
Your second question is interesting. I have no idea.
Very informative post.
Hi David,
I believe both, the framework and the analysis, are compatible with a future period of high volatility, not of low volatility: equities overhang, performance dissapointment, monetary policy pushed up to its limits, and, most importantly, the proliferation of low-yielding projects that are unworthy of the capital that they employ.
Why did you came to think that low volatility is more likely?
Thx & best,
Nico
This method assumes nothing about volatility. That’s your own thought. This model merely looks at what others are doing, and forecasts higher returns when the retail public is less invested in stocks, and lower returns when the retail public is more invested in stocks.
There have been periods of high and low volatility from 1945, when this data series started. The formula has worked in both.
David,
Sorry if I missinterpreted you. I thought you were “predicting” low volatility after: “The entire capital structure is consistent with low-ish corporate bond yields, and low-ish volatility.”.
Thx for your prompt response.
Best,
Nico
Hi David
Interesting post and impressive fit for the 10 year expected returns.
What I noticed in the last graph (total return) is, that the drawdowns from 2001 and 2008 were not forecasted at all. They look quite small on the log-scale and in the long run but cause lot of pain in the short run.