
This is the fourth article in this series, and is here because the S&P 500 is now in its second-longest bull market since 1928, having just passed the bull market that ended in 1956.? ? Yeah, who’da thunk it?
This post is a little different from the first three articles, because I got the data to extend the beginning of my study from 1950 to 1928, and I standardized my turning points using the standard bull and bear market definitions of a 20% rise or fall from the last turning point. ?You can see my basic data to the left of this paragraph.
Before I go on, I want to show you two graphs dealing with bear markets:
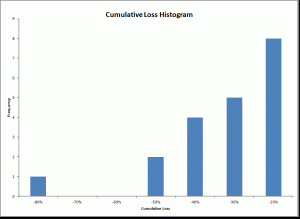
As you can see from the first graph, small bear markets are much more common than large ones. ?Really brutal bear markets like the biggest one in the Great Depression were so brutal that there is nothing to compare it to — financial leverage collapsed that had been encouraged by government policy, the Fed, and a speculative mania among greedy people.
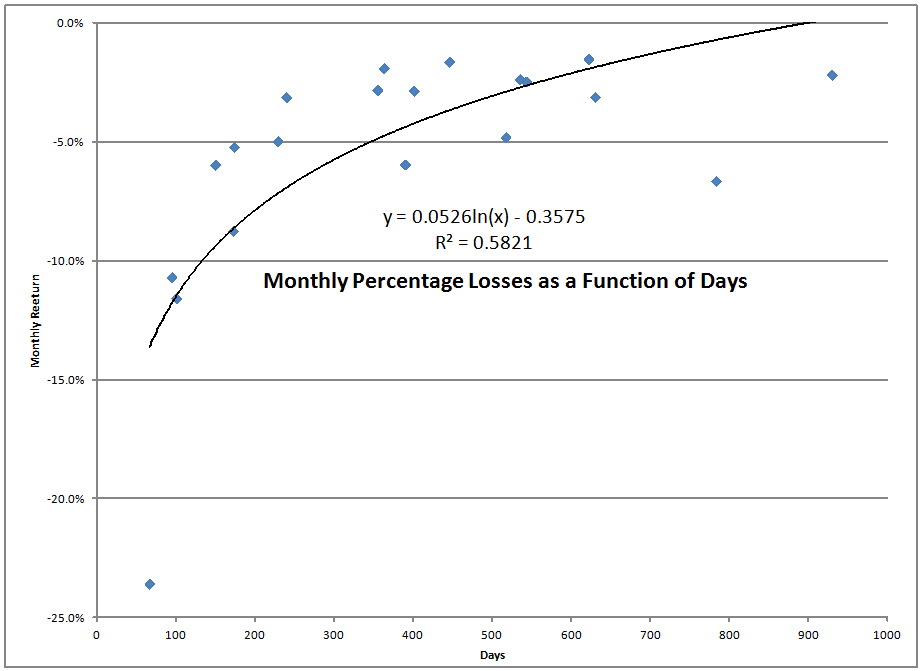
The second graph tells the same story in a different way. ?Bear markets are often short and sharp. ?They don’t last long, but the intensity in term of the speed of declines is a little more than?twice as fast as the rises of bull markets. ?If it weren’t for the fact that bull markets last more than three times as long on average, the sharp drops in bear markets would be enough to keep everyone out of the stock market.
Instead, it just keeps many people out of the market, some entirely, but most to some degree that would benefit them.
Oh well, on to the gains:
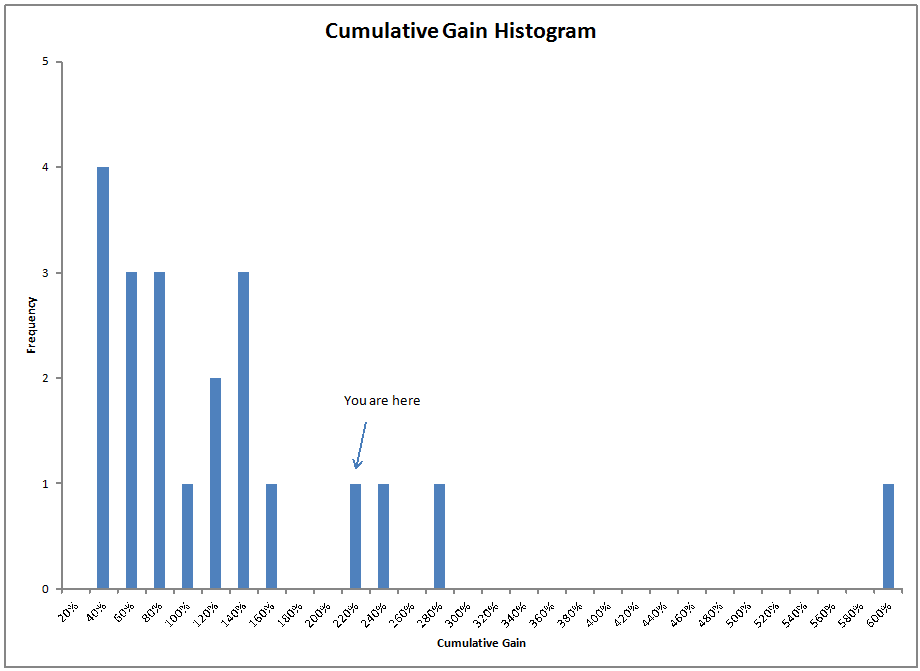
Like bear markets, most bull markets are small. ?The likelihood of a big bull market declines with size. ?The current bull market is the fourth largest, and the one that it passed in duration was the second largest. ?As an aside, each of the four largest bull markets came after a surprise:
- (1987-2000) 1987: We knew the prior bull market was bogus. ?When will inflation return? ?It has to, right?
- (1949-56) 1949: Hey, we’re not getting the inflation we expected, and virtually everyone is finding work post-WWII
- (1982-7) 1982: The economy is in horrible shape, and?interest rates are way too high. ?We will never recover.
- (2009-Present) 2009: The financial sector is in a shambles, government debt is out of control, and the central bank is panicking! ?Everything is falling apart.
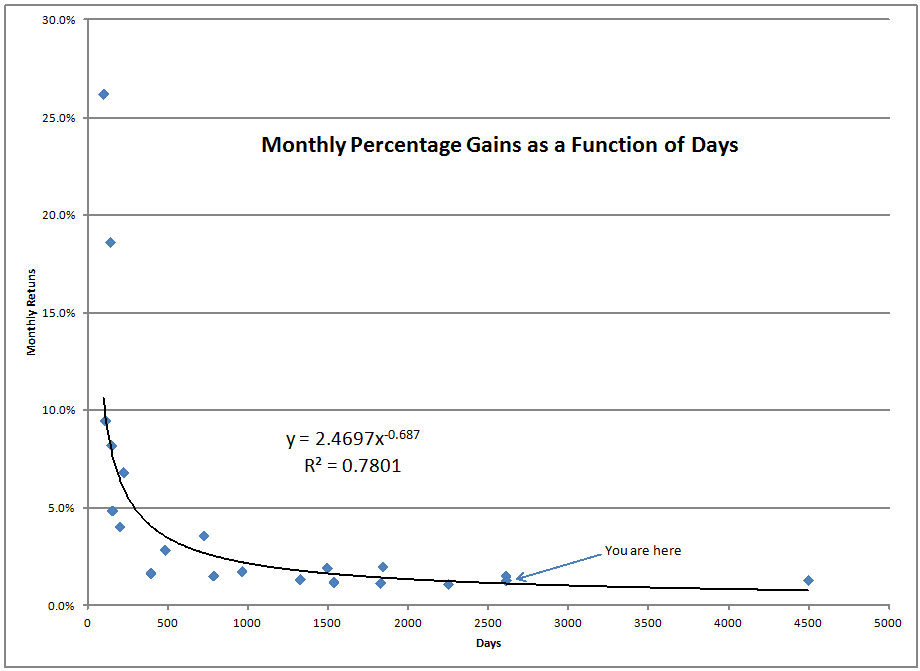
Note the two dots stuck on each other around 2800 days. ?The arrow points to the lower current bull market, versus the higher-returning bull market 1949-1956.
Like bear markets, bull markets also?can be short and sharp, but they can also be long and after the early sharp phase, meander upwards. ?If you look through the earlier articles in this series, you would see that this bull market started as an incredibly sharp phenomenon, and has become rather average in its intensity of monthly returns.
Conclusion
It may be difficult to swallow, but this bull market that is one of the longest since 1928 is pretty average in terms of its monthly average returns for a long bull market. ?It would be difficult for the cost of capital to go much lower from here. ?It would be a little easier for corporate profits to rise from here, but that also doesn’t seem too likely.
Does that mean the bull is doomed? ?Well, yes, eventually… but stranger things have happened, it could persist for some time longer if the right conditions come along.
But that’s not the way I would bet. ?Be careful, and take opportunities to lower your risk level in stocks somewhat.
PS — one difference with the Bloomberg article linked to in the first paragraph, the longest bull market did not begin in 1990 but in 1987. ?There was a correction in 1990 that fell just short of the -20% hurdle at -19.92%, as mentioned in this Barron’s article. ?The money shot:
The historical analogue that matches well with these conditions is 1990. There was a 19.9% drop in the S&P 500, lasting a bit under three months. But the damage to foreign stocks, small-caps, cyclicals, and value stocks in that cycle was considerably more. Both the Russell and the Nasdaq were down 32% to 33%. You might remember United Airlines? failed buyout bid; the transports were down 46%. Foreign stocks were down about 30%.
And then Saddam Hussein invaded Kuwait.
That might have been the final trigger. The broad market top was in the fall of 1989, and most stocks didn?t bottom until Oct. 11, 1990. In the record books, it was a shallow bear market that didn?t even officially meet the 20% definition. But it was a damaging one that created a lot of opportunity for the rest of the 1990s.
FWIW, I remember the fear that existed among many banks and insurance companies that had overlent on?commercial properties in that era. ?The fears led Alan Greenspan to encourage the FOMC to lower rates to… (drumroll) 3%!!! ?And, that experiment together with the one in 2003, which went down to 1.25%, practically led to the idea that the FOMC could lower rates to get out of any ditch… which is now being proven wrong.

David,
re your PS on 1990, a similar case can be made that the current bull market did not begin until October 2011. The S&P lost 19.4% on a closing basis and over 20% on an intraday basis and many of the other markets like the Russel 2000 and equal-rated S&P lost more than 20% as well.
If you recall, things felt pretty scary at that time as well.
On that basis, the bull market can be considered four and half years old, which could imply the current bull has longer to run than most people think.
That’s a good point. There are a couple of other incidents like it as well — 1998 and 1978.