
I was reading through The Wall Street Journal’s Daily Shot column, done by the estimable @SoberLook, and saw the following graph and text:
The S&P 500 move this year is completely outside the historical seasonal trends.
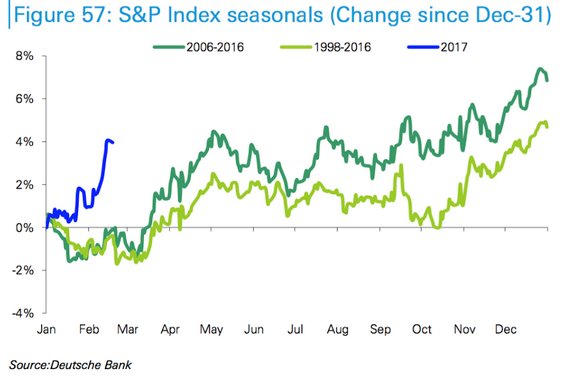
Averages reveal, but they also conceal. ?When I look at a graph like this, I know that any given year is highly likely to look different than an average of years. ?So, no surprise that the returns on the S&P 500 are different than the averages of the prior 11 or 19 years.
But how has the S&P 500 fared versus the last 68 years? ?At present this year is 20th out of 68, which is good, but not great or average. ?But look at the graph at the top of this article: up until the close of the 25th trading day of the year (February 7th) the market had performance very much like a median year. ?All of the higher performance has come out of the last nine days. ?(For fun, it is the ninth best out of 68 for that time of year; even that is not top decile.)
I can tell you something easy: you can have a lot of different occurrences over nine days in the market. ?The distribution of returns would be quite wide. ?Therefore, don’t get too excited about the returns so far this year — they aren’t that abnormal. ?You can be concerned as you like about valuation levels — they are high. ?But 2017 at present is a “high side of normal” year compared to past price performance.
And, if you want to be concerned about a melt-up, it is this kind of low positive momentum that tends to persist, at least for a while. ?Trading behavior isn’t nuts, even if valuations are somewhat steamy.
I’m around 83% invested in equity accounts, so I am conservative, but I’m not thinking of hedging yet. ?Let the rally run.
Hi David
Whether the market is too highly valued or not haunts the mind of every investor today. But I must admit that I cannot see the trees in the forest anymore. The main issue here is the one you touch, namely is it all comparable? So, just a few issues that trouble my mind:
– the market behaved differently before and after the recession in the eighties (ex. the mean average of the Dow was about 2000 till the fifties, moved to 8000 in the sixties and fell back to 2000 in the eighties and then it surged right up to 18000)
– after the eighties one of the main drivers of asset valuation, the interest rate, showed a constant downtrend, one which seems to have come to the end of its journey – alephblog.com/2017/02/22/good-not-average-not-great/#comments
– over all those years the composition of the stock market has changed and how was the level impacted by it
not truly relevant but indicative is this – http://www.investopedia.com/articles/basics/06/alookback.asp
– and what about regulation? decimalization, short bans, uptick rules, circuit brakers … all since the year 2000
– and more
Correlation coefficient with the the passage of time is nearly zero — -1.2%. By year:
1975 ~~ 15.96%
1987 ~~ 15.87%
1991 ~~ 13.15%
1976 ~~ 11.56%
1997 ~~ 10.24%
1985 ~~ 9.65%
1967 ~~ 9.34%
1980 ~~ 8.36%
1961 ~~ 7.87%
1989 ~~ 7.79%
2012 ~~ 6.67%
1983 ~~ 6.58%
1971 ~~ 6.13%
1963 ~~ 6.11%
1998 ~~ 6.07%
2011 ~~ 5.59%
1951 ~~ 5.1%
1995 ~~ 4.98%
1986 ~~ 4.85%
2017 ~~ 4.76%
1996 ~~ 4.39%
1972 ~~ 3.86%
1954 ~~ 3.65%
1999 ~~ 3.59%
2013 ~~ 3.39%
1950 ~~ 3.24%
2004 ~~ 3.21%
2007 ~~ 2.9%
1964 ~~ 2.7%
2015 ~~ 2.53%
1988 ~~ 2.22%
1965 ~~ 2.16%
1958 ~~ 2.08%
1979 ~~ 2.01%
2006 ~~ 1.12%
1994 ~~ 1.05%
1966 ~~ .52%
2014 ~~ .43%
1955 ~~ .24%
2005 ~~ -.04%
1993 ~~ -.27%
2001 ~~ -.34%
1962 ~~ -.52%
1956 ~~ -1.42%
1952 ~~ -1.85%
1959 ~~ -2.06%
1992 ~~ -2.16%
2010 ~~ -2.2%
1973 ~~ -3.11%
1969 ~~ -3.16%
2016 ~~ -3.34%
1953 ~~ -3.65%
2002 ~~ -4.91%
1984 ~~ -5.06%
1977 ~~ -5.68%
1974 ~~ -5.69%
1957 ~~ -5.93%
1970 ~~ -5.98%
2008 ~~ -6.02%
1968 ~~ -6.03%
1978 ~~ -6.25%
1960 ~~ -6.86%
1981 ~~ -7.14%
1990 ~~ -7.5%
2000 ~~ -7.5%
1982 ~~ -7.76%
2003 ~~ -7.91%
2009 ~~ -17.36%
More to the point, trying to draw any inference from a few days data is pointless. I assume the WSJ is trying to make a point about how great the economy is at the moment – and some people will believe them – but they certainly know better than to suggest a trend from so little data. However, this stuff obviously sells.