Category: Academic Finance

Book Reviews — The Alchemy of Finance, and Soros on Soros

Book Reviews — The Alchemy of Finance, and Soros on Soros

One trap you can fall into in life is to not learn from those that you disagree with, for one reason or another. George Soros would be an example of that. His politics are very different from mine, as well as his religious views. He’s a far more aggressive investor than I am as well. I am to hit singles with high frequency over the intermediate term. He played themes to hit home runs.

The Alchemy of Finance made a big impression on me 15 years ago. Perhaps it was a book that was in the right place at the right time. It helped to crystallize a number of questions that I had about economics as it is commonly taught in the universities of the US.

First, a little about me and economics. I passed my Ph. D. oral exams, but did not receive a Ph. D., because my dissertation fell apart. Two of my three committee members left, and the one that was left didn’t understand my dissertation. What was worse, I had moral qualms with my dissertation, because I knew it would not get approved.

My dissertation did not prove anything. All of my pointed to results that said, “We’re sorry, but we don’t know anything more as a result of your work here.” I have commented before that the social sciences would be better off if we did publish results that said: don’t look here — nothing going on here. But no, and many grad students in a similar situation would falsify their data and publish. I couldn’t do that. I also couldn’t restart, because I had put off the wedding long enough, so for my wife’s sake, I punted, and became an actuary.

That said, I was a skeptical graduate student, and not very happy with much of the common theories; I wondered whether cultural influences played a larger role in many of the matters that we studied. I thought that people satisficed rather than maximized, because maximization takes work, and work is a bad.

I saw how macroeconomics had a pretty poor track record in explaining the past, much less the present or future. In development economics, the countries that ignored the foreign experts tended to do the best. Even in finance, which I thought was a little more rigorous, I saw unprovable monstrosities like the CAPM and its cousins, concepts of risk that existed only to make risk uniform, so professors could publish, and option pricing models that relied on lognormal price movement.

Beyond that there was the sterility of economic models that never got contaminated by data. I was a practical guy; I did not want to spend my days defending ideas that didn’t work in the real world. And, I felt from my studies of philosophy that economists were among the unexamined on methodology issues. They would just use techniques and turn the crank, not asking whether the metho, together with data collection issues made sense or not. The one place where I felt that was not true was in econometrics, when we dealt with data integrity and model identification issues.

Wait. This is supposed to be a book review. 🙁 Um, after getting my Fellowship in the Society of Actuaries, I was still looking for unifying ideas to aid me in understanding economics and finance. I had already read a lot on value investing, but I needed something more.

On a vacation to visit my in-laws, I ended up reading The Alchemy of Finance. A number of things started to click with me, which got confirmed when I read Soros on Soros, and later, when I began to bump into the work of the Santa Fe Institute.

I was already familiar with nonlinear dynamics from a brief meeting with a visiting professor back in my grad student days, so when I ran into Soros’ concept of reflexivity, I said “Of course.” You had to give up the concept of rationality of financial actors in the classical sense, and replace them with actors that are limitedly rational, and are prone to fear and greed. Now, that’s closer to the world that I live in!

Reflexivity, as I see it, is that many financial phenomena become temporarily self-reinforcing. ? We saw that in the housing bubble.? So long as housing prices kept rising, speculators (and people who did not know that they were speculators) showed up to buy homes.? That persisted until the? effective cashflow yield of owning a home was less than the financing costs, even with the funky financing methods used.

Now we are in a temporarily self-reinforcing cycle down.? Where will it end? When people with excess equity capital look at housing and say that they can tuck it away for a rainy day with little borrowing.? The cash on cash yields will be compelling.? We’re not there yet.

Along with that, a whole cast of characters get greedy and then fearful, with the timing closely correlated.? Regulators, appraisers, investment bankers, loan underwriters, etc., all were subject to the boom-bust cycle.

Expectations are the key here.? We have to measure the expectations of all parties, and ask how that affects the system as a whole.

In The Alchemy of Finance, Soros goes through how reflexivity applied to the Lesser Developed Country lending, currency trading, equities, including the crash in 1987, and credit cycles generally.? He gives a detailed description of how his theories worked in 1985-6.? He also gives you some of his political theorizing, but that’s just a small price to pay for the overall wisdom there.

Now, Soros on Soros is a series of edited interviews.? The advantage is that the interviewers structure the questioning, and forces more clarity than in The Alchemy of Finance.? The drawback (or benefit) is that the book is more basic, and ventures off into non-economic areas even more than The Alchemy of Finance.? That said, he shows some prescience on derivatives (though it took a long time to get to the promised troubles), though he missed on the possibility of European disintegration.

On the whole, Soros on Soros is the simpler read, and it reveals more of the man; the Alchemy of Finance is a little harder, but focuses more on the rationality within boom/bust cycles, and how one can profit from them.

Full disclosure: if you buy through any of the links here I get a small commission.

Predictably Irrational

Predictably Irrational

Zubin Jelveh has a good post over at Portfolio.com on rationality and markets. Here’s my take:

Behavioral economics is very useful to practitioners, and we are grateful to those who say it is not, because it makes it more useful to the rest of us.

Think of the Adaptive Markets Hypothesis as a tree, and every anomaly/strategy as a bird. As a strategy works, the bird gets fed more, reinforcing the return pattern. When a bird gets too fat, the branch breaks, and the strategy can have a colossal failure. The bird hits the ground, walks away, and the branch re-grows. Eventually, after the bird slims down, he flies back to the branch.

Anomalies/strategies come and go. Too much money can pursue any strategy, even indexing. Wise investors try to ask the question “Where is there too much investor interest?” and then they avoid those strategies until they blow up.

To give an example, it is a great time now to manage unlevered structured product, agency or non-agency, MBS or ABS. Too many levered players have blown up, and there is a lot of good paper that needs a home.

I have talked about this a numberf of? times before, but one of the more fun times was this article.? :)? Here’s another one.

The concept of rationality is a fuzzy one.? I’m not sure that all rational people could agree on a definition. 🙂

My view is that people are not uniformly rational, but that they are in aggregate predictable.

What Should the Spread on a Corporate Bond Be?

What Should the Spread on a Corporate Bond Be?

Suppose we had seven guys in the room, an economist, a guy from a ratings agency, an actuary, a guy who does capital structure arbitrage, a derivatives trader, A CDO manager, and a guy who does nonlinear dynamic modeling, and we asked them what the spread on a corporate bond should be.

  • The economist might say whatever spread it trades at at any given moment is the right spread; no one can foretell the future.
  • The guy from the ratings agency would scratch his head, tell you spreads aren’t his job, but then volunteers that spreads are correlated with bond credit ratings on average.
  • The actuary might say that you estimate the default loss rate over the life of the bond, and the required incremental yield that the marginal holder of the bond needs to fund the incremental capital employed. Add those two spreads together, and that is what the spread should be.
  • The capital structure arb would say that he would view the bondholders as short a put from the equityholders, estimate the value of that option using the stock price, equity option implied volatility, and capital structure, and would back into the spread using that data. Higher implied volatility, higher leverage, and lower stock prices lead to higher spreads.
  • The derivatives trader would say, “Look, I sit next to the cash trader. After adjusting for a deliverability option, if cash is sufficiently cheap to to the credit default swap spread, we buy the bond and receive protection through CDS. Vice-versa if the cash bond is sufficiently rich. In general, the bond spread should be near the CDS spread.”
  • The CDO manager would say that it depends on the amount of leverage he and his competitors can employ in buying bonds for his deals, and how dearly he can sell his equity and subordinate tranches.
  • The guy into nonlinear dynamics says, “This is not a good question. There are multiple players in the market with differing goals, funding structures, and regulatory constraints. All of my friends here have the right answer under certain conditions… but at any given point in the market, each has differing levels of influence.”

After we tell the guy into nonlinear dynamics that he didn’t answer the question, he says, “Fine. Look at the high yield market today. Why were spreads so low nine months ago, and so high now? Did likely default costs have something to do with it? Yes, a sophisticated actuarial model would have looked at the quality of originations and seasoning, and would conclude that default costs would rise. But spreads have moved out far more than that. Have costs of holding high yield debt risen? Capital charges have risen as more downgrades have happened, and as anticipated. That’s still not enough. The loss of the bid for high yield bonds from CDOs is significant, but that is still not enough. As the credit cycle turns down, who is willing to make a bid? Who has the spare capital, and the guts to say, ‘This is the right time.’ Even if it will turn out all right in the end (the actuarial argument), I could lose my job, or get a lower bonus if I don’t time my purchases right. Hey, Actuary, do you want to increase your allocation to high yield at these levels?”

Actuary: “The ratings agencies have told us we only have limited room to do that. Besides, our CIO is a ‘fraidy cat; he wants his bonus in 2008. But in theory it would make sense to do so; we have a long liability structure. We should do it, but there are institutional constraints that fight the correct long-term decision.”

Nonlinear Dynamics Guy: “Okay, then, who does want to take more credit risk here?”

Derivatives Trader: “We are always net flat.”

CDO manager: “Can’t kick a deal out the door.”

Capital Structure Arb: “We’re doing a little more here, but our credit lines aren’t big. Some friends of mine that run credit hedge funds are finding that they can’t lever up as much during the crisis.”

The economist and the guy from the rating agency give blank stares. The Nonlinear Dynamics Guy says, “Look, high yield buyers took too much risk in the past, and now their ability to buy is impaired by increasing capital charges, and unwillingness to resist momentum. Now levered buyers of high yield credit have been killed, and there is excess supply at current levels. Rationality will return when unlevered and lightly levered buyers, or buyers with long liability structures (looks at the actuary) hold their nose, and step up and buy with real money, not short term debt.”

The actuary nods, and makes a mental note to discuss the idea with the CIO of the life insurance company. The economist and ratings agency guy both shrug. The CDO manager asks how long it will be before he can do his next deal. No one answers. The derivatives trader says “Whatever, I make my money in all markets” and the capital structure arb smiles and nods.

Nonlinear Dynamics Guy [NDG] says to the latter two, “Good for you. But what if your financing gets pulled? Many places are finding they can’t borrow as easily as they used to.” The two of them blink, grimace, and say “Our lines won’t get pulled.” Nonlinear Dynamics Guy says, “Have it your way. I hope you all do well.” At that the actuary smiles, and asks if NDG would be willing to speak at the next Society of Actuaries meeting. NDG hands him his card, and says, “Let’s talk about it later. Who knows, by the time of your meeting, things could be very different.”

The Problem of Publishing in the Social Sciences

The Problem of Publishing in the Social Sciences

One of the troubles with the way that academic research in the social (and biological) sciences is set up, is that there is a bias toward publishing research that is statistically significant. Here are some of the problems:

  1. If honestly done, there is value in publishing research that says there doesn’t seem to be any relationship between variable being studied and the cofactors. If nothing else, it would tell future researchers that that avenue has been checked already. Try another idea.
  2. It encourages quiet specification searches, where the researcher tries out a number of different variables or functional forms, until he gets one with significant t-coefficients. Try enough models, one will eventually hit the 95% significance threshold.
  3. What is statistically significant is sometimes not really significant. The result might be statistically significantly different than the null hypothesis, but be so small that it lacks real significance. I.e., learning that a compound increases cancer risk by one billionth should not be significant enough to merit attention.
  4. Researchers are people just like you and me, and all of the foibles of behavioral finance apply to them. They want tenure, promotions, don’t want to be let go, respect from colleagues and students, etc. They have biases in the selection of research and the framing of hypotheses. For example, we can’t assume that stock price movements have infinite variance, because then Black-Scholes, and many other option formulas don’t work. The Normal distribution and its close cousins become a crutch that allows for papers to get published.
  5. Once an idea becomes a researcher’s “baby”, they tend to nurture it until a lot of contrary evidence comes in. (I’ve seen it.)
  6. Famous researchers tend to get more slack than those that are not well-known. I would trot out as my example here returns-based style analysis, which was proposed by William Sharpe. When I ran into it, one of the first things I noticed was that there were no error bounds on the calculations, and that the cofactors were all highly correlated with each other. The paper didn’t get much traction in the academic world, but was an instant hit in the manager selection consultant community. A FAJ paper in 1998 (I think) came up with approximate error bounds, and proved it useless, but it is still used by some consultants today. (I have many stories on that one; it is that only time that I wrote a pseudo-academic paper in my career to keep some overly slick consultants from bamboozling my bosses.)
  7. Data sets are usually smaller than one would like, and the collection of raw data is expensive. Sample sizes can get so small that relying on the results of subsamples for various cofactors can be unreliable. This is a particular problem in the media when they publish the summary results on drug trials, but don’t catch how small the samples were. People get excited over results that may very well get overturned in the next study.
  8. Often companies fund research, and they have an interest in the results. That can bias things two ways: a) A drug company wants their proposed drug approved by the FDA. A researcher finding borderline results could be incented to look a little harder in order to get the result his patron is looking for. b) A finance professor could stumble across a new profitable anomaly to trade on. That paper ends up not getting published, and he goes to work for a major hedge fund.
  9. The same can be true of government-funded research. Subtle pressure can be brought on researchers to adjust their views. Politically motivated economists can ignore a lot of relevant data while serving their masters, and this is true on the right and the left.


The reason that I write this is not to denigrate academic research; I use it in my investing, but I try to be careful about what I accept.

Now, recently, I took a little heat for making a comment that I thought that the unadjusted CPI or median CPI was a better predictor of the unadjusted CPI than the “core” CPI. So, I went over to the database at FRED (St. Louis Fed), and downloaded the three series. I regressed six month lagged unadjusted, median, and core CPI data on unadjusted CPI data for the next six months. I made sure that the data periods were non-overlapping, and long enough that data corrections would induce little bias. I constrained the weights on my three independent variables to sum to one, since that I am trying to figure out which one gets the most weight. My data set had 80 non-overlapping six-month observations stretching back to 1967. Well, here are the results:

  • Intercept: -0.0002 (good, it should be close to zero)
  • Unadjusted CPI: 0.1720 (prob-value 12.3%)
  • “Core” CPI: -0.1665 (prob-value 11.2%)
  • Median CPI: 0.9945 (no prob-value because of the constraint imposed)
  • Prob-value on the F-test: 24.3% (ouch)
  • Adjusted R-squared: 1.10%. (double ouch)

What does this tell me? Not much. The regression as a whole is not significant at a 95% level. Does the median CPI (from the Cleveland Fed) better predict the unadjusted CPI than the “core” or unadjusted CPI? Maybe, but with these results, who can tell? It is fair to say that core CPI does not possess any special ability to forecast unadjusted CPI over a six-month horizon.

From basic statistics, we already know that the median is a more robust estimator of central tendency than the mean, when the underlying distribution is not known. We also know that tossing out data (“core”) arbitrarily because they are more volatile (and higher) than the other components will not necessarily estimate central tendency better. Instead, it may bias the estimate.

So, be wary of the received opinion of economists that are in the public view. Our ability to use past inflation measures to predict future inflation measures is poor at best, and “core” measures don’t help in the explanation.

Is the PEG Ratio a Valid Concept?

Is the PEG Ratio a Valid Concept?

This piece is a work in progress, so I solicit your feedback on it. How could it be improved?

=-=-=-=-=-=-=-=-=-=-=-=-=-=-=-=-=-=-=-=-=-=-=-=-=-=-=-=-=-=-=-=-=-=-=-=-=-=-=-=-=-

I enjoy it when my expectations are proven wrong, because it means that I learned something in the process. When I began preparation for this post (which will probably have two parts, because I am having difficulty posting files, tables and pictures at my blog), I expected to write a post that would conclude that the PEG ratio (P/E divided by the anticipated growth rate expressed as an integer) is a nifty market artifact, but had no sound theoretical grounding.

The answer to the question in my title is complex. The answers are No, Sometimes, and Yes.

  • If you?re a deep value investor: No.
  • If you?re a moderate value or core investor: Sometimes.
  • If you?re a fundamentally-driven moderate growth investor: Yes.
  • If you?re an aggressive growth investor: No.

When I did my earlier post on my version of the Fed Model, I began by showing that it was a simplification of the simple version of the dividend discount model [DDM], which states that the value of a stock is equal to the present value of its future dividends. I?m going to do the same thing here with a few changes:

? I can?t prove what I am stating analytically, that is, by manipulating equations. I?m going to do it through scenario analysis and regression.

? My piece on my Fed model used the simple DDM. This piece uses a three-stage DDM. The stages are growth, transition, and maturity. For those with access to a Bloomberg Terminal, my implementation is a more conservative version of what they did.

Three-Stage DDM Assumptions

  • ? Initial forecast earnings (E1)
  • ? Initial dividend payout ratio as a portion of earnings (PR1)
  • ? Growth rate of earnings in the first phase of the model (g)
  • ? Length of the first phase (5 years)
  • ? Length of the second transition phase (6 years)
  • ? Ultimate earnings growth rate in maturity (6%)
  • ? Ultimate payout ratio in maturity (50%)
  • ? Discount rate for the dividend stream (ks), otherwise known as the required rate of return (i.e., what does an investor have to expect to earn in order to get him to part with his cash?)

In brief, in the first phase of the model, earnings grow at a rapid rate, and dividends are paid at a relatively low rate, in the second (transition) phase, the earnings growth and dividend payout rates grade linearly into the rates of the ultimate phase. The resulting dividend stream gets discounted at a discount rate reflecting the riskiness of the company.

Limitations of the Model

  • ? It is difficult to forecast earnings for next year, much less give a growth rate for the next 5 years. I use sell side estimates as an initial jumping off point.
  • ? Companies grow erratically.
  • ? The maturation of a company is rarely so linear.
  • ? The lengths of the first two phases are somewhat arbitrary, though the sell side typically does 5-year growth rates.
  • ? A 6% growth rate in maturity is consistent with long term nominal GDP growth, but it is still quite an assumption.
  • ? Payout rates and growth rates should be inversely correlated. To the extent that capital constrains business growth, a higher rate of dividend payout should result in a lower earnings growth rate.
  • ? The discount rate is difficult to calculate. Theoretically, it should be 2-3% percent higher than the highest yield on the longest, most subordinated debt or preferred of the company. If a company has no debt, compare it to the yields of bonds of other companies with similar put option implied volatility 20% or more out of the money. Then add 2-3% to those yields.
  • ? Payout rates and the discount rate should be negatively correlated. Companies with high payout rates will be judged to be less risky most of the time, and vice-versa.

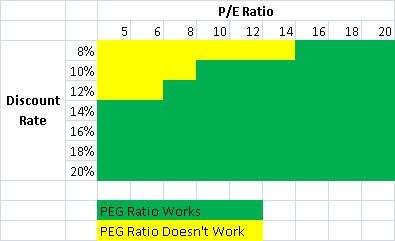
All that said, the DDM is a model, and a richer model than the PEG ratio. My question became, ?Are there conditions where the results of the DDM resemble a PEG ratio?? The answer to that is yes, when:

  • The discount rate is 14% or lower
  • At lower discount rates, only for higher P/Es. For example at a discount rate of 8%, the PEG ratio works for P/Es 16 and higher.

Now I oversimplified my conclusions here. Look at this graphic:

Validity Space
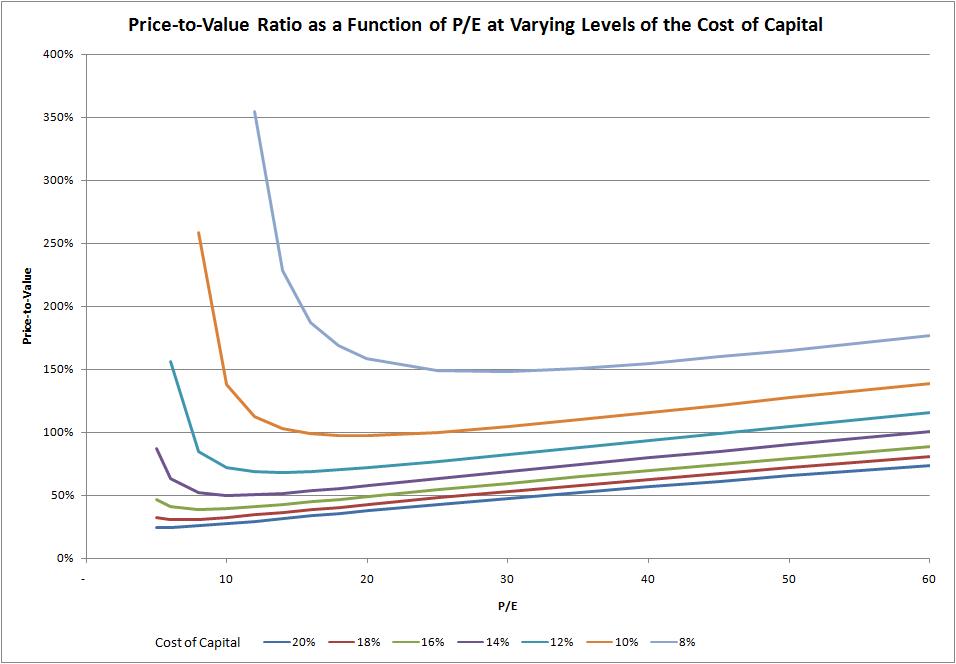
Or, based off of that, consider this graph, which shows the PEG hurdle rates as a function of initial P/Es. and cost of capital (discount) rates:

Price-to-Value Graph

How did I come to this result? For differing levels of the discount rate, I varied P/E levels, calculating the initial phase growth rate that would make price equal to value in the DDM. Those P/E and growth levels gave me the PEG ratios. Those PEG ratios were often quite flat for higher P/Es at a given level of the discount rate of 14% or below. There is usually a bit of a smile or smirk, but you can see an average level.

At 16% or higher levels of the discount rate, the PEG ratio falls apart. At low levels of P/E the required PEG ratio should be low. At high levels of P/E, the required PEG ratio can be higher. The intuition here is that situations with high discount rates, and thus high risk, require high growth to fuel value in a DDM calculation.

At low discount rates, and low P/Es, the DDM says that value investors don?t need much growth at all in order to buy good values. If one considers the inverse of the P/E, the E/P, or earnings yield, when it is greater than the discount rate, it is hard to lose money, even when earnings don?t grow. Even more so when the dividend yield exceeds or is near the discount rate.

A Formula for the PEG Ratio Hurdle

Taking the average PEG hurdle rates for P/Es 16 and above, where price equaled DDM Value, for various discount and payout rates, I calculated a regression to give a more general PEG hurdle rate formula. The factors appeared multiplicative, so I used a formula that looked like this:

ln ( average PEG hurdle) = a + b * ln(discount rate) + c * ln(payout rate) + e (error term)

The regression had an adjusted R-squared of 98%, with all coefficients statistically significant at prob-values of 99% or better. a was 7.8646, b was -1.3169 and c was .0752. In summary form, the formula looks like this:

Average PEG hurdle = 26.03 * discount rate-1.3169 * payout rate0.0752

Pretty good, but after a little while, I asked if I could create a formula that better represented the curves in graph 2. So, I ran the following regression:

ln (PEG hurdle) = a + b * ln(discount rate) + c * ln(payout rate) + d * ln(P/E) + e (error term)

I had a debate as to how to censor the data. I threw out data points with negative PEG hurdles in the first analysis. In the second one, I threw out negative PEG hurdles, and PEG hurdles over 2.0x. On the second analysis, my reasoning was that if PEG hurdles over 2.0 are acceptable, we?re in weird times. Now perhaps that pre-judges the situation, but the right functional form for graph 2 eludes me here. Personally, I would use the second formula here:

Formula 1: Average PEG hurdle = 0.01823 * discount rate-1.6279 * payout rate0.1039 * PE Ratio0.1893

Formula 2: Average PEG hurdle = 0.02035 * discount rate-1.4215 * payout rate0.0941 * PE Ratio0.2704

Formula 1 has an R-squared of 76%, and with 2 it is 88%. The t-statistics are all significant at 99% levels.

Now, suppose I am a growth investor and I decide to apply formula 2. I look for stocks with PE ratios of around 20, my discount rate is 15%, and the dividend payout rate is around 10%. What annual earnings growth should I be looking for over the next 5 years? The formula says 36.6%. Pretty aggressive. At a discount rate of 12%, the growth rate drops to 26.6%.

What this points out in a way is the difficulty of making consistent money in growth stocks. The earnings growth rates needed to make money in excess of the discount rate on average over time is higher than most growth investors realize.

Growth investors overpay for growth. That is one of the reasons that I am a value investor.

One final note: Jim Cramer has a limit for what he is willing to pay for growth stocks ? a PEG ratio of 2.0x. Now, he?s a bright guy, so there are two ways that I can interpret this. 1) Since momentum plays a large role in Cramer?s investing, the 2.0x ceiling limits his risk while he plays momentum. Or, 2) he has longer periods of competitive advantage and transition than I do. I favor the first interpretation, because it is rare in my opinion that growth investors should pay over 1.5 times the growth rate for any investment, unless the barriers to entry are significant.

Summary

PEG ratios work for core and growth investors, but the PEG ratio hurdles needed for investment are lower than most investors think, so long as the expected rate of return (discount rate) is high.? As for me, I will stick with value investing, where the need for earnings growth is negligible.

An Anomalous View of Stock Investing

An Anomalous View of Stock Investing

I was impressed with what Charles Kirk had to say regarding AAII and Stock Screening.? I’m a lifetime member of AAII, and I’ve used their stock screening software for years, long before I was a professional.? I was also impressed to note in the recent issue that two of my four buys in the fourth quarter were buys in the shadow stock portfolio, which has done very well over the years.

Back to Charles Kirk, if I can quote a small part of his piece:

When looking over the information, among many things I noticed include the fact that 7 stock screens have posted gains for every year over the past 10 years. Screens with this amazing consistency include Graham’s Defensive Investor, Price-To-Sales, Zweig, PEG With Est Growth, PEG With Hist Growth, and two of O’Shaughnessy’s screens – Small Cap Growth & Value and Growth. Few screening strategies can produce gains year after year as these have and there’s something to be learned from them.

Looking through and comparing the criteria between all of these screens, in essence they were seeking four simple things: 1) growing earnings per share over various time frames, 2) strong sales growth, 3) an attractive valuation (often using price-to-sales), and 4) relative strength.

Though I may quibble with O’Shaughnessy’s methodology, this is consistent with what he found in his book What Works on Wall Street.?? That said, though I am more agnostic about market capitalization, as I looked across the shadow stock portfolio, which is a small cap deep value portfolio, it confirmed to me that there are a lot of cheap stocks to buy in this environment.? There are good gains to be had in the future, even if past performance has suffered.

Now to approach it from a different angle.? I mentioned how much I like the CXO Advisory blog.?? One page to visit is the Big Ideas page, if you like academic finance papers.? I want to give you my short synopsis of what seems to work:

  • Cheap valuation, particularly low price-to-book (though I like cheap price-to-everything… book, earnings, sales, dividends, EBITDA)
  • Price momentum
  • Low accrual accounting entries as a fraction of earnings or assets
  • Piotroski’s accounting criteria
  • Low net stock issuance
  • Positive earnings surprises
  • Low historical return volatility
  • Illiquidity, which is a proxy for size and neglect

There are other prizes on that page, including mean-reversion, an improved Fed Model, Dollar-weighted vs. Time-weighted returns, limitations on academic financial research, demography, etc.

I would simply tell the fundamental investors in my audience to think about these issues.? Let me summarize them one more time:

  • Look for a cheap valuation.
  • Look for mean reversion, but don’t try to catch a falling knife.
  • Grab positive price momentum and earnings surprises.
  • Look for sound accounting, and management that is loath to dilute shareholders.
  • Avoid volatile stocks
  • Look for neglected stocks

That’s my my quick summary for what seems to work in stock selection.? I invite commentary on this.? I downloaded a lot of the papers cited, and will be reading them over the next few months.

What of the January Effect?

What of the January Effect?

I’m not feeling well this evening, so this will be a short post dealing with one simple issue.? (If I have strength, I may do one more.)

The January Effect is one of the best known calendar anomalies.? Stocks and high yield bonds tend to do well after the first day of the new year. This happens because these assets get oversold as some investors sell losing positions for tax reasons.? This tends to be more powerful for stocks that have done poorly over the past year, and for small companies, and value stocks.? This year it seemingly hasn’t happened.? Why?

First, all anomalies exist within a broader market environment.? When enough market players jump onto an anomaly, the anomaly outperforms in the short run, but peters out, because all interested parties have bought in.? If that were true of the January Effect, we would see the gains made in December, rather than January.? That’s not what happened this year.? (Anomalies tend to do best when they are ignored.)

Second, in a market where small value stocks may be overvalued, the January Effect could disappear for a year while small value stock valuations adjust back to normal, or below that.? That might be true this year.

We are in the winter season, not just for the calendar, but for small stocks and value investing. ? I feel the winter chill in all that I do at present, and no, I am not talking about the lack of insulation in my hovel.? I have the winter wind in my face now (much as I remember walking home from high school in Milwaukee), and yet I know that this is the time that my best purchases are likely to be made.? I have to focus on my core disciplines, and buy good long-term cash flow streams cheaply.

Before I close, I would say that a new favorite blog of mine is the CXO Advisory Group blog.? For quantitative investors, there is a wealth of knowledge there.

The Longer View, Part 5

The Longer View, Part 5

There’s no order to this post, so enjoy my reflections on broader trends that are affecting the markets.

  1. Corn-based ethanol is costly, and a mistake for our government to subsidize it, when we could buy sugar-based ethanol from Brazil. I’m no environmentalist, but even I can see the advantages of eliminating sugar subsidies and quotas here in the US. The only people hurt are some rich farmers that bribe Washington to keep the subsidies. With a little encouragement from the US, Brazil could adopt more environmentally friendly harvesting techniques, while not kicking up costs that much. Such a deal, better economics, and better for the environment.
  2. Stories like this always make me skeptical. Remember cold fusion? Maye there is a real innovation here that produces more energy than it consumes on net. I wouldn’t bet on it, though.
  3. Since the creation of the Earth, farming has been the dominant occupation of man, until now. More people are employed outside of farming, than inside it. This is not big news, except to confirm that what happened to the developed world 80 years ago is happening to the world as a whole now.
  4. ETFs are not open end mutual funds, where there is one price struck per day for liquidity. For small ETFs, the bid-ask spread can be quite wide on small funds. This shouldn’t be too surprising; the same is true of any small stock. If there is demand for an ETF concept, more units will get created as people bid for them, and the bid-ask spread will narrow.
  5. Rationality in markets is misunderstood. You can bring bright people to manage money, and they will still in aggregate become prey to the speculative aspects of the markets. Some will resist it, but most won’t. It is not a question of intelligence, but of discipline.
  6. Give Hersh Shefrin some credit. I think that behavioral finance is a much richer explanation of the markets than modern portfolio theory. MPT exists because it is easily mathematically tractable, which allow professors to publish, and not because it is a correct description of reality.
  7. It’s tough to be an orphan company. Much as I like investing in companies that have no analyst coverage, if they are cheap enough, when a company loses analyst coverage, the stock price typically declines, and often, the company disappears within a few years. Perhaps the lack of analyst coverage is a proxy for the demand for a company to be public, rather than private.
  8. Here’s a good article on why the market crashed in October of 1987. My quick summary for why it happened was that bonds were more attractive relative to stocks, and dynamic hedging left the market unstable, as many player were willing to sell on big down days.
  9. Will junk defaults triple from 2007 to 2008? Seems reasonable to me; given all of the CCC and single-B issuance over the last few years, the companies that have recently issued bonds seem weak to me.
  10. Can Thompson-Reuters give Bloomberg a run for its money? My guess would be no. Bloomberg is a much richer system, and for those that need that level of complexity, that is where you can get it with great ease.

Enough for the evening. More to come tomorrow.

The Longer View, Part 4

The Longer View, Part 4

In my continuing series where I try to look beyond the current furor of the markets, here are a number of interesting items I have run into on the web:


1) Asset Allocation


  • Many people who want to stress the importance of their asset allocation services will tell you that asset allocation is responsible for 90% of all returns, so ignore other issues.? An article on the web reminded me of this debate.? The correct answer to the question, as pointed out by this paper, is that asset allocation explains 90% of the variability of the returns of a given fund across time, but only explains only 40% of the variability of a fund versus other funds.? Security selection matters.
  • Two interesting papers on asset class correlation.? Main upshots: historical correlations are not fully reliable, because risky assets tend to trade similarly in a crisis.? Value tends to march to its own drummer more than other equity styles in a crisis.? The effects on correlation in crises vary by crisis; no two are alike.? Natural resources and globa bonds tend to be good diversifiers.
  • In bull markets, risky asset classes all tend to do well.? Vice-versa in the bear markets.? My reason for this correlation is that you have institutional asset buyers all focusing on asset classes that were previously under-recognized, and are now investing in them, which raises the correlation level, not because the economics have changed, but becuase the buyers have very similar objectives.
  • There are a few good states, but by and large, public pensions are a morass.? Most are underfunded, and rely on future taxation increases to support them.? When a public system realizes that it is behind, the temptation is to take more investment risk by purchasing alternative asset classes that might give higher returns.? This will end badly, as I have commented before… I suspect that some state pension plans are the dumping grounds for a lot of overpriced risk that Wall Street could not offload elsewhere.


2) Insurance


3) Investment Abuse of the Elderly


It’s all too common, I’m afraid.? Senior citizens get convinced to buy inappropriate investments.? Even the SEC is looking into it.? This applies to annuities as well, mainly deferred annuities, which I generally do not recommend, particularly for seniors.? The comment that a CEO doesn’t fully understand his own annuity products is telling.


Now fixed immediate annuities are another thing, and I recommend them highly as a bond substitute for those in retirement, particularly for seniors who are healthy.


The only real cure for these deceptive practices is to watch out for the seniors that you care for, and tell them to be skeptics, and to run all major investment decisions by you, or another trusted soul for a second opinion.


4) Accounting


  • I am against the elimination of the IFRS to GAAP reconciliation for foreign firms.? What is FASB’s main goal in life — to destroy comparability of financial statements?? We may lose more foreign firms listed in the US, which I won’t like, but a consistent accounting basis is critical for smaller investors.
  • Congress moves from one ditch to the other.? This time it’s sale of subprime loans.? Too many modifications, and sale treatment is at risk, so Congress tries to soften the blow for the housing market.? Let auditors be auditors, and if you want the accounting rules changed, then let Congress do the job of the FASB, so that they can be blamed for their incompetence at a complex task.
  • As I’ve said before, I don’t like SFAS 159.? It will lead to more distortions in financial statements, because managements will tend to err in favor of higher asset and lower liability values, where they have the freedom to set assumptions.


5) Volatility


  • Earn 40%/year from naked put selling?? Possible, but with a lot of tail risk.? I remember how a lot of naked put sellers got smashed back in October 1987.? That said, it looks like you can make up the loss with persistence, that is, until too many people do it.
  • Here’s an interesting graph of the various VIX phases over the past 20 years.? Interesting how the phases are multiyear in nature.? Makes me think higher implied volatility is coming.
  • I don’t think a VIX replicating ETF would be a good idea; I’m not sure it would work.? If we want to have a volatility ETF, maybe it would be better to use variance swaps or a fund that buys long delta-neutral straddles, and rebalances when the absolute value of delta gets too high.


That’s all for now.? More coming in the next part of this series.

The Longer View, Part 3

The Longer View, Part 3

  1. August wasn’t all that bad of a month… so why were investors squealing? The volatility, I guess… since people hurt three times as much from losses as they feel good from gains, I suppose market-neutral high volatility will always leave people with perceived pain.
  2. Need a reason for optimism? Look at the insiders. They see more value at current levels.
  3. Need another good investor to follow? Consider Jean-Marie Eveillard. I’ve only met him once, and I can tell you that if you get the chance to hear him speak, jump at it. He is practically wise at a high level. It is a pity that Bill Miller wasn’t there that day; he could have learned a few things. Value investing involves a margin of safety; ignoring that is a recipe for underperformance.
  4. Call me a skeptic on 10-year P/E ratios. I think it’s more effective to look at a weighted average of past earnings, giving more weight to current earnings, and declining weights as one goes further into the past. It only makes sense; older data deserves lower weights, because business is constantly changing, and older data is less informative about future profitability, usually.
  5. I found these two posts on the VIX uncompelling. Simple comparisons of the VIX versus the market often lead to cloudy conclusions. I prefer what I wrote on the topic last month. When the S&P 500 is below the trendline, and the VIX is relatively high, it is usually a good time to buy stocks.
  6. What does a pension manager want? He wwants returns that allow him to beat the actuarial funding target over the lifetime of the pension liabilities. If long-term high quality bonds allowed him to do that, then he would buy them. Unfortunately, the yield is too low, so the concept of absolute return strategies becomes attractive. Well, after the upset of the past six weeks, that ardor is diminished. As I have said before, to the extent that hedge funds seek stable, above average returns, they engage in yield-seeking behavior which prospers as credit spreads and implied volatilities fall, and fail when they rise. Eventually pension managers will realize that hedge fund returns cannot provide returns over the full length of the pension liability, in the same way that you can’t invest more than a certain amount of the pension assets in junk bonds.
  7. Is productivity growth slowing? Probably. What may deserve more notice, is that we have larger cohorts entering the workforce for maybe the next ten years, and larger cohorts exiting as well, which will decrease overall productivity. Younger workers are less productive, middle-aged most productive, and older-aged in-between. With the Baby Boomers graying, productivity should fall in aggregate.
  8. This is just a good post on sector data from VIX and More. It’s worth looking at the websites listed.
  9. Economic weakness in the US doesn’t make oil prices fall? Perhaps it is because the US is important to the global economy, but not as important as it used to be. It’s not hard to see why: China and India are growing. Trade is growing outside of the US at a rapid pace. The US consumer is no longer the global consumer of last resort. Now we get to find out where the real resource shortages are, if the whole world is capitalist in one form or another.
  10. Calendar anomalies might be due to greater macroeconomic news flow? Neat idea, and it seems to fit with when we get the most negative data.
  11. Is investing a form of gambling? I get asked that question a lot, and my answer is in aggregate no, because the economy is a positive-sum game, but some investors do gamble as they invest, while others treat it like a business. Much depends on the attitude of the investor in question, including the time horizon and return goals that they have.
  12. Massachusetts vs. the laws of economics. Beyond the difficulty of what to do with expensive cohorts in a public insurance system, I’ve heard that they are having difficulties that will make the system untenable in the long run… most of which boil down to antiselection, and inability to fight the force of aging Baby Boomers.
  13. Rationality is one of those shibboleths that economists can’t abandon, or their mathematical models can’t be calculated. Bubbles are irrational, therefore they can’t happen. Welcome to the real world, gentlemen. People are limitedly rational, and often base their view of what is a good idea, off of what their neighbor thinks is a good idea, because it is a lot of work to think independently. Because it is a lot of work, people conserve on hard thinking, since it is a negative good. They maximize utility where utility includes not thinking too hard. Any surprise why we end up with bubbles? Groupthink is a lot easier than thinking for yourself, particularly when the crowd seems to be right.
  14. Is China like the US with 120 years of delay? No, China has access to better technology. No, China does not have the same sense of liberty and degree of tolerance of difference. Its culture is far more uniform from an ethnic point of view. It also does not have the same degree of unused resources as the US did in the 1880s. Their government is in principle totalitarian, and allows little true freedom of religious expression, which is critical to a healthy economy, because people work for more than money/goods, but to express themselves and their ideals.
  15. As I have stated before, prices are rising in China, and that is a big threat to global stability. China can’t continue to keep selling goods without receive goods back that their workers can buy.
  16. The US needs more skilled immigrants. Firms will keep looking for clever ways to get them into the US, if the functions can’t be outsourced abroad.
  17. It’s my view that dictators like Chavez possess less power than commonly imagined. They spend excess resources on their pet projects, while denying aid to the people whom they claim to rule for their benefit. With inflation running hard, hard currencies like the dollar in high demand, and the corruption of his cronies, I can’t imagine that Chavez will be around ten years from now.
  18. Makes me want to buy Plum Creek, Potlach, or Rayonier. The pine beetle is eating its fill of Canadian pines, and then some, with difficult intermediate-term implications. More wood will come onto the market in the short run, depressing prices, but in the intermediate term, less wood will come to market. Watch the prices, and buy when the price of lumber is cheap, and prices of timber REITs depressed.
  19. Pax Romana. Pax Americana. One went decadent and broke, the other is well on its way. I love my country, but our policies are not good for us, or the world as a whole. We intrude in areas of the world that are not our own, and neglect the proper fiscal and moral management of our own country.
  20. Finally, it makes sense for economic commentators to make bold predictions, because there’s no such thing as bad publicity. Sad, but true, particularly when the audience has a short attention span. So where does that leave me? Puzzled, because I enjoy writing, but hate leading people the wrong way. I want to stay “low hype” even if it means fewer people read me. At least those who read me will be better informed, even if it means that the correct view of the world is ambiguous.

Tickers mentioned: PCH PCL RYN

Theme: Overlay by Kaira