Category: Public Policy

Decentralized Ponzi

Photo Credits: Jared Enos, Stephan Mosel & Pine Tools || Ponzi would have appreciated the cleverness of wallstreetbets

The operation of the “bull pool” at wallstreetbets resembles a Ponzi scheme. There are five things that make it different:

  • It is decentralized.
  • Because it is decentralized, there is no single party that controls it and rakes off some of the money for himself, at least not directly.
  • The assets can be freely sold in a somewhat liquid, but chaotic market. Most Ponzi schemes have time barriers for redemption.
  • They caught a situation where shorting was so rampant, that triggering a squeeze was easy. Situations where the shorts are so crowded are rare.
  • Gamestop [GME] and other companies whose stock prices get manipulated above their intrinsic value can take the opportunity to sell more shares, as can less than 10% holders of the holders of the stock, and even the greater than 10% holders once six months have passed since their last purchase.

You have to give wallstreetbets credit for one thing, and only one thing: wiping out the shorts. It was an incredibly crowded short, and they identified an easy squeeze. But now it is harder to short, margin requirements have been tightened for both longs and shorts, given the market volatility, and even more so for options. That not only applies to individuals but to brokerages, because with the volatility, there is a greater probability of settlement failure, and broker failure. Robinhood faced possible failure and raised capital. What shorts remain are better financed than previously. When volatility goes up, so must the capital of intermediaries, including brokerages.

Ponzi schemes typically need ever-increasing flows of money to satisfy the cash need from the money being raked off. But there is no sponsor here, so what plays the role of the rake? I can think of three rakes for the money:

  • Most fundamentally driven longs have sold. Notable among them is MUST Asset Management of South Korea.
  • Some companies like AMC Entertainment and American Airlines are issuing new shares to take advantage of the artificially high price. Maybe GME will do it next week.
  • And, those who are more intelligent at wallstreetbets know that GME is overvalued, and have booked their gains. This is definitely a place where the old Wall Street maxim applies: “Can’t go broke taking a profit.” or “Bulls can make money, Bears can make money, but Hogs get slaughtered.” (The Hogs in this situation are the ones who buy and hold GME. Buy-and-hold only works for undervalued assets.)

Now, the grand change that has happened in the last two months is that the investor base of GME has shifted from being fundamental investors to momentum investors. There may be more institutional money pushing GME than is commonly understood. That said, institutional momentum longs tend to react quickly and sell when momentum fails, which makes matters even more volatile. They have more of a risk control discipline than naïve retail investors do.

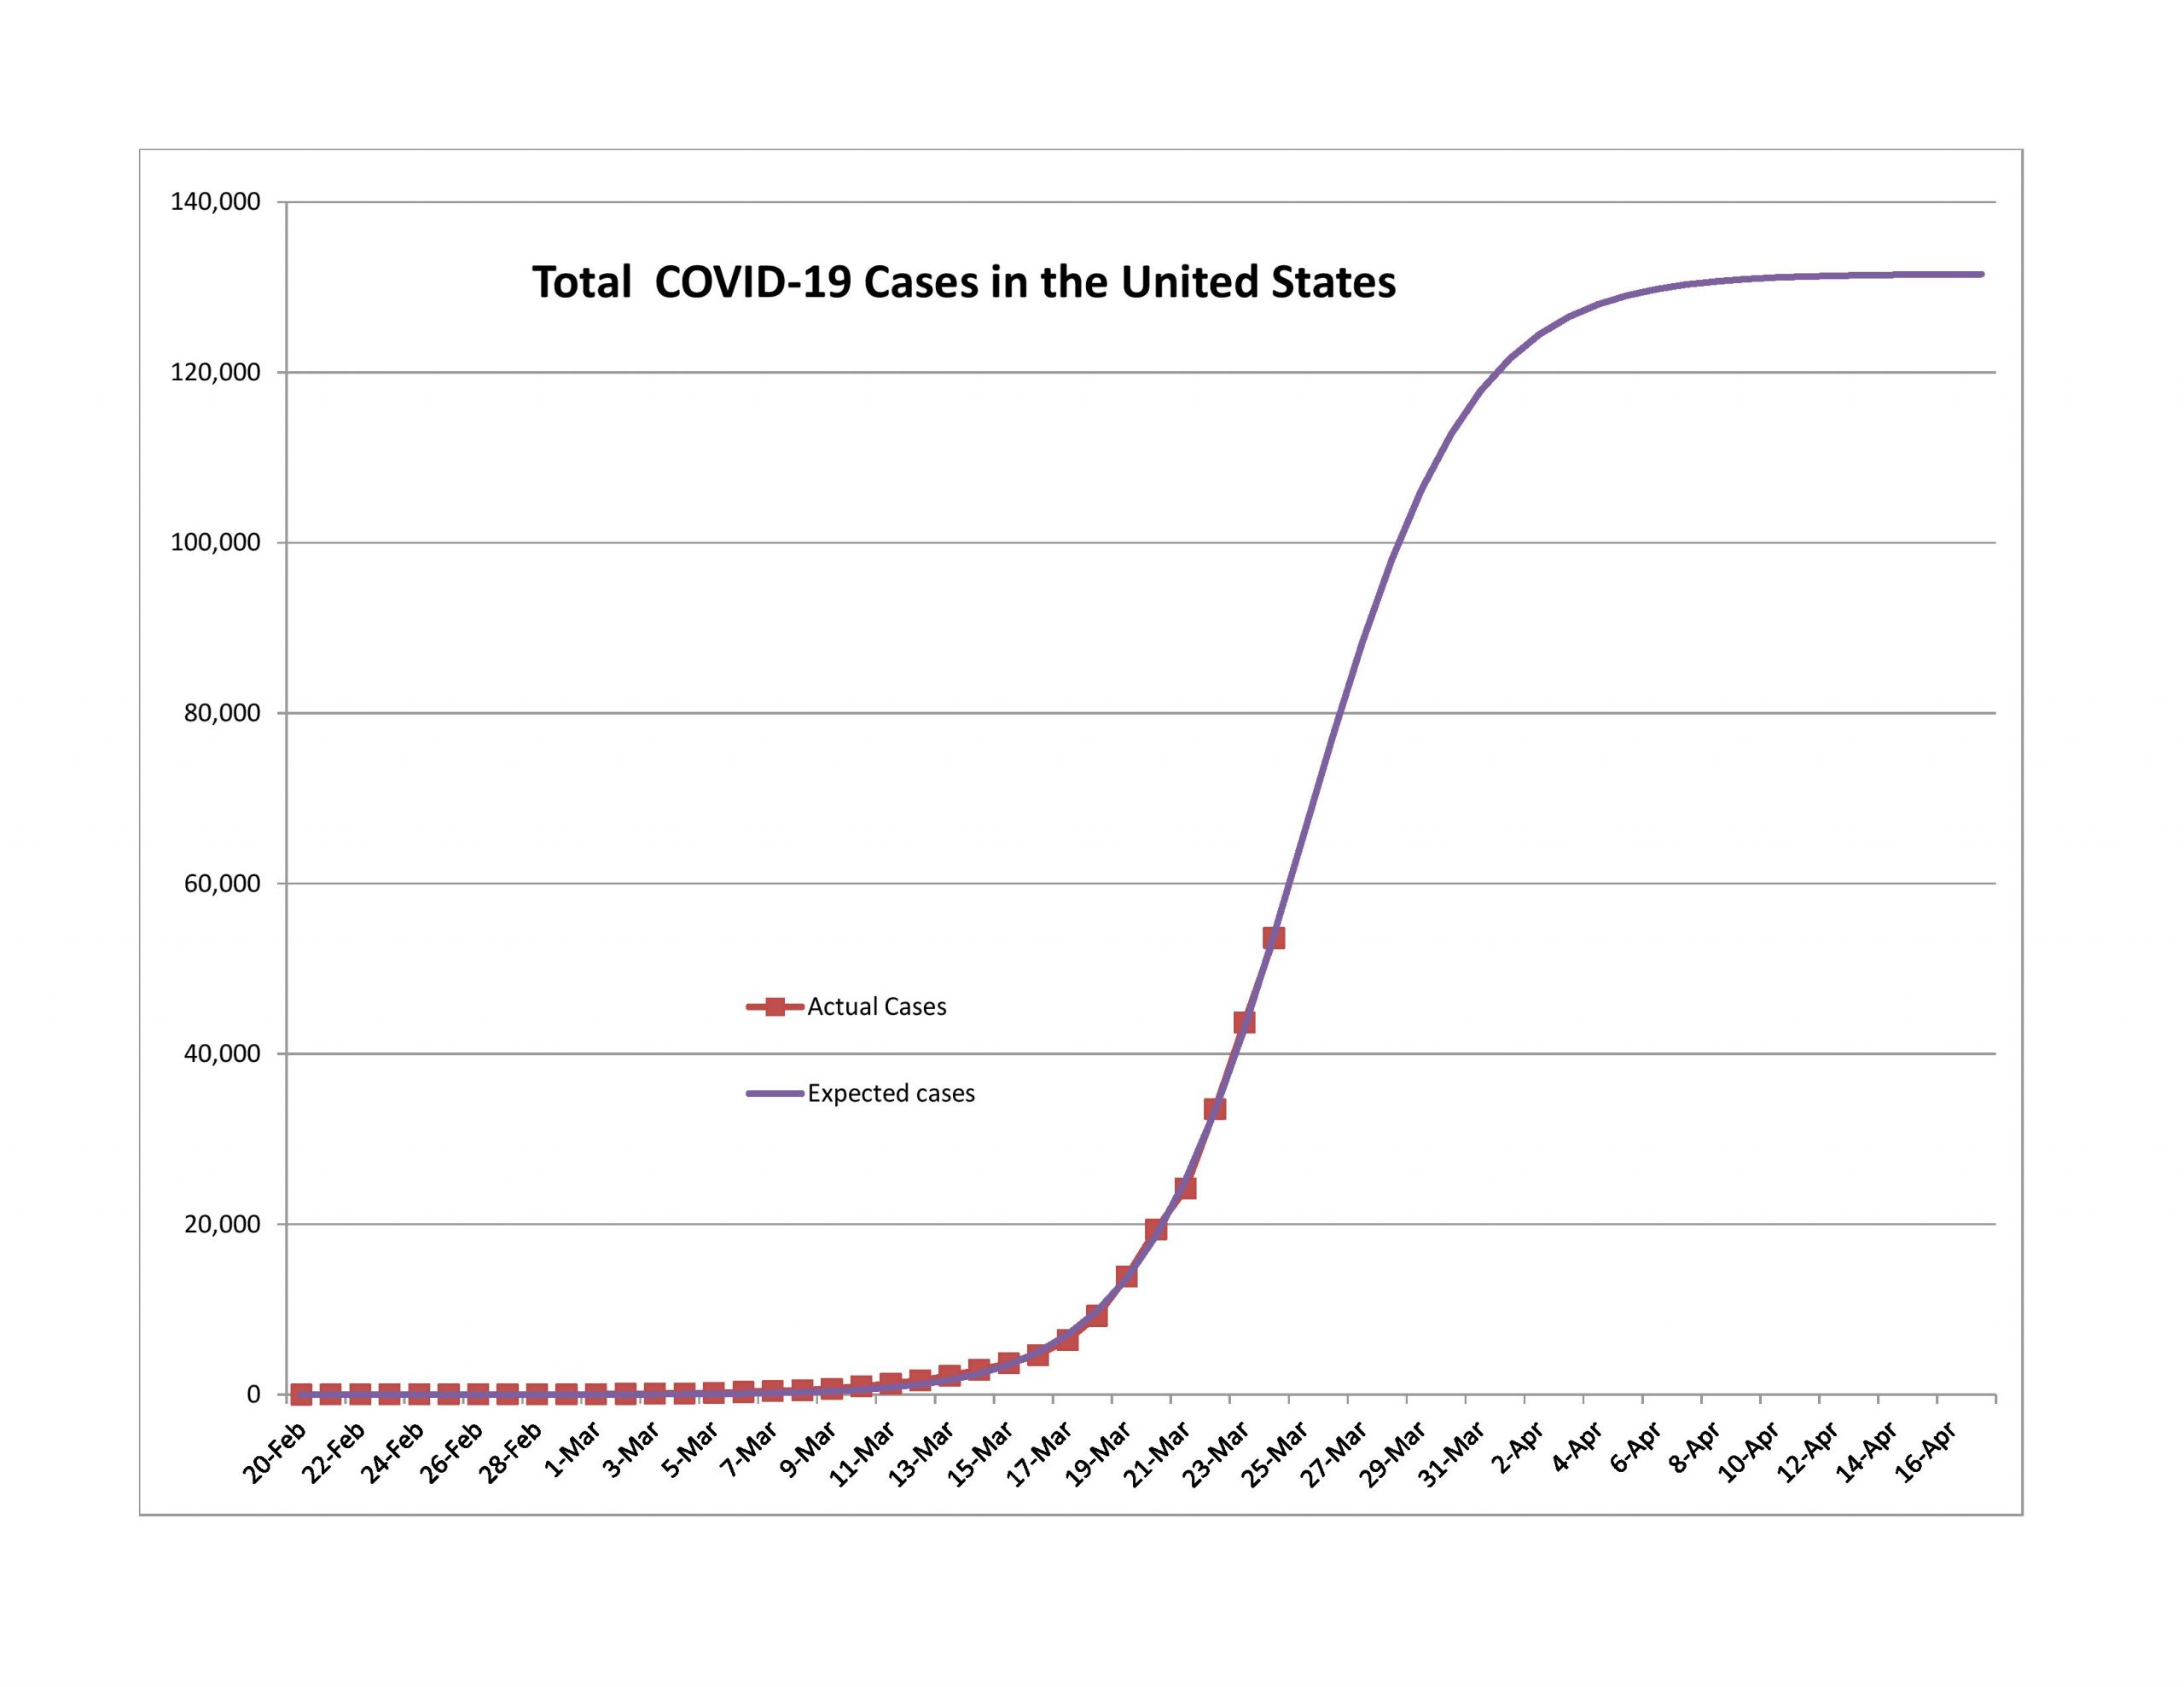
This is similar to what happens with promoted penny stocks. Fundamentals seem not to matter, just the amount of money thrown at the stock. There is the pump; there is the dump. The amounts of money are bigger here. We have only seen the pump. The dump is coming. And penny stocks almost always lose.

There is no magic in markets — stock prices eventually revert to intrinsic value — it is only a question of how and when. Buyers can force a stock price above intrinsic value for a little while, but eventually the price will sag back, and the only winners will be those who sold stock to them.

When I was younger, I made a mistake with a microcap stock, and placed a market order to initiate a position. (Accident: I typically only use limit orders.) The stock was so thinly traded that I got filled at levels an average of 50% above where the bid was. The price promptly fell back to where it was prior to my purchase.  This is what will likely happen with GME, and other situations like it. Mere trading can’t permanently raise the price of an asset.

One last note: those at wallstreetbets and places life it should be careful. If you are communicating with other investors about a stock and you make money as a result of the communication, you may face legal troubles if that is deemed market manipulation. And, given that you have communicated it over the internet, that could be deemed “wire fraud.” This is the nature of a government with vague laws that likes to say “gotcha” when they deem something unsavory as illegal.

Do I think it should be illegal? No. Is it unethical? Certainly. No one should promote anything like a Ponzi scheme. But in US culture now, unethical and illegal get confused, and the ideas of “mail fraud,” “wire fraud,” etc., can be applied to unethical actions that may not strictly be illegal. Such logic has been applied to promoted penny stocks, with significant wins against the promoters.

So, to those at wallstreetbets, I would say that you are living on borrowed time. This isn’t going to work, and you and those that follow you will lose money, whether the government comes after you or not. Just as the Hunts tried to corner the silver market, and failed miserably as people sold their silver sets, and miners mined like crazy, in the same way pushing stock prices too high will only lead to dilution from the corporations, and losses to the buyers who came in late., if not the early ones as well.

Look out below.

Notes and Comments

Notes and Comments

1) I still can’t post images at my blog. If you can believe it, WordPress is trying to fix it. The one cost involved is that the last three posts will be wiped out, and all comments since 4/8.

2) I’ve spent the time since my last post improving my models. I played around with a seven-parameter model, but found that it took ~10,000x as much time to converge to a solution, and there were multiple solutions with very different results that fit close to equally well. My conclusion was that they were different ways to amplify noise.

Instead, I created a second model based on the idea that the rate of growth of total cases was exponentially decaying at a rate slower than that of the first model. The new case figures have been coming at rates far closer to the second model.

I’m sensitive to when models keep having errors in the same direction… 2-3 weeks ago, errors were close to even — as many up as down. But since then more new cases have persistently come in than the first model would have predicted.

Austria, Switzerland and Germany are fine, but most of nations I have modeled have a long way to go, if model 2 is closer to the truth. Add five weeks onto getting to the 99% point.

As such, don’t put me in the camp of optimists any more. I recognize my initial predictions were wrong. Some of it stems from increasing testing as time has gone on. Indeed, what will happen if that study in New York is correct (seems to be too small of a sample, and perhaps biased), and maybe 10-15% of the NY population caught COVID-19 with almost no symptoms? That is mostly a good thing, and might even be a testimony to how little reported cases moved up in the face of that — social distancing restrains the spread of COVID-19, particularly with those who would be most harmed distancing via self-quarantine.

3) I think the history books will end up calling this the voluntary recession, where governments chose ham-fisted solutions out of fear, and did not consider the long-run implications of draconian solutions like general quarantine. What are the effects on:

  • Unemployment
  • Division of labor
  • Pensions, both public and private
  • health care for those that don’t have COVID-19
  • Small businesses that run out of resources

Death rates rise from sudden recessions. Might it be more than the lives saved via general quarantine. What Sweden is doing makes more sense. Yes, their death rates are a little higher, but they didn’t close many things at all — their populace has covered up, and kept working. They integrated social distancing into their total lives, including work.

4) But, after the crisis is over, there will be some things that we realize we did not need. Will a video teleconference do as well as a trip to a remote office? How much additional productivity do we get or lose from having staff in a single location? Hay, I can cook for myself! I don’t have to go to restaurants! We don’t need low-end malls! And more… we just don’t know what all will change. That said, never underestimate the ability of Americans to forget.

5) There are charities that help some businesses finance their inventories. They are called commodity ETFs. Long ago, I wrote about the folly of buying ETFs that follow complex strategies. USO always underperformed. This past week was the worst of it.

Negative prices for oil futures are like negative interest rates. If you can safely store paper currency, you will never have a negative interest rate. If you can safely store oil, then a day will come when you can use or sell it.

6) One of my clients asked me what I thought about what the Fed is doing now. My answer is this: they aren’t doing much. The market took their bluff and ran with it. How is this?

  • All of the risk flows back to the US Treasury explicitly or implicitly, via loss of seigniorage.
  • They are mostly financing assets, not buying them.
  • When they are buying assets, they aren’t taking much risk, either in duration or credit.
  • The QE that they are doing is just a closed loop with the banks — it doesn’t get into the general economy.

The Fed makes me think of a nerdy kid who thinks he is being cool, but all the cool kids know he is a nerd. That said, in this case a good bluff can be quite effective if the cash keeps flowing.

Personally, I like the fact that the Fed is taking little risk. That’s the way a central bank should be. But that’s not the way the markets are interpreting the matter — they think the Fed will always rescue them.

7) But at least at present, I don’t think we are using MMT yet, unless you mean that the Fed buys government debt.

To me, the big question is when do foreign entities get sick of owning US Dollar claims? When do foreign governments finally say that they won’t subsidize exporters anymore, and will stop investing in US Dollar claims?

Of the major governments, the US is the “cleanest dirty shirt,” but when will the free ride of cheap capital end? Nature abhors free lunches, and this one has gone on for a long time… pity that the competition is so poor.

8 ) When will we learn that savings doesn’t inhibit growth? Stable households and businesses survive better, and ultimately spend more.

9) 60/40 stocks/bonds as an asset allocation has been maligned, but not for any good reason. Yes, high-quality interest rates are low. The real value of bonds is that they don’t fall as much as stocks. In a stock market where valuations are still high, though not relative to bond yields, stocks should play a larger role, but not so much as to eliminate the value of having assets that protect the portfolio against hard falls.

That’s all for now.

An Optimistic Assessment of COVID-19, Part 4

An Optimistic Assessment of COVID-19, Part 4

To my readers: I’m having a WordPress issue where I can’t get images to show up in new posts. Here’s my summary for my article.

Summary

  • The rate of growth of new cases is declining for most nations
  • And, the absolute number of new cases is falling as well
  • About half of the countries that I track are now posting new case counts that are below what the models estimate. Sadly, not the USA… American exceptionalism, you know. We’re #1, in total cases of COVID-19.
  • Most of the developed world hits the 99% mark for cases for the first wave by the end of April. Slower than what I projected earlier, but faster than what most have argued.
  • Will the cost of the COVID-19 crisis be a financial and/or political crisis?

This is all I am writing on this tonight, as I am worn out from trying to fix the blog images.

Continuing An Optimistic Assessment of COVID-19, Redux

PIcture credit: Aleph Blog, and the same for all the graphs and charts in this post. All liability for mistakes here is mine.

Since then I never pay attention to anything by “experts”. I calculate everything myself.

Dr. Richard Feynman, Part 5: “The World of One Physicist”, “The 7 Percent Solution”, p. 255, quoted here.

Outline

  • Summary
  • Introduction
  • On the Limitations of this Model
  • The Graphs — Second Wave, FInishing the First Wave, Coming to the Turning Point, Problem Children (Turkey, USA, Canada, Iran, UK, Brazil, and France)
  • Closing

Summary

Though the USA model has lagged considerably, and a some of the other modeled countries have lagged a little, the central thesis still stands. Things are getting better faster than most of the politicians, policymakers and media have been forecasting.

Introduction

To those reading me for the first time, you should read the following articles to get up to speed. Those who have read me for a long time know that natively I am a pessimist, so it is unusual for me to be writing as I am doing now.

Before I go on, I want to explain what the two rightmost columns on the tables above and below mean.

  • 7D Trend — the seven day sum of forecast errors as a ratio of the number of cases at the beginning of the seven days. Positive means the model has been underestimating. Negative, overestimating.
  • Dir — Direction of the seven days of forecast errors — beta coefficient of the forecast errors versus time as a ratio of the number of cases at the beginning of the seven days.

The idea is to try to point out where the model is persistently missing, how large is it, and is it correcting or getting worse?

On the Limitations of this Model

All models have limitations. This model, being used to extrapolate, definitely has limitations. Extrapolation, as I have said, is dangerous. It’s dangerous because we know the past data with some degree of error, and the future not at all. Extrapolation, even if the underlying functional form used for estimation is right, assumes that all processes generating the values estimated are not shifting. If that is a good approximation to the reality that comes, luck will come marching in as genius.

This is a time series model. There are many structural models out there, and the “experts” estimate and use them. They have more data than I do. Those models suffer many of the same problems that complex economic models do. There are too many parameters to estimate, and they face the same problem I do with the future shifting, and errors in past data, as well as functional form issues. They are also subject to social and economic pressures that I don’t have to the same degree.

Scientists need the approval of their peers in order to publish and for general happiness. They need to be able to make money to survive. It is difficult to get tenure, and most scientists won’t take chances with that process.

It gets worse when science is being used for policy purposes, and gets picked up by the media. Caution is ordinarily a good thing,, but not when it misstates what is going on in order to achieve the ends of third parties. Tell the truth, and then let the politicians, policymakers, lawyers, businessmen, etc. figure out what they will do. The media almost always prefers sensational, sharp, easy-to-tell stories, over the complexity of what is true. The same is true of most average people who would rather not think hard, but just imitate the behavior of others.

Thus I tend to distrust “experts” whose ideas are used for political or policy purposes, and get trumpeted in the media. Their incentives are skewed — once you get close to fame, power, and maybe even money, you’d like to keep it, and that is a snare for many.

Practically, for this model, the difficulty comes around the middle, where the shift is happening — new cases peaking, growth in total cases decelerates. Why is it difficult? Small changes make a big difference to the shape and height of the curve. The prior day’s curve is anticipating a certain amount of deceleration in the growth in total claims. When the data arrives with more new cases than anticipated, the new curve will be taller and longer. VIce-versa if less new cases arrive. That is why for some areas that I modeled, the process seems to stall around 40-60%.

Now, there are raw data errors as well, like China on 2/12 and France on 4/3. There are nations like Iran where the political turmoil may have led to delayed reporting.

But for the most part, the models have worked well, just not so well for the US yet. We’ll get to that later. Before I do, I want to state a few things I have learned as I have gone through the modeling, which has been a learning process for me.

  • Look at the percentage of population that the model is projecting for reported infections. If it’s not high enough, the model is wrong. Unless a nation jumped on the problem immediately, you won’t get results like South Korea.
  • The nations that tested more as a percentage of population, particularly early in the epidemic, did a lot better.
  • Repeated forecast errors in the same direction indicate the process for new claims is changing, and the model is trying to adjust.
  • In that situation, if we?re only getting better at finding those infected, the upper part of the curve should tail off sharply.? On the other hand, if the if the ratio of new cases to total cases is protractedly rising because more infections are occurring, that?s an increase in the ultimate level of reported cases.
  • Once a nation gets to the 10% point, getting to the 90% point takes three weeks or so. Getting to the 99% point takes 4-5 weeks.
  • The markets will anticipate the end, with false starts, and a lot of noise.
  • As Buffett says (something like): I’d rather be approximately right than precisely wrong… or, Rule 65: “The second-best plan that you can execute is better than the best plan that you can?t execute.” My goal was to get some idea of when the market might turn. In that sense, this has been a success.

The Graphs

As in prior posts, I will run through the graphs now.

Second Wave

Finishing the First Wave

I write this with a little concern that I might be early on Italy and Switzerland, but new cases have been slowly rapidly for the two of them and Austria. Note that all three of them did a lot more testing per capita than most nations. You can see that here. The table sorts itself if you click on the top of the columns.

Coming to the Turning Point

For Belgium, Germany, Netherlands, Portugal and Spain, new cases are declining, though not as rapidly as the model would predict. Even with that, it seems likely to me that all will pass the 90% point within a week.

Problem Children

Turkey

My problem with Turkey is that the expected total population infected is too low. They got to the game late, and the curve looks too sharp. I would expect this to not turn as quickly as the model says.

United States of America with some States and Cities

Yes, the USA has been slower than I expected, and I think I have a good reason for it. I gained the reason while trying to model the world as a whole for the COVID-19 pandemic. Using the logistic equation as my functional form, I could not even in the slightest achieve a positive pseudo-R-squared. Why?

If you add together a bunch of logistic curves with varying timing, height and sharpness, there is no guarantee that you will end up with a logistic curve. The US is a big place, and the population is spread out, with many different large population centers. Much as would have killed me timewise unless I had better software, I think it would have made more sense to model the US as a bunch of logistic curves state-by-state, and add them up.

Here’s a demonstration for the past week: if I take the forecast errors of New York State and New Jersey, they are roughly 65% of the forecast errors for the US as a whole. Together they have 47% of all reported COVID-19 cases.

There have been statements by some politicians that there will be a lot of new “hotspots” across the US, it’s a tempest in a teapot. The dense and large cities like New York City and Boston have a lot harder of a time preventing the spread of an epidemic. Areas that are smaller and less dense won’t have the same impact, not even proportionate to their sizes.

The US has been making progress, just not as fast the model predicted. I would be surprised if the US weren’t at the 90% point by what is normally tax day. It takes three weeks or so to get from 10% to 90% and another week or two to get to 99%. We will likely see the practical end of this in April. It’s just a question of when.

Canada

I place Canada in the same boat as Turkey. Too few ultimate cases. It will likely revise upward. That said, their population is more spread out, so it will likely have fewer cases per capita than the US.

Iran

After several weeks of having claims far higher than the model would predict, the curve for Iran has regained a normal shape. The expected ultimate number of reported cases is on the low side of reasonable, and the model is finally tracking well. This is a watch and see sort of thing because of the instability in Iranian society, particularly amid the epidemic.

United Kingdom

The UK is on the same path as the USA, only 5-11 days behind. Their new case rate is decelerating slowly, but it is decelerating.

Brazil

The expected ultimate number of reported cases is too low, and the model is too new. Conditions in Brazil are less than orderly, so I would expect this model to revise significantly upward.

France

On 4/3 of the French government announced that they had only been counting deaths in hospitals and as such reported 23,000 new cases. Since that time the model for France has been posting negative forecast errors, and is slowly returning to a normal shape. I would expect in a week that the curve will look normal, and that the crisis in France would end about the same time as for the US.

Closing

That’s all for now. For those talking about these posts on Facebook, please note that I don’t interact there much. It’s best to comment at my blog or email me if you want my attention.

Continuing An Optimistic Assessment of COVID-19

PIcture credit: Aleph Blog, and the same for all the graphs and charts in this post. All liability for mistakes here is mine.

Recommendations and Comments

  • To the National Governments and Central Banks: don’t create a lot of policies that you might need to reverse. This crisis is coming to an end faster than most are reporting/proclaiming. If a policy is easily reversible, get ready. Start planning for dealing with the second wave of the pandemic.
  • To US State Governments and city/county governments: start figuring out how you will targetedly let up on the restrictions that you have imposed before you realize that you are behind the curve (again). Start planning for dealing with the second wave of the pandemic. It would be better to let younger people go back to work, and shelter those more likely to get a deadly case of COVID-19. (Aside: if this ends early, note the people who told you that it would long and big, and remove them as advisors.)
  • To the media: please calm down. This is one of those situations where it gets worse before it gets better. We are through most of the worse, but to the average observer, they don’t see the better, even though the point of maximum pessimism has passed.
  • To individuals: if you don’t have a lot, take heart that this first wave likely won’t be here much longer. Use your money carefully. To those who do have money, as a nation moves from 50% to 75% complete in the first wave of the virus, it might be a good time to own a little more stock. I don’t usually encourage speculation, but it might be warranted here. Remember, don’t invest anything you can’t afford to lose.
  • Last, my models last week were too optimistic, but not by much. The growth rate of total cases is generally dropping pretty quickly, but you couldn’t tell that from what you are hearing from politicians and the media.

Introduction

Before I start, I want to explain what the tables above and below mean.

  • The figures underneath the percentages are dates. The dates are estimates of when the country, state or city will have experienced 10%, 50%, 90%, and 99% of the total COVID-19 cases that they will experience in the first wave.
  • The peak day is the day each has the most new claims.
  • “Expected Total” is my estimate for the total number of reported COVID-19 claims in the first wave.
  • “% pop” is the percentage of each population that will be reported as infected with COVID-19.
  • “% complete” is the ratio of estimated current total cases to estimated final total cases fo the first wave.
  • Pseudo-R2 is the percentage of the total variation in the total cases explained by my three-parameter nonlinear regression. Because the regression is nonlinear, it is not an F-statistic, and gives us only a spit-in-the-wind sense for how good the regression is. Some have asked if I could add error bands to my models and the answer is no, because the nonlinearity of the equation makes that difficult. I’m only working with Excel, and looking through my old Econometrics texts, they don’t have an answer for this one. Maybe I should start modeling in R.

You’ll note that I added six additional models to this post.

  • One country: Turkey (I am modeling any country that gets more total cases than S. Korea.)
  • Three states: Maryland, Massachusetts, and New York. I’m modeling my home state, Maryland, Massachusetts for a friend, and New York because it has the most cases of any state.
  • Two cities: New York City and the Boston Area, which is the five counties near Boston (Essex, Middlesex, Plymouth, Suffolk and Worcester). New York City, because it has the most cases of any city, and Boston, because of the aforementioned friend.

Data and Resources

Before I go on, I want to point out some useful sites for getting data and resources. If you think you have other useful resources, please post them in the comments.

Limitations of what I am Writing About

I am forecasting one variable in each geographic area — reported total claims as of a given date. I am forecasting this for several reasons.

  • It is relatively easy to do. If I tried to estimate medical resource usage or even deaths, I would need more data that I don’t have access to in order to do reasonable models in that area. (Now that said, a hidden assumption of the analyses is that there is some regularity to how cases get reported. If that changes, the models will be less accurate.)
  • Reported total claims is a leading indicator for other variables of interest. In addition to those mentioned in the first point, total reported claims is a leading indicator for the economy, lifting of government restrictions, and the financial markets.
  • It’s not as if there aren’t complexities that could mess with an analysis like this. When testing becomes common, you might see total cases go up a lot from all of the asymptomatic or low symptomatic people who are suddenly found and are no longer infected. That sort of shift would give the appearance of COVID-19 taking off, when we realize that that data belongs to the past, even though it is reported in the present.
  • No one wants to say it, but there are tradeoffs involved in having governments be too ham-fisted in their regulations. Those regulations are impoverishing a lot of people, and many of the restrictions are not needed in order to have the same level of societal safety.
  • There are also tradeoffs of life and money… and this is not new. Life is precious, no doubt, and money can often be replaced, but where does the money come from? Would it be right to be Robin Hood and push 100 unrelated people out of work in order to save a life? Perhaps it would be better ask for volunteers. It would be more ethical for the government to raise taxes, than to put on restrictions that harm the economy a lot, with few additional lives saved.

This is an economics, investing and finance blog. I focus on those matters. It’s not a healthcare blog. When I think of my average reader, that person is not thinking a lot about the problems from medical resource shortages, except perhaps the lack of ability to test for COVID-19. It’s different if you are in the medical profession or if you are sick. You would care a lot about these issues then, and my heart goes out to you, because you are having a challenging time with short resources.

As an aside, when you think of medical efforts in the US generally, with the emphasis on trying to manage costs, hospitals and inventories of supplies and equipment are light because in normal times, those were easy places to save money. Few would complain much (except closing rural hospitals) because there would be enough resources under 99%+ of all circumstances. This is fine, until you experience the low probability and high severity event. This is common to other disaster scenarios as well — there is often a complaint over lack of redundancy or robustness of some resource. (Not enough policemen, firefighters, ice, electricity, phone connectivity, emergency shelter, etc.)

I am not saying my analysis is the whole enchilada, but it is an important part of it. And with that, on to the graphs:

Past the First Wave, in the Second Wave

China has averaged 55 new cases of the past 10 days, and South Korea that figure is 99. The trend seems to be up, but with a lot of variability. I liken the second wave to what needs to be done after the main battle with a forest fire is done. You still have to put out some minor fires before they turn into something major. Eventually, like say in a month or two, most nations will be dealing with this.

Because of this situation, the models fit less and less well. I could add in a second logistic curve that starts where the first one ends… though it seems like overkill from a modeling standpoint. It wouldn’t be difficult to do.

Approaching the End of the First Wave

Austria, Switzerland and Italy are most likely past the 80% point. By that point reported new cases are declining quickly, and total cases are growing at around a 4% daily rate, and the growth rate is falling quickly.

As an aside, this is a good time to talk of how the media, and sometimes even policy makers who should know better, are practically innumerate in terms of the verbs that they use. They look at the raw increase in cases and say that they are soaring. It varies by geographic area, but the daily percentage growth in total cases and daily percentage growth in new cases is like this:

Percentage Completed Daily % Growth in Total Cases Daily % Growth in New Cases
0-10%18-35% nearly constant daily growth, but absolute numbers are low.Exceptionally high and erratic, 30-50%/day , but absolute numbers are low.
10-50%Rate of growth falls into the teens of percentages. If the starting percentage is lower in this interval, so will the ending percentage. Absolute numbers sound large, especially nearing the halfway mark.Rate of growth falls rapidly to zero by the end of this period
50-90%Rate of growth continues to fall to the low single digits of percentages, say 2-4%. Absolute numbers sound large but rapidly get smaller toward the end of this interval.Rate of growth is negative, and gets more negative as the interval gets to the 90% mark.
90-100%Growth is very low. Absolute numbers are low.Growth is negative and erratic. Absolute numbers are low.

It’s in the middle two zones where the absolute numbers are high that the rhetoric gets shrill. Compare that to me where at 8PM Eastern Time, I sit down and update my models and comment on how close they came to the modelled estimates. The absolute numbers of total cases, new cases, total deaths and new deaths make great headline fodder, but the real news should be looking at the percentage rates of growth of total cases and new cases. But I suspect that would be a tough thing to see change.

Middle of the Pack

Germany, the Netherlands, Spain, and the US are the next group. New cases are either rising at a low rate or declining. Growth in total cases is in the high single digits of percentage. These countries aren’t out of the woods yet, but are likely past the halfway point.

Some of these had high new case surprises over the last week, but on the whole showed improvement.

Bringing up the Rear

Each of these had significant upward surprises in terms of new cases reported. The growth rate of reported total cases is in the mid-to-high teens.

Too Early to Tell

I did not model Turkey in the last article. It has a really sharp takeoff and deceleration of growth that looks too good to be true. (The US is that way to a lesser extent.) I need more data before I can be definite about this.

Problem Child

Compared to last week, Iran has gone backward. New cases have been growing more rapidly, and the growth in total cases shows no sign of slowing. It will be interesting to see how this develops — it doesn’t fit the model well, unless….

Unless you think of it as several logistic curves in different areas that have taken off and leveled at different points in time. Now that said, from what little I have read, there seems to be a lot of disagreement in Iran over what to do. And to some degree, a populace that doesn’t trust the government much… so it’s not a recipe for constructive collective action.

States and Cities

Massachusetts and Boston Area
New York State and New York CIty
Maryland

The logistic curves for smaller, more homogeneous areas tend to be shorter and sharper than those for broader areas. The data also tends to be more noisy, but that’s what the regression analysis is for — smoothing out the data in a theoretically consistent way, and allowing tracking to be done so that a policymaker could estimate if they are doing better or worse than expected. It would certainly calm some politicians down if they had an idea of how things are likely to develop, and if a deviation happened, they could try to explain why, allowing for the level of uncertainty in analyses like this.

And so at the end, can I offer a happy surprise to New Yorkers, both those in the city, and those that are upstate? There will still be problems for a while, but it really seems like you are getting to the end of the trail. In two weeks, you should be a lot happier. And the same will likely be true in Massachusetts and Boston, and in my adopted home state, Maryland.

But here’s the key question. How ready will the politicians and policymakers be to accept the good news? I fear they will not be happy with it at all, but will remain cautious in the wrong way too long. There is kill, and there is overkill. Kill is enough.

I would encourage the politicians to have us continue to do social distancing, but to reopen businesses, requiring them to follow certain sanitary and distancing procedures. Perhaps those who are infirm, or are over 60, 65, 70, or so should continue remain at home, or only go to necessary places a while longer.

There is a price to everyone staying home. There is a political price to politicians that maintain it too long. Better to modify policy such that it is a sniper rifle, and no longer a blunderbuss.

It Doesn’t Get Much Better Than This?

Photo Credit: Valerie || Photo taken from the coast of Key West at sunset. Relaxing and peaceful, so they say…

Image Credit: Aleph Blog

What an amazing three days. I’ve said to some of my clients that moves of this magnitude are highly unusual. How unusual?

The returns of the last three days would rank sixth in the top ten three-day moves upward for the S&P 500 since 1928. When did the rest of the top ten take place? During the Great Depression — four in 1932, three in 1933, and one each in 1931 and 1935.

Given the overall difficulties of the stock market in the Great Depression, one could say that the 2020 stock market should find being peers with which to keep company.

One more note about March 26th, 2020, that sets it apart: It’s the only one of the dates that may be a bounce up from a bear market low. The fastest bear market may become the fastest bull market if the S&P 500 closes above 2685 soon.

It Doesn’t Get Much Worse Than This?

Image Credit: Aleph Blog

Consider monthly price volatility. Using 21 days to represent a month, the standard deviations of price movements for March 26th would be the eleventh highest. When did the other ten take place. One day after another for ten trading days starting on November 14th, and ending on the 27th of the same month.

Do you feel like the current market action has slugged you hard? I do. That would be a normal feeling, as we haven’t been through anything quite like this in our lifetimes.

Even if you look at implied volatility, for which we only have data since 1986 (if you are looking at the old VIX, 21-day average volatility would have ranked 54th. 39 trading days starting on October 27th, 2008, and 14 trading days starting on November 3rd, 1987 ranked higher. Still it been fascinating to not see the VIX move down much over the last three days. Perhaps there are a lot of investors still aggressively buying puts and calls.

Four Interesting Periods in the Stock Market

So think about:

  1. The Great Depression
  2. Black Monday and related problems in 1987
  3. The Great Financial Crisis in 2008, and
  4. Now

The two “Greats” had collapses in asset prices and corresponding impairments of banks, and some other financial institutions. They were for practical purposes universal panics.

1987 was shocking, but it came back fast, and it didn’t have much collateral damage. The current time period? Well, banks are lending to creditworthy borrowers, and March is a record for US dollar denominated investment grade corporate bonds, Jon Lonski reported at Moody’s in his report released tonight. There’s no lack of liquidity to the big guys with normal balance sheets.

For CLOs, MLPs, repos and Mortgage REITs, that’s different. They are highly dependent on capital market conditions to do well. They are “fair weather” vehicles. In this situation, the Fed is extending itself in ways that it doesn’t need to, and for areas that should be left alone. Nonbanks should not be an interest of the Fed. If you’re going to take all systematic risk away from business, they’re going to behave in even more aggressive ways, and create an even bigger crisis. This one would have been small enough for the private sector to handle, once the initial wave furor over COVID-19 dies away in a couple of weeks.

Same for the Treasury. We don’t need the stimulus, and recessions help to clear out bad allocations of capital. This is a waste of the declining creditworthiness of the US Treasury, which will find itself challenged by a bigger crisis in 10-15 years, with no flexibility to deal with it.

Two Final Notes

I have a series of four articles called, “Goes down double-speed.” The market going down rapidly is less unusual than it going up rapidly. Typically the speed of down moves is twice as fast as up moves. For the current up moves to be so fast is astounding. I would say that it shouldn’t persist, but I think the market will be higher because the first wave of COVID-19 will fade.

And so I go back to one of my sayings: “Weird begets weird.” Weird things happen in clumps, in bunches. Much of it is driven by bad monetary and fiscal policies, including policies the encourage people and institutions to take on too much debt. Unusual factors include COVID-19 and the policy response to it. Part of it is cultural — we take too much risk as a culture, which works fabulously in the bull phase of the cycle, and horribly in the bear phase.

And thus I would say… prepare for more weird. Like COVID-19, it’s contagious.

An Optimistic Assessment of COVID-19

PIcture credit: Aleph Blog, and the same for all the graphs and charts in this post. All liability for mistakes here is mine.

This post is different than any other I have done at Aleph Blog. I will try to write this in a nice way even though it is a strong and out-of-consensus opinion on a topic that many are edgy about.

I realize I might be wrong here, but I will present to you what I think, along with what I think are the limitations of my analysis. Part of my reason for writing this is that I think that most of the reporting on COVID-19 is subject to a bias common in our culture among politicians, lawyers, bureaucrats, and the media: an extreme bias toward safety because the costs of being wrong on the optimistic side are high than the rewards for being right. (Example: NOAA overpredicts disasters, and so do most hurricane forecasters.)

This post will be structured like this:

  • Summary of findings and recommendations
  • Limitations of the analysis
  • Breaking down the results by groups of countries
  • A discussion of the “Second Wave,” with policy recommendations
  • Closing comments
  • Appendix for math nerds

Summary of findings and recommendations

  • The First Wave of the crisis will pass more quickly than most expect. Most countries with a large number of COVID-19 cases will have 99% of their First Wave cases reported by mid-April.
  • Of the 13 countries with the most cases of COVID-19, the least of them has reported 41% of their likely First Wave cases. Of those same nations, none are expected to have more than 0.3% infected with COVID-19.
  • The real challenge will come in dealing with the Second Wave of the crisis. How do governments deal with a smallish number of new cases, and keep them from growing into a new epidemic?
  • In the Second Wave, governments should selectively tell some to stay home, while telling most people to get about their normal work.
  • Quarantine those who are sick with COVID-19 and those who have been with them, until they are tested and have a negative result. Continue to disallow international travel, or insist on a two week quarantine upon returning.
  • Let healthy people return to their work. All businesses are necessary businesses.
  • Avoid bizarre stimulus programs that are harmful in the long run. Tell the Fed that monetary policy can’t solve everything, and not to play favorites.

Limitations of the analysis

  • I am not a public health specialist. I am a statistician with a background in econometrics, which has its similarities with biometrics.
  • My analysis assumes that processes for finding new cases of COVID-19 are constant, or mostly so. That is not always true — an example is when China announced a large amount of new cases all at once.
  • I use an inverse logistic curve for my analysis. All functional forms have their limitations, and for the nations analyzed as of this date, the minimum pseudo-R-squared is 79.4%, and the highest is 98.5%. That said, this is a common functional form for epidemics.
  • The model assumes that there is one wave. That will not prove to be true, as can be seen from China and South Korea.
  • All sorts of things can go wrong that are not in the data now — mutations, civil disobedience, large bureaucratic errors, large policy errors, etc.

Analysis By Group

Those that are though the First Wave

We have two in this group: South Korea and China. I don’t trust China’s data. In each case, though, you have the First Wave go through their nation and burn out, followed by an excess number of new cases where the public health authorities may not be catching up with what could be the Second Wave. I’ll talk more about the Second wave below.

The unusual case of Iran

Really, I don’t know what is going on in Iran on COVID-19 but it looks like the initial new cases started to slow down, and then they let up on restrictions too soon. New cases hit a new high yesterday, which doesn’t fit the paradigm of a consistent response the the crisis. COVID-19 seem to be out of control in Iran.

Those that are close to done

Italy and Germany are past the halfway mark in the epidemic, and are having lower new cases on average daily.

In general, the policy responses of a nation influence the amount of the population subject to infection, and the ability of the infected to interact with the broader society.

The rest

These are the nations that have not certainly passed the 50% mark as of today as I estimate the infection. As I have watched this develop over the last week, the most difficult aspect of estimation comes when you are near the halfway point. Small changes in actual new cases make a big difference in estimated new cases. An example is the United States, who has had significantly lower new cases than expected for a preponderance of the last week. The US got off to a slow start in its reaction to the crisis, but seemingly has caught up and then some.

WIth these countries, the odds of being wrong is the highest. Thus all conclusions with them must be considered tentative. But with so many of them following nearly the same pattern, despite very different responses to the crisis, gives more certainty to this analysis.

A discussion of the “Second Wave,” with policy recommendations

When you look at the data of CHina and South Korea, you see how the epidemic went through the s-curve, and then has persistently high new cases thereafter. I call this the “Second Wave.” Iran seems to be a case where their society inadequately stops transmission, and so instead of following an s-curve of an exponential, it seems to keep increasing in a way that is almost quadratic — slow but steady.

This will be the grand problem for most countries. How do you eradicate the virus after you have had large success in interrupting its transmission? Looking at the relative success of South Korea in the First Wave I would say that you do the following:

  • Test and quarantine aggressively.
  • Of those who test positive for COVID-19, quarantine all of their contacts, and test them. Continue quarantine for those who test positive, and quarantine/test their contacts as well. Repeat as needed.
  • But don’t quarantine everyone. Let those who are healthy work. Encourage those who are old or have compromised immune systems to stay home for the duration of the crisis, and give some assistance to them.
  • Don’t assist all of society because that is way too expensive and not needed — get them back to work. Don’t give into the idea of denying people work and then offering meager assistance. It is an inferior idea for those who are healthy.
  • This applies to the actions of the Federal Reserve as well — don’t harm the value of capital by artificially creating more capital that has no earnings capacity.

Closing comments

This analysis shows the the slowest of the nations written about here is passing the middle of the crisis quite rapidly, and the practical end of the crisis is in mid-April, when 99% of all First Wave new cases will have been realized. The real challenge will come in dealing with the cases after that, which will be sporadic and localized. How do we keep that from becoming a semi-permanent bother to the world, because the cost of putting life on hold is high, as is the cost of losing lives.

Quarantining and testing aggressively is the best solution, together with letting the healthy work. This should be the guiding star for all policymakers, because we need to strike the right balance between breaking the social connections that lead to disease transmission, and allowing people to labor to support themselves. We are not trying to save the financial markets; we are trying to protect people who work.

Appendix for math nerds

The above was how I structured my analysis. It followed a logistic curve, which has the following benefit: infections begin exponentially, but get retarded by two factors: one is that even if people do almost nothing as in 1918, the uninfected population shrinks, which blunts further growth. Second, people act to blunt further growth. They separate themselves from each other, and particularly those who are infected. This is is akin to removing fuel from the fire.

The logistic curve has a number of advantages for estimation. It notices the slowing down of the percentage growth in total cases, while media and politicians continue to panic.

Remember that that the media and politicians selfishly like to maximize their influence, and try to create panics — it is good for them to maximize fear. The same is true for many in public health. Truly, we should spend more on public health, but it is one of those things that governments naturally neglect… because they are short-sighted, and will not spend money on something the lowers risk, but does not bring any present good. (Note to Christians: in the Old Testament public health was a function of their government via the priests. It should be a normal function of government to deal with contagion.)

Final note: I did not write this with Donald Trump in mind. I did not vote for him and will not vote for him. That said, he is on the right track when he says the cure should not be worse than the disease.

It is foolish to warp monetary policy and fiscal policy when healthy people are perfectly capable of working. Don’t destroy ordinary incentives and rack up tons of debt by keeping people idle. Test, quarantine, test, quarantine, etc. , but leave the main body of society alone, particularly for a virus that does not harm the healthy working population much.

To that end, I ask that Republicans be real Republicans, and not expand the deficit further. I ask that the Federal Reserve stop trying to be God, and be content with merely having a currency with a consistent value.

Government is best when it is small. We are not facing the Black Death, nor the Spanish Flu. We will get through this, God willing. We don’t need to panic.

Too Much Debt

Photo Credit: Steve Rotman || As Simon and Garfunkel sang, “The words of the prophets are written on the subway walls…”

Debt-based economies are unstable. Economies with a lot of short-term debt are more unstable. The Fed is like Johnny One-Note, or Fat Freddie with a hammer. They only know one tool, and it will solve all problems.

Are there problems from too much debt? More debt will solve the problem. Shift debts from the private to the public sector. Don’t let the private market solve this on its own.

Though the bed debt is not in the same place as the last crisis, we are once again trying to play favorites through the Federal Reserve and rescue entities that took too much risk.

My view is let them fail. The whole system is not at risk, and the COVID-19 crisis will pass in two weeks. The great risk is not from the disease, but from the ham-handed response from policymakers who are short-sighted, and highly risk averse to the point of not wanting to cross the street for fear of dying.

Have we become like the Chinese, who bail out their banks and non-banks regularly? Who can’t bear to see any significant institution fail?

(Yes, I know they are getting more willing to see entities fail in China, but why are we getting less that way in the US? Let market discipline teach companies to not have so much debt.)

Here are three things to consider:

  1. Bond ETFs Flash Warning Signs of Growing Mismatch — The Fed now think its purview extends to managing the discounts of bond ETFs? Let the system work, and let profit seeking institutions and individuals benefit from artificially high yields. Let insurance companies do what I did: purchase a cheap package of bonds in an ETF, and convert it into the constituent bonds, and sell those that you don’t want for a profit. (Losses from ETFs premiums and discounts are normal, and it is why the dollar weighted returns are lower than the time-weighted returns.)
  2. The same applies to repo markets. As I have said before, the accounting rules need to be changed. Repo transactions should not be treated as a short-term asset, but as a long asset with a short-term liability, because that is what it is. With Residential Mortgage-Backed SecurIties in trouble, the market should be allowed to fail, to teach those who take too much risk to not do that. This failure will not cascade.
  3. The same applies to the crony of Donald Trump — Tom Barrack. He pleads his own interest, seeking for the Fed or the Treasury to bail him out, and those who are like him. Let him fail, and those who are like him.

Market participants need to know that they are responsible for their own actions, particularly in a small and short-lived crisis as this one. COVID-19 as a systemic crisis will be gone within weeks.

My statement to all of those listening is “When will we set up a more rational system that discourages debt?” We could made dividends tax-exempt, and deny interest deductions for non-financial corporations, including financial subsidiaries of non-financial corporations. Of course we would grandfather prior obligations.

Are we going to wait for the grand crisis, where the Fed will continue to extend credit amid roaring inflation, or where extend no credit amid a tanking economy? This is what eventually faces us — there is no free lunch. The Fed can’t create prosperity via loose monetary policy, and Congress cannot create prosperity via loose fiscal policy.

The bills eventually come due. The USA might get the bill last after the failure of China, Japan, and the EU, but it will eventually get the bill.

As such, consider what you will do as governments can’t deal with the economic and political costs of financing the losses of the financial system.

The Worst Policies are Made During Crises

Photo Credit: Mike Licht || As a culture, we are very much “live for the moment.” But what happens when buyers of Treasuries decide that it’s not worth it anymore?

I am not a fan of the Democrats or of Big Government Republicans like Bush Jr. and Trump. In general, I think we need to shrink our government, decentralize, and de-lever our economy such that we make debt a smaller component of how we finance our lives. The Democrats talk about inequality, but they don’t really mean it. Increasing marginal tax rates is good show, but the real game is how income is calculated, and they won’t touch that, because their richest donors find ways to hide their income — the same as donors to the Republicans.

That’s why I call the governing elite in DC “The Purple Party.” A blend of red and blue, with just enough difference to get politically motivated donors to give, but practically doing the same thing, serving wealthy elites.

I’m going to make a post on COVID-19 next week, but my last post on the topic was too optimistic. That said, the politicians, particularly governors, are being scaremongers. They are vastly overestimating the size of the crisis.

What really bugs me are the foolish ideas being propounded by the Fed and politicians. Let me talk about a few of them.

1) Don’t close the stock or bond markets. Closing the markets does not eliminate volatility. It only hides it. Practically, it makes the price of securities to be zero for those who want to sell them. And, for those who left some cash on the side, it denies them the opportunity to profit from their wisdom.

2) The Fed should only hold short government debt. That is a neutral asset. Anything else makes the Fed play favorites in what they buy, whether it is mortgage-backed securities, municipal bonds, or corporates. Don’t let the Fed become a political institution, creating ad hoc policy by whose debt they do and don’t buy.

3) Don’t close businesses. Let all businesses set their own policies. They don’t want their workers to infect others. Let them operate.

The idea that there are “necessary businesses” is foolish. The “necessary businesses” rely on other businesses to be their suppliers.

What would be better would be to have extensive testing for COVID-19, and to quarantine those who are infected, and those who are not tested who had contact with those who are infected. Leave the rest of society free. Don’t close firms down, and then give some lame amount of government assistance to them. We do best when we are working. People staying at home lack the healthy stress that working provides.

4) Now, if you have to give assistance, giving it to people directly is the best way. I advocated for that in the last financial crisis. But you should give it to all Americans equally, to avoid favoritism. Now, there is the issue of those who buy US Treasury debt objecting to the concept, and I can respect that. Why else do you think that the yield on 30-year Treasury Bonds has risen 0.8% over the last ten days?

There is no such thing as a free lunch, and with all those advocating excessive deficit spending, I would say “Yes, the past efforts have not disrupted the markets, but if you read economic history closely, no one can tell what will make the paradigm shift. Are you feeling lucky?”

Summary

From my reading of the data, I don’t see how this crisis lasts past the end of April. Yet there are governors of states foolishly shutting down businesses, and thinking that they are doing something good. “Shelter in place” is a recipe for turning all Americans into lawbreakers in the same manner as is with highway speed limits. Do you really want to ruin our culture via overly strict laws?

What of the poor people running out of money? What of the small businesses that go broke? Governments should focus on testing for the virus, and quarantining those who have it and those who have had contact and are untested.

In closing, I would encourage all readers to vote all incumbents out of office. They are not serving the interests of average Americans well. They are cowards who listen to scaremongers, and that includes Trump.

PS — some people might suggest that I am not kind to those that are hurting. It’s not true. I give over 10% of my income to charity each year. Beyond that, I would challenge people to consider Venezuela. Many small to medium-sized actions by Chavez and Maduro slowly robbed the country of economic vitality. The wealthiest nation in South America became the poorest.

The same could happen here. Economic disasters often spring from something small — remember Ben Bernanke saying that the risk from subprime mortgages was “well contained?” Yes, subprime mortgages were small, but they represented the marginal buyers of residential real estate, so when they failed, so did property prices. Like dominoes, they fell.

Thus I am saying to urge the government to not engage in policies that increase its deficits. You can’t tell when the last bit of debt will be the straw that breaks the back of the camel.

The S-Curve, Once More, with Feeling

Photo Credit: Lars Plougmann || Indeed, this seems like a race, and the S-Curve is a major challenge to drive through

This will be brief, because I am still working on it, but it is my weak conviction that as far as the markets are concerned, the COVID crisis will largely be over by next Friday. How certain am I? Not very — I give it a probability value of around 30%.

If my thesis is correct, reported new cases of COVID-19 in the US will peak by Friday of this week, and will be 90% complete by next Friday. I will be watching how many new cases are reported. New cases tend to peak when total cases increase at a mid-teens percentage rate over the prior day. Because reporting is noisy, you don’t see that so easily, but the inverse logistic curves I am estimating are consistent on that figure for all the countries I have modeled so far.

I’ve run models for South Korea and Italy as well, and I’ll run them for a few more countries tomorrow. They are all pretty consistent with each other. Italy’s new cases should peak tomorrow, if they haven’t already.

I know everything is dark and gloomy now. Even if my modeling is wrong, which is a significant likelihood (I am extrapolating), I find it difficult to believe that we will still be in crisis mode by tax day.

So, cheer up. The number of COVID-19 cases is unlikely to be overwhelming, and we are all likely to survive this. The markets will revive, though maybe not energy stocks for six months. Those are a separate issue.

And if new cases track my estimates, I will put more money into the market. That’s all for now.

Theme: Overlay by Kaira