If you ask me what is more fundamental to me — am I an economist or and an investor? I will tell you that I am an investor. At present for my work I am putting together a pitch book for my company detailing my value investing for potential clients. In the process of doing that, I decided to analyze all of my investments over the past 7+ years, in an effort to find some stories that are representative of my money management methods (both good and bad).
In order to get those stories, I had to download and clean all of my transactions over the past 7+ years, and then calculate the internal rate of return on each stock that I bought over the period. I still haven’t written the stories, and would appreciate advice from readers as to which stocks to use.
As I did my analysis, I learned a few things:
- Over the 7+ years, I have owned 186 stocks.
- Slightly more than 75% of my investments have been profitable.
- My average holding period has been 503 days.
- I have hit some home runs, and hit into triple plays.
- My top 11 gains pay for all of my losers.
- My cumulative profits comprise more than two-thirds of my assets.
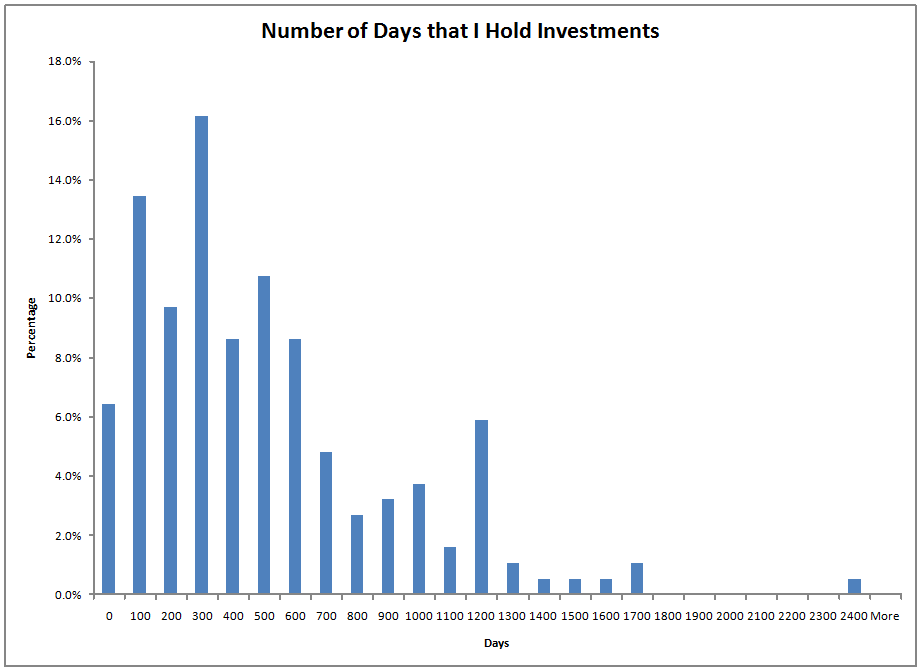
Holding Period

Now, on this graph, the days are averages, so zero represents 0-50 days, 100 represents 50-150 days, etc. As you can see, I occasionally trade (though usually not intentionally) , but most of the time I invest.
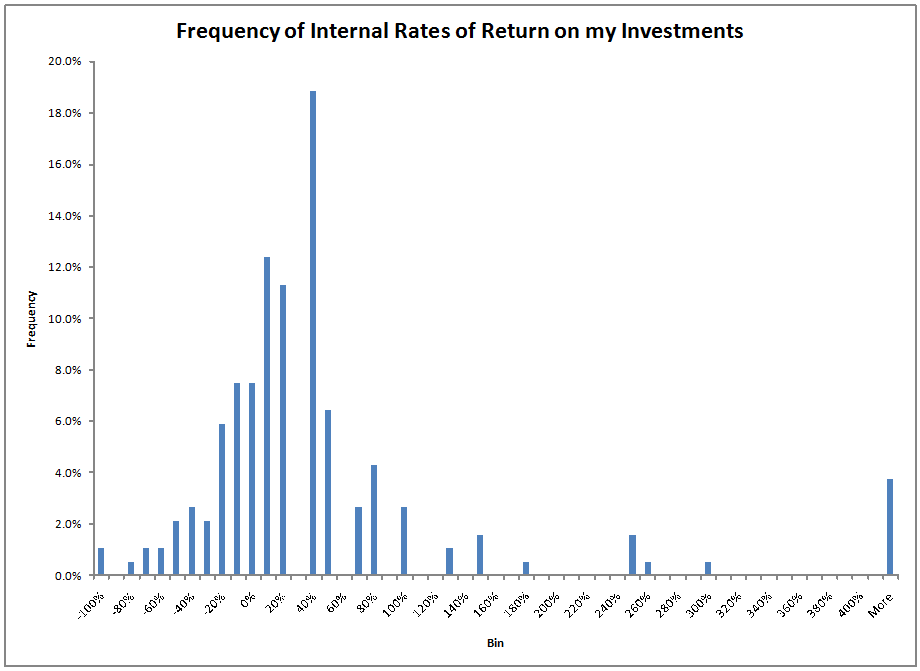
Internal Rates of Return
What is an internal rate of return [IRR]? It is the constant rate one earns on an investment from start to finish. It is a way of averaging out all of the cash flows, and annualizing the result, so that it can be compared against other investments. Here is a histogram of the internal rates of return on my investments:

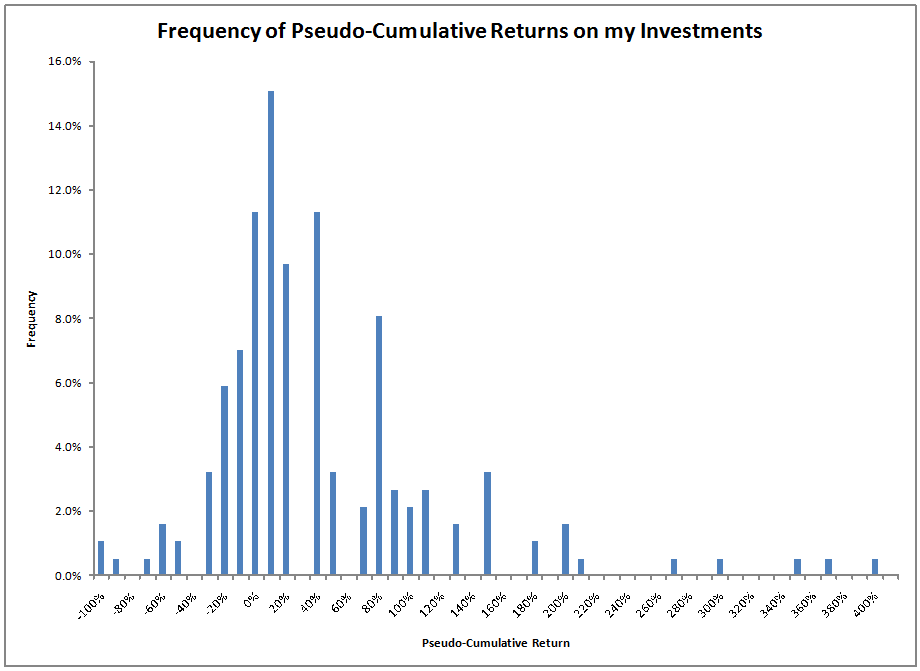
But, IRRs can be misleading. A small gain/loss in a short period of time can result in large absolute IRRs. That’s why I decided to create the imperfect concept of the pseudo-cumulative return. Suppose you earned the IRR over the full length of the investment? What would the cumulative return be?

Now, those who have followed me for a while know that my rebalancing discipline forces me to buy or sell after large moves. The pseudo-cumulative return usually overstates my return, because I sold on the way up, and bought on the way down.

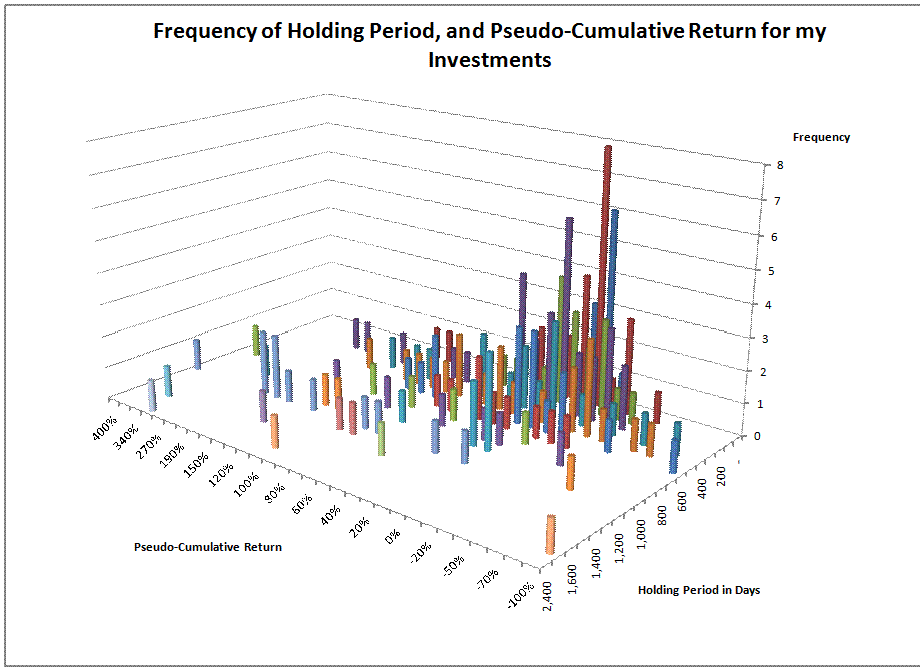
The above graph, tough as it is to interpret, gives a reasonable idea of how my investments have worked. Most of my investments last for a few years, some more, some less. I have tended to make money pretty regularly, but I have had some real stinkers. I’ll pick up on that theme in my next post on Monday.

And the portfolio total annualized returns for 1, 2, 3, 5, and 7 years are?
That analysis would probably be more intuitive to the reader, and provide a useful basis for comparison to the reader’s absolute or relative benchmark of choice.
Everyone’s a genius investor during good times.
What’s you average return in a “difficult” market. Let’s say, since August last year?
Agree. Also, small note: You let your relatively few losers run too long.
-Andy
You let your relatively few losers run too long.
Does that follow from the graphs? Yeah a few really stunk up the joint so to speak, but some of those other multi-year holdings are huge wins, and I’m not sure we know what they did in the early years? One could do some deeper data-mining and possibly determine something like, “if I am down >20% after 600 days, the investment never comes back.” But I’m not sure that can be inferred from what is shown above. (If it can please explain.) I think for all we know all those guys sitting at +100%, +1000d, were once -20%, 200d.
I’ll say for my own part, I kept track of something similar for myself, doing a histogram of investments vs. profits. I realized I kept having a few stinkers wreck otherwise decent returns. I tried a number of different things in hopes of identifying and separating the good from the bad. Nothing worked and I was left always second guessing myself. I eventually found using fixed dollar amounts and options was more suited to my type of win/loss, and suprisingly (because at my rational level I’d much prefer to be a long-term, deep-value buy and holder) my own personal style (in practice I’m much more at ease now and I’m not always second guessing myself). I still get the stinkers, but now they don’t hang around and they don’t overwhelm my winners. My win percentage is the same as it ever was, but now my winners and losers are balanced in size.
I bring this up to say there are multiple styles of investing (obviously) and objectively looking at your own historical results (as David has shown here) may yield surprising insights for yourself.
Maybe I let my losers run too long, but it is more that I have to do it in order to get the gains on the rest of the portfolio.