The Rules, Part XXXVIII
There is probably money to be made in analyzing the foibles of money managers, to create new strategies by taking on the opposite of what they are doing.
What errors do most money managers make today?
- Chasing performance
- Over-diversification
- Benchmarking / Hugging the index
- Over-trading
- Relying too heavily on earnings growth
- Analyzing the income statement only
- Refusing to analyze industries
- Buy newsy companies
- Relying on the sell-side
- Trusting management too much
Let me handle these one-by-one:
Chasing performance
In writing this, I am not against using momentum.? I am against regret.? Don?t buy something after you have missed most of the move, as if future stock price movement is magically up.? Unless you can identify why the stock is underappreciated after a strong move up, don?t touch it.
Over-diversification
Most managers hold too many stocks.? There is no way that a team of individuals can follow so many stocks.? Indeed, I am tested with 36 holdings in my portfolio, which is mirrored for clients.? Leaving aside tax reasons, it would be far better to manage fewer companies with more concentrated positions.? You will make sharper judgments, and earn better returns.
Benchmarking / Hugging the index
It is far better to ignore the indexes and invest in what you think will yield the best returns over the next 3-5 years.? Aim for a large active share, differing from the benchmark index.? Make some real nonconsensus investments.???? Show real moxie; don?t be like the crowd.
Yes, it may bring in more assets if you are never in the fourth quartile, but is that doing your best for clients?? More volatility in search of better overall returns is what investors need.? If they can?t bear short-term volatility, they should not be invested in stocks.
Over-trading
We don?t make money when we trade.? We make money while we wait.? Ideas take time to work out, and there are frequently disappointments that will recover.? If you are turning over your portfolio at faster than a 50% rate, you are not giving your companies adequate time to grow, turn around, etc.? For me, I have rules in place to keep from over-trading.
Relying too heavily on earnings growth
Earnings growth is far less predictable than most imagine.? Companies with high profit margins tend to attract competitors, substitutes, etc.
When growth companies miss estimates, the reaction is severe.? For value companies, far less so.? Disappointments happen; your portfolio strategy should reflect that.
Analyzing the income statement only
Every earnings report comes four, not just one, major accounting statements, and a bevy of footnotes.? In many regulated industries, there are other financial statements and metrics filed with the government that further flesh out the business.? Often an earnings figure is less than the highest quality because accrual entries are overstated.
Also, a business may be more or less valuable than the earnings indicate because of the relative ability to convert the resources of the company to higher and better uses, or the relative amount to reinvest in capex to maintain the earnings stream.
Finally, companies that employ a lot of leverage to achieve their earnings will not do well when financing is not available on favorable terms during a recession.
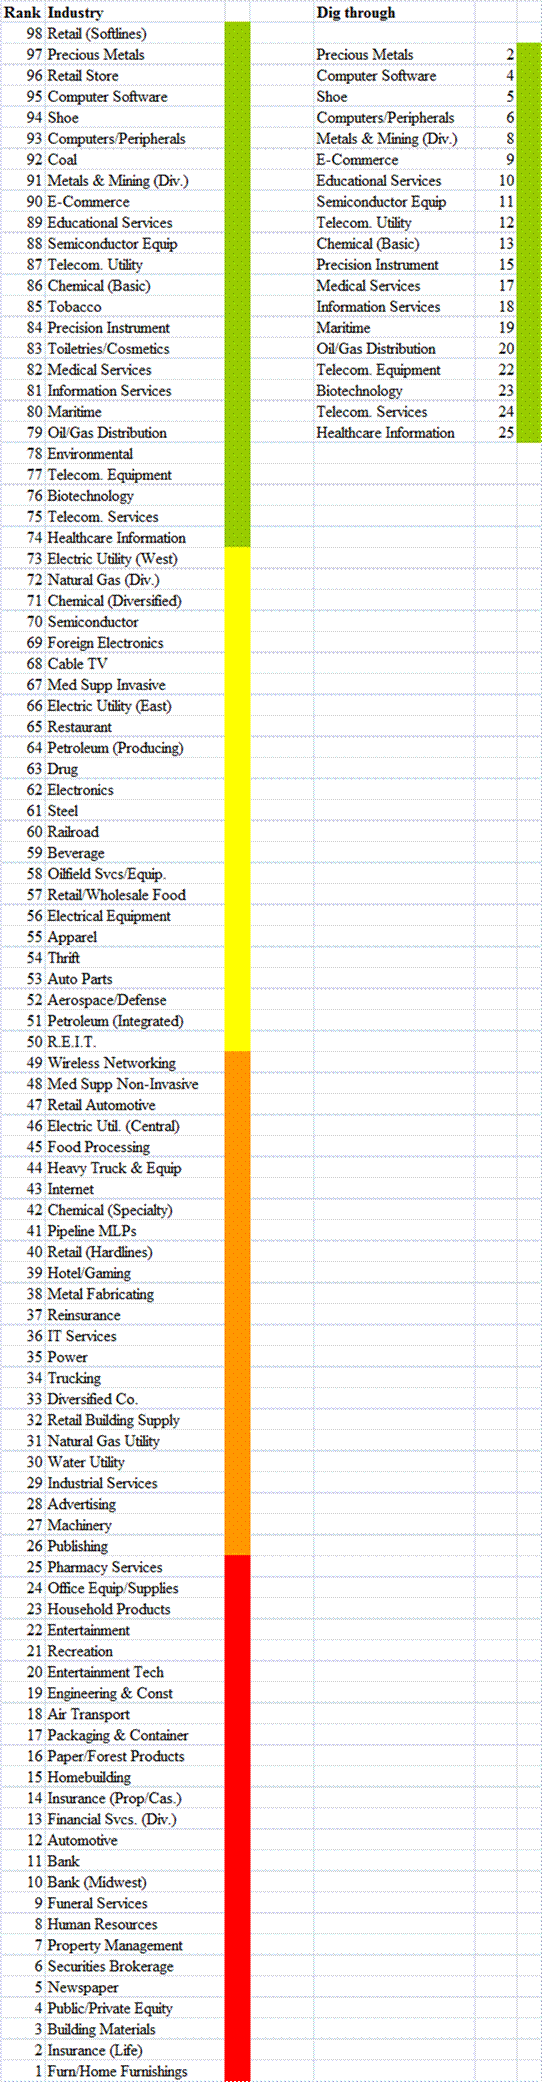
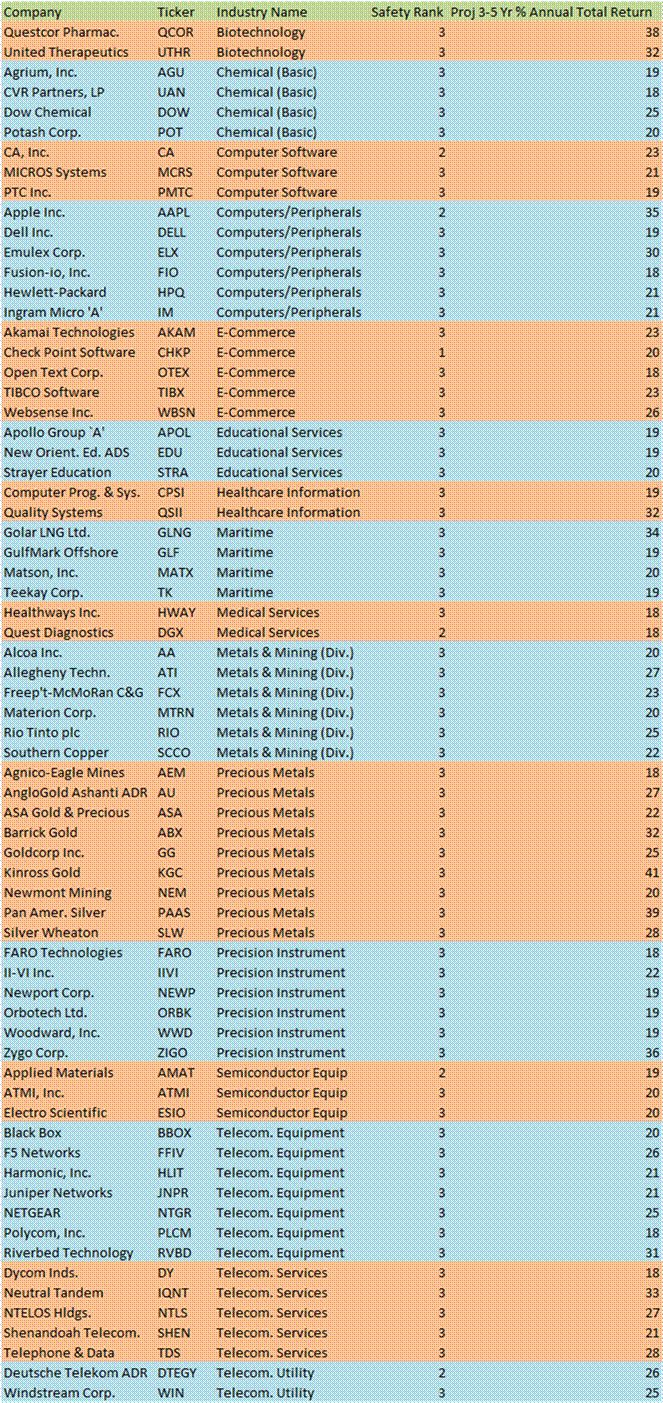
Refusing to analyze industries
There are two ways to ignore industry effects.? One is to be totally top-down, and let your view of macroeconomics guide portfolio management decisions.? Macroeconomics rarely translates into useful portfolio decisions in the short run.? Even when you are right, it may take years for it to play out, as in the global financial crisis ? the firm I was with at the time was five years early on when they thought the crisis would happen, which was almost as good as being wrong, though they were able to see it through to the end and profit.
Then there is being purely ?bottoms up,? and not gaining the broader context of the industry.? As a young investor that was a fault of mine.? As a result, I fell into a wide variety of ?value traps? where I didn?t see that the company was ?cheap for a reason.?
Buying newsy companies
Often managers think they have to have an investable opinion on companies that are in the news frequently.? I think most of those companies are overanalyzed, and as such, don?t offer a lot of investment potential unless one thinks the news coverage is wrong.? I actually like owning companies that don?t attract a lot of attention.? Management teams do better when they are not distracted by the spotlight.
Relying on the sell-side for analysis
Analysts and portfolio managers need to build up their own industry knowledge to the point where they are able to independently articulate how an industry makes money.? What are the key drivers to watch?? What management teams seem to be building value the best?? This is too important to outsource.
Trusting management too much
I think there is a healthy balance to be had in talking with management.? Once you have a decent understanding of how an industry works, talking with management teams can help reveal who are at the top of the game, and who aren?t.? Who is honest, and who bluffs?? This very long set of articles of mine goes through the details.
You can do a document-driven approach, read the relevant SEC filings and industry periodicals, and not talk with management ever ? you might lose some advantage doing that, but you won?t be tricked by a slick-talking management team.? Trusting management implicitly is the big problem to avoid.? They are paid to speak favorably regarding their own firm.
Summary
This isn?t an exhaustive list.? I?m sure my readers can think of more foibles.? I can think of more, but I have to end somewhere.? My view is that one does best in investing when you can think like a businessman, and exclude many of the distractions that large money managers fall into.