Category: Insurance

I Like My Stocks

I Like My Stocks

It was not a great week for my portfolio, but I still like my stocks. Is global growth slackening? I don’t think so. Are the financials that I own under threat? With the possible exception of Deerfield [DFR], no, not at all. Four quality US insurers, three quality European banks, and DFR. Hey, Deutsche Bank actually profited from the crisis. And Safety Insurance, unlike Commerce Group which missed estimates, beat estimates by a dime after the close. Bright management team there, and it trades at 97% of book, 5.7x 2007 earnings, and 6.8x 2008 earnings. (Did I mention that the reserves look conservative?)


Today’s action makes me think that there is some mindless “sell financials” program out there, and not caring about what is inside the financials. I will be adding to my names that were the worst hit recently, and perhaps, giving a higher weight to some of the insurers that I recently purchased. Assurant at 8.7x 2008 earnings, and Lincoln National at 9.2x 2008 earnings? It doesn’t make sense; these are two high quality companies with excellent growth prospects.

I am a value investor. Scanning my portfolio, I see a median 2008 P/E between 9-10x, and a median P/B in the 1.1x area. My portfolio will find support, even if the market falls further.

Full disclosure: long DFR DB AIZ LNC SAFT

Insurance Earnings So Far 2Q07 ? Part V

Insurance Earnings So Far 2Q07 ? Part V

We’re not even midway through earnings season for insurance, and I have a dirty secret to share: Insurance stocks are down on the year on average. 🙁 What a scandal, particularly for an industry with little ties to the sectors in the market with the most credit stress.

Here’s the most recent file on insurance stock performance at earnings. Here are the main lessons, so far:

  • Beating earnings by 10% leads to beating the price performance of the index by about 1%.
  • Brokers and Commercial Lines are doing the best so far.
  • Positive price performance is associated with growing revenues, and rising guidance.
  • With the credit furor going on, it is no surprise that financial insurers are doing the worst of all of the subgroups.
  • Asset sensitive life insurers are faring badly in the face of good earnings, because with the fall in the equity markets, insurers might have lower asset based fees coming.
Insurance Earnings So Far 2Q07 ? Part IV

Insurance Earnings So Far 2Q07 ? Part IV

Insurance stocks got hit as hard today as on Tuesday.? In general, though, away from financial insurers, earnings have been pretty good.? Here’s the file with the data for this earnings season so far.? I’ve added a chart, showing how much price outperformance generally happens from beating earnings.? General findings so far:

  • Beating earnings by 10% leads to beating the price performance of the index by about 1%.
  • Brokers and Commercial Lines are doing the best so far.
  • Positive price performance is associated with growing revenues, and raising guidance.
  • With the credit furor going on, it is no surprise that financial insurers are doing the worst of all of the subgroups.

Of the companies reporting that I own, both beat estimates.? Hartford is a well-run battleship of a company, very well balanced.? Aspen had fewer UK flood claims than the market feared, but who can tell about 3Q?? With a growing top line, looks promising for the future.

Full disclosure: long AHL HIG

Insurance Earnings So Far 2Q07 ? Part III

Insurance Earnings So Far 2Q07 ? Part III

Insurance stocks were down too much on Tuesday, and were up too much today.? Make up your minds, will you?? Was there any good reason behind the upswing?? Yes, boffo earnings reports, and you can see my synopsis in this file.


Each time I do this, there are improvements to the data and the analysis.? The data is on the tab labeled “data,” and a pivot table on the tab labeled “pivot.”? The pivot table helps to bring out some obvious but useful bits of information.

  • In general, financial insurers, the Bermudans, and personal lines have not done well.
  • Commercial lines, life insurers and brokers have done well.
  • Companies that are growing the top line are being rewarded.? Those that are shrinking the top line are in general not being rewarded, even if it is the right thing to do.
  • It could be a lot worse.? Few insurers face credit problems, outside of financial insurers.? Those few with subprime exposure, no matter how good, have gotten punished.
Insurance Earnings So Far 2Q07 ? Part II

Insurance Earnings So Far 2Q07 ? Part II

What an ugly day for insurance stocks, falling more than the market as a whole, and for no good reason.? No good reason?? Well, I can think of two things: First, insurance gets tossed out with financials, even though aside from the financial insurers, they don’t typically share in the subprime mortgage or systemic risk concerns.? Second, listen to the first seven or so minutes of the Brown and Brown earnings call.? Pricing is falling apart almost everywhere in P&C insurance, with primary commercial weakening the most, and personal lines and reinsurance lagging.

Here’s the earnings summary file.? I added a field for movement in the main insurance index, to help point out movements in stock prices relative to the industry.? What are the trends?

  • Personal lines are doing badly, both bottom and top lines, aside from specialty areas.
  • Commercial lines are still winning, even with premium rates weakening.? When do premiums finally get below technical pricing levels?
  • Mortgage and financial insurers are weak, but how much can they really get whacked when they are so near book value?? (Perhaps down to 80% of book?)
  • Life lines are doing adequately.
  • Expectations have caught up with reality with the Bermudans.? Property looks weak;? maybe? Tony Taylor can seek advice from Michael Price on how to shrink a company profitably and conservatively…? (just kidding? :)? , but good job, PTP.)
Insurance Earnings So Far 2Q07 ? Part I

Insurance Earnings So Far 2Q07 ? Part I

I’ll give this one more quarter to see how well my readers like this, but here are the earnings in insurance so far this quarter.? As you can tell, I am doing it a little different this time, in providing a file, and less qualitative commentary.? It’s the same data that I provided last time, but now you can do your own slicing and dicing.

What affects insurance equity prices when earnings are released?? Three things: guidance changes (most powerful), earnings surprises (powerful), and revenue growth. (When the market can’t decide otherwise, they like to see top line growth.? I think that’s dumb, but give the market what it wants, then it will change what it wants on you…)

Trends so far:

  • Exposure to UK property with the floods is a negative.
  • Personal lines are doing badly, both bottom and top lines, aside from specialty areas.
  • Commercial lines are still winning.? When do premiums finally get below technical pricing levels?
  • I like Brown and Brown.? Wish I owned some.? Hope no one buys it tomorrow. 🙂
  • Mortgage insurers are weak, but how much can they really get whacked when they are so near book value?


Full disclosure: long ALL

Portfolio Notes — July 2007

Portfolio Notes — July 2007

I have three portfolios that I help manage. They are listed over at Stockpickr.com. The big one is insurance stocks, where I serve as the analyst, and have a lot of influence over what is selected, but don’t make the buy and sell decisions. The second is my broad market fund, over which I have full discretion. The last is my bond fund, which doesn’t have an independent existence, but fills the fixed income role for the two balanced mandates that I run, in which the broad market fund serves as the equity component. I’m going to run through each portfolio, and hit the high points of what I think about my holdings. Here we go:
Bond PortfolioI sold our last corporate loan fund in early June. We made a lot of money off these over the past two years as LIBOR rose, and the discounts to NAV turned into premiums. New issuance of corporate loans has been more poorly underwritten. I’m not coming back to the corporate loan funds until I see high single digit discounts to NAV, and signs that credit quality is flattening from its recent decline.

The portfolio is clearly geared toward preservation of purchasing power. We have TIPS and funds that invest in inflation-sensitive bonds [TIP, IMF]. We have foreign bonds [FXC, FXF, FXY, FAX, FCO]. The Yen and Swiss Franc investments are there as systemic risk hedges. The Canadian bonds and the two Aberdeen funds are there for income generation. If energy stays up, Canada might never need to borrow in the future. I also have a short-term bond fund [GFY] trading at a hefty discount, and cash. Finally, I have a speculative deflation in long Treasuries. [TLT]

This is a very eclectic portfolio that has done very well over the last 24 months. This portfolio will underperform if any of the following happen:

  • Inflation falls
  • The dollar strengthens
  • The yield curve steepens amid the Fed loosening
  • Credit spreads tighten

The Broad Market Portfolio

There are four things that give me pause about RealMoney. First, there is a real bias toward sexy stocks, and commonly known stocks. That bias isn’t unusual; it plagues all amateur investors. Two, few players talk about bonds, and how to make money from them, as well as reducing risk. Three, almost everyone trades more than me. Finally, there is a “home turf” bias, where everyone sticks to their niche, whether it is in favor or not.

I try to be adaptive in my methods through careful attention to valuation and industry rotation. Underlying all of it, though, is a focus on cheap valuations. There are seven summary categories here at present, and then everything else. Here are the categories:

  1. Energy — Integrated, Refining, E&P, Services, Synfuels. I am still a bull here.
  2. Light Cyclicals — Cement, Trucking, Chemicals, Shipping, Auto Parts
  3. Odd financials — European banks, an odd mortgage REIT [DFR], and Allstate [ALL].
  4. Latin America — SBS, IBA, GMK. All are plays on the growing buying power in Latin America.
  5. Turnarounds — SPW, SLE, JNY. Give them time; Rome wasn’t burnt in a day.
  6. Technology — NTE, VSH. Stuff that is not easily obsoleted.
  7. Auto Retail — LAD, GPI.

So far this overall strategy has been a winner for the past seven years. No guarantees on the future, though. In the near term, rebalancing trades could include purchases of JNY and sales of DIIB and SPW. Beyond that, I am waiting for a week or so to sell my Lyondell. It is possible that another bid might materialize. Allstate is also on the sell block, though, I might just trim a little. What makesme more willing to sell the whole position is the disclosure of an above average position in subprime loans.

Insurance

There is one easy play going into earnings season, and one moderate play. Beyond that, there is dabbling in the misunderstood.

Easy: buy asset sensitive life insurers, ones with large variable annuity, life and pension businesses. Who? LNC, NFS, SLF, MFC, PNX, PRU, MET, HIG, and PFG. Why? Average fees from domestic equities are up 5% over the first quarter, and the third quarter looks even better for now. Guidance could be raised. Away from that, the dollar fell by 2% on average over the quarter, so those with foreign operations (excluding Japan) should do well also, all other relevant things equal.
Moderate: no significant hurricanes so far. Given that there is some positive correlation between June-July, and the rest of the season, are you willing to hazard some money on a calm storm season? With global warming DESTROYING OUR PLANET!!!! (not, this is cyclical, not secular.) If you are willing to speculate, might I recommend FSL? They manage their business well, though they are new.

Beyond that, I would commend to you both Assurant (a truly great company that will survive the SEC), and Safety Insurance (investors don’t get the risks here, they are small, and management is smart).

Summary

Managing portfolios has its challenges. One has to balance risk and reward on varying investments. Sometimes the market goes against you, and you question your intelligence. But good fundamental managers persevere over time, and produce good returns for their investors. That’s what I aim to do.

Full Disclosure: all of my portfolios are listed here.

Late editorial note: where I wrote FSL above, I meant FSR.? Thanks to Albert for pointing the error out.

Joys and Difficulties of the Day

Joys and Difficulties of the Day

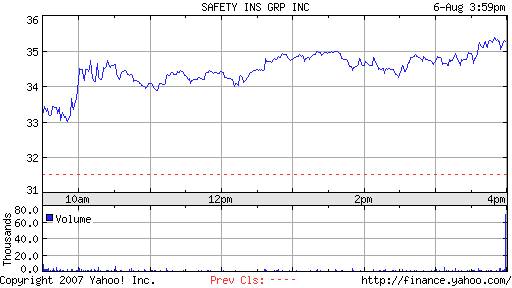
Not such a great day for me. Yes, Lyondell got bought out. Nice. But in my insurance portfolio, Aspen gets tarnished by IPCR’s earnings warning regarding floods in North England and in New South Wales, Australia. Aspen has exposure to the UK, but not necessarily Australia. I find it unlikely that it should have driven down the price 4% though.On another front after falling 8% over two weeks, Safety Insurance fell another 1.3% today over fears that liberalizing Massachusetts auto insurance markets will lead to decreased profitability in the future. A few notes: 1) the proposed liberalizations will not likely make it through the legislature. 2) the liberalizations are not thorough enough to attract meaningful competition to Massachusetts. 3) Safety management is ready for the liberalizations if they should happen. They have proven themselves to be worthy competitors over the years.

Were I able to buy Safety for myself (I can’t because of restrictions), I would do so here. Have a good night.

full disclosure: long LYO SAFT AHL

All’s Wells at Assurant

All’s Wells at Assurant

Assurant, which is still my favorite insurance company and stock, is down 10% as I write. The CEO, CFO, and EVP, Chief Actuary, and VP-Risk Management for Solutions/Specialty Property, have all received Wells notices, and are now on administrative leave.So what are the issues? Prior to its IPO, when it was a part of Fortis, Assurant entered into a treaty that provided a limited amount of reinsurance to Assurant’s property lines. From the 8/16/2005 NT 10-Q:

As disclosed in the Risk Factors section of Assurant, Inc.’s (the “Company”) Annual Report on Form 10-K for the year ended December 31, 2004, one of the Company’s reinsurers thinks the Company should have been accounting for premiums ceded to them as a loan instead of as an expense. Based on the Company’s investigation to date into this matter, the Company has concluded that there was a verbal side agreement with respect to one of the Company’s reinsurers under its catastrophic reinsurance program, which has accounting implications that may impact previously reported financial statements. While management believes that the difference resulting from any alternative accounting treatment would be immaterial to the Company’s financial position or results of operations, regulators may reach a different conclusion. In 2004, 2003 and 2002, premiums ceded to this reinsurer were $2.6 million, $1.5 million and $0.5 million, respectively, and losses ceded were $10 million, $0, and $0, respectively. This contract expired in December of 2004 and was not renewed.

From my reading, when the original reinsurance deal was done, the current CEO was CFO, and the current CFO was head of Solutions. So, all five were involved with the unit in question, so the Wells notices to the CEO and CFO do not necessarily mean that Assurant as a whole is implicated, just the Solutions unit, and not the Solutions unit’s current operations either. If earnings have to be restated, the net result should be near zero, and it would be only for 2002-2004.

It is possible that the finite reinsurance treaty in question may have smoothed earnings during the IPO and the first year, but from my angle, it seems to be going the wrong way. That said, in 2005, the audit committee found the side letter, which is the incriminating bit of data, which turned a reinsurance treaty into an accounting ploy that should have been treated as a loan.

There are only two risks here. Assurant loses five great employees, who get replaced from their exceptionally deep bench. No other insurer in the industry invests as much in their people as Assurant does. They have the people to fill the shoes, if need be. The second possibility is some sort of legal settlement, and in this day and age, who can tell how large that will be? For Ren Re on a more serious lapse on finite Re, the size of the fine was $15 million.

So, I have been buying Assurant today. Hasn’t been this cheap on earnings since 2004. You get a top quartile ROE insurer at a below market multiple.

Full disclosure: long AIZ

Quantitative Analysis is not Trivial — The Case of PB-ROE

Quantitative Analysis is not Trivial — The Case of PB-ROE

I debated on whether to post on this topic or not. I try to be a gentleman, so I don’t want to be too rough on those I criticize. Let me start out by saying that those I criticize have honorable intentions. They want to make investing simple for investors. Noble and laudable; the trouble comes when one over-simplifies, and errors get introduced as a result.

I am both a quantitative and a qualitative analyst, which makes me a little unusual. It also means that I am not as good as the best qualitative or quantitative analysts. To be the best, it takes dedication that would squeeze out spending too much time on the other skill. I have always tried to stay balanced, which helps me as a businessman, actuary and investor. Good problem solving requires looking at a problem from many angles, and then choosing the right analogy/tool to do the job.

One of my readers, Steve Milos, forwarded to me a piece from Merrill Lynch’s life insurance analyst suggesting that Price-to-Book — Return on Equity [PB-ROE] analyses were simply low P/E investing in disguise. I tossed back a comment “The Merrill analyst doesn’t understand what he is talking about. PB-ROE analyses are richer than low PE, though in a few environments, like the present, they are similar.”, prompting Steve to say, “LOL, I love that ? now tell me what you really think!”

I decided to let the matter drop until Zach Maxfield, one of the analysts from Bankstocks.com, posted a laudatory article on Ed Spehar’s piece. I didn’t learn what I am about to write in a day, so let me take you on a journey explaining how I came to learn that PB-ROE analyses are valuable.

Back in 1982, I was a graduate teaching assistant at UC-Davis. The professor that I worked for used regression analysis in financial analysis to try to separate out effects that might be more complex than current modeling would admit. I did not get a chance to use the idea though, until 1992, when I began value investing, after my Mom gave me a copy of Ben Graham’s “The Intelligent Investor.” As I began investing, I noted that some stocks seemed better valued using book, others by earnings, and some by other metrics. Initially I began doing rule-of-thumb tradeoffs like Price to (book plus 5 times earnings). Eventually I wondered whether I had the right tradeoff or not, and how I might work in other metrics like dividends, sales, cash from operations [CFO], and free cash flow [FCF].

I’m not sure when it hit me, but I decided to run a regression of price versus earnings, book, sales, FCF, and CFO. Reasoning that sectors have different economic models, I did separate runs by sector. Truly, I should have done it by industry, or subindustry, as I do it today, but my initial attempts still found promising inexpensive stocks.

It was not until 1998 that I ran into PB-ROE analysis for the first time. Morgan Stanley was marketing a derivative instrument that would reduce book, turn it into earnings, and reduce taxes at the same time. I became the external expert on that derivative instrument, while hating its sliminess. (The whole story is a hoot, but it would take too long, and isn’t relevant here. Suffice it to say that the EITF and the IRS killed it six months after the first transaction got done.)

For those who believed PB-ROE analysis, the derivative was a godsend — less book, more earnings. With my more general model, I said, “So what, give up book, get “earnings,” which come back to book value anyway. These are just accounting shenanigans.” I didn’t see the value of PB-ROE then.

By 2001, I was a corporate bond manager. The Society of Actuaries Investment Section recommended the book, “Investing by the Numbers” by Jarrod Wilcox. An excellent book, I learned a lot from it, and he explained the PB-ROE model to me for the first time. To the best of my knowledge, it is the only place where I have seen it explained.

Where does the PB-ROE model come from? It is a simplification of the dividend discount model. In 2004, I gave a talk to the Southeastern Actuaries Conference. The relevant pages are 5-11, where I go through an example of a PB-ROE analysis, and give the limitations of the analysis. There are several limitations, here they are:


  1. Encourages maximization of ROE in the short run, rather than the long run
  2. Revenue growth is often equated with earnings growth in practice
  3. ?Run rate earnings? is adjusted (operating) GAAP earnings, versus distributable earnings (free cash flow)
  4. Implicit assumption of constant earnings growth, required return, and dividend policy in the Price to Book versus ROE metric
  5. The model assumes that capital is the scarce resource needed to produce more earnings.
  6. ROA is more critical than ROE; it?s harder to achieve. In bull markets, anyone can add leverage.


Items 4 & 5 are the only problems intrinsic to the PB-ROE model; the rest are problems with how the model gets abused by practitioners. I don’t think that any industry fits those conditions perfectly, but I usually think that the are good enough for a first pass, and after that I make adjustments for different expected growth rates, excess capital, earnings quality and more.


PB-ROE is equivalent to low P/E investing when the regression line comes close to going through the origin (0,0). From my experience, that rarely happens. For my nine insurance subgroups (bigger than Mr. Spehar’s analysis — I cover them all), almost all of the intercept terms are different than zero with statistical significance. Or, as a colleague of mine said to me recently, “Thanks for teaching me how to do PB-ROE analysis,it really helped with my analyses on Japanese banks and US investment banks.”


Now, there is a seventh problem with PB-ROE, but it is more complex. So you run he regression and get the tradeoff of P/B versus ROE that the market is currently pricing. Is that the right tradeoff in the intermediate term, or are investors overvaluing or undervaluing ROE? Hard to tell, but when the regression line is flat or downward sloping (it happens every now and then), one has to question whether the market’s judgment is right or not.


In some environments, PB-ROE and low P/E investing will be similar, but that will not always be true. Do not accept a false simplification, even though it may be true at present. The PB-ROE model is richer, and works in more environments, after adjusting for the limitations listed above. PB-ROE is a very useful tool, and not “gobbledygook.”

Theme: Overlay by Kaira