Category: Quantitative Methods

Book Review: Quantitative Value

Book Review: Quantitative Value

3186939

This is a book that gets everything right in broad, but is too insistent on the details.? How should you approach value investing from a purely quantitative standpoint?? Easy:

  • Screen out stocks that have relatively high accruals
  • Avoid companies that may go bankrupt
  • Margin of safety: choose companies with strong balance sheets and profits
  • Look for long-term strength in profits.
  • Buy them cheap.
  • Buy when informed investors are buying.

But here’s the problem.? Like the book What Works on Wall Street, Quantitative Value suffers from over-optimization.? You pass through the data too many times, and you show great returns from the past, should someone have done it that way.? But how much of the result is signal, and how much is an accident?

The broad principles are unavoidably true.? Even the measure of quality, Gross Profits as a fraction of Assets, was new to me, but when I read it, I realized that it was a proxy for having a moat, a sustainable competitive advantage.? I added it to my screening framework.

With all of that said, I have simple advice to the readers.? Follow the broad outlines of what the book teaches, but don’t follow it in detail.? It is good to own companies that are sound, cheap, and improving.

I would also add this: use quantitative screening and scoring as a first step.? I often note that companies that score well in my screens have accounting issues.? So, be wary, and realize that value investing primarily means having a margin of safety. I.e., you won’t lose much if you are wrong.? Purely quantitative value investing can be improved through company and industry knowledge.

Quibbles

Already expressed.

Who would benefit from this book: Amateur value investors will benefit from this book; if the reader does not want to put the effort into learning value investing, this book will be of no use to him.? If you want to, you can buy it here: Quantitative Value, + Web Site: A Practitioner’s Guide to Automating Intelligent Investment and Eliminating Behavioral Errors.

Full disclosure: The publisher sent me a copy of the book for free.

If you enter Amazon through my site, and you buy anything, I get a small commission.? This is my main source of blog revenue.? I prefer this to a ?tip jar? because I want you to get something you want, rather than merely giving me a tip.? Book reviews take time, particularly with the reading, which most book reviewers don?t do in full, and I typically do. (When I don?t, I mention that I scanned the book.? Also, I never use the data that the PR flacks send out.)

Most people buying at Amazon do not enter via a referring website.? Thus Amazon builds an extra 1-3% into the prices to all buyers to compensate for the commissions given to the minority that come through referring sites.? Whether you buy at Amazon directly or enter via my site, your prices don?t change.

Advice for Aspiring Advisor

Advice for Aspiring Advisor

From an email from a reader:

Dear David

My name is YYY, an I am from Ecuador. I am the owner of ZZZ. ZZZ is a business that is focus on wholesaling construction machinery to the whole country. Before my business, I study and graduated from University of St. Thomas in Houston with? a BA in Business administration and Finance. After graduating, I became a an admirer of value investing.

While doing some research of the the book “The Aggressive Contratian Investor” I run into your blog. Currently, I want to invest while I ran my business. I have read The Intelligent Investor, The snowball, The Essays of Warren Buffet, Financial Statement Analysis by Ben Graham and by Warren Buffet, Phil Fisher, Poor Chalie’s Almanack, etc. I just started reading Security Analysis 6th edition. However, with all this knowledge, I still feel that I dont know

“How to valuate a company”

I dont know if I should take MFA course in Austin University, or read a book, what to do whatsoever. Do you have any advice? What do I need to learn or research to be able to valuate business/analyze a security?

Sincerely,

YYY

Dear friend, I have several answers for you.

1) You can learn how to value companies the way I did: start as an amateur, and compare and contrast companies.? Build up knowledge over time.? Pick an industry and get the data from a lot of companies.? I remember when I did Trucking in 1994.? That was fun for my kids to see all the trucks in the annual reports.? I eventually bought one firm, MTL, and it doubled in a year, and got taken private.? What was interesting was that company had a reputation for safety, quality, and doing things right.

2) You can read books by Aswath Damodaran.? His books are overkill, in my opinion, but he gives the right theory, just with too many bells and whistles.? Most good valuation work is simple.? Focus on the big issues.

3) Rather than estimate the value of a company, look at the earnings yield of the company versus alternatives.? Buy companies that offer good returns off of current market prices.

4) Compare the company and it peers on current valuations and past valuations versus earnings, EBITDA, free cash flow, etc.

5) Look at a history of prior M&A activity for public and private companies within that industry.

There are many ways to learn how to value companies, but I would encourage you to learn by doing.? Have at it, and prosper.

On Stock Splits

On Stock Splits

Mark Hulbert had a recent piece in the Wall Street Journal called How to Use Stock Splits to Build a Winning Portfolio.? I find it curious, because 31 years ago I wrote my Master’s Thesis called, “Predicting Stock Splits: An Exercise in Market Efficiency.”? As far as I know, aside from the unbound copy sitting next to me, the only other copy is in some obscure part of the Johns Hopkins Library System.? If a number of people are really curious about this, I could try OCR and see if that would adequately read the typewritten text.

But anyway, I find it amusing that some are still trying to use stock splits to try to make money.? Quoting from Hulbert’s piece:

But try telling that to Neil Macneale, editor of an investment-advisory service called “2 for 1,” whose model portfolio contains only those stocks that have recently split their shares, holding them for 30 months. Over the past decade, according to the Hulbert Financial Digest, that portfolio has produced a 14% annualized return, far outpacing the 8% gain of the Standard & Poor’s 500-stock index, including dividends.

Mr. Macneale’s track record isn’t a fluke. Several studies have found that the average stock undergoing a split outperforms the overall market by a significant margin over the three years following the company’s announcement of that split. Indeed, Mr. Macneale said in an interview, he got the idea for his advisory service in the 1990s from one of the first such studies, conducted by David Ikenberry, now dean of the Leeds School of Business at the University of Colorado, Boulder.

Research on stock splits goes back to the ’30s.? In the ’50s & ’60s before MPT got into full swing, a few researchers began trying analyze why there were abnormal rises in stock prices two months before a stock split.? Could it be that other factors affecting future value were somehow associated with stock splits?? Many factors pointed toward that, notably prior price increases, prior earnings increases, and increases in the dividend associated with the stock split.? Little did they know that they were anticipating momentum investing.

The consensus by the end of the ’70s was that there was no excess return after the stock split announcement, and few ways if any to capture the pre-announcement excess returns.? If in the present stock splits are providing excess returns for 2.5 years afterward, well, this is something new.

One of the leading stock-split theories?supported by the work of professors Alon Kalay of Columbia University and Mathias Kronlund of the University of Illinois, Urbana-Champaign?is that companies implicitly have a target range for where they would like their shares to trade.

If a firm’s shares are trading well above that range, and management believes that this high price is more than temporary, it is likely to initiate a split in order to bring its share price back to within that range.

This isn’t a new theory — it goes back to the ’50s, if not earlier.? One of the oldest theories was that it improved liquidity, but back in a time of fixed tick sizes, where everything traded in eighths, and higher commissions, that made little sense to a number of economists.? Splits made trading costs rise in aggregate for the same amount of dollar volume traded.

In the present though, there are many venues for execution of trades, commissions are much smaller, and negotiable.? Perhaps today more shares at lower prices does add liquidity, and the way to test might compare the bid-ask spread and sizes pre- and post-split.

The professors late last year completed a study of all U.S. stocks that split their shares by a factor of at least 1.25-to-1 between January 1988 and December 2007. They say the evidence their study uncovered suggests that splits are an “indication of sustained strong earnings going forward.” It therefore shouldn’t be a big surprise that split stocks outperform other high-price stocks that don’t undertake a split.

What this might mean is that stocks that split are examples of price and/or earnings momentum.? A management team splits the stock as a signal that corporate profit growth has been good, and will continue to be so.? If not, the management team runs the risk that if the stock price falls, it looks bad to a management to have a low stock price.? There are some investors who won’t buy stocks below $10, $5, etc.? Why run the risk of lowering your stock price if you think the odds are decent that the price will fall from there?? Low stock prices affect the confidence of many.

Investors looking to profit from the stock-split phenomenon should shun stocks that have undergone a reverse split and focus instead on those that have split their shares. You will have to invest in such stocks directly because there is no mutual fund or exchange-traded fund that bases its stock selection on stock splits.

Fortunately, constructing a portfolio of such stocks needn’t be particularly time-consuming.

For example, there is no need to guess in advance which companies are likely to split their shares?which in any case would be difficult, if not impossible, to do. There even appears to be no need to buy a company’s stock immediately after it announces a split, since research shows that it is likely to outperform the overall market for up to three years following that announcement.

Still, Mr. Macneale recommends that investors be choosy when deciding which post-split stocks to purchase. He cites several studies suggesting that the post-split stocks that perform the best tend to be those that, at the time of their splits, are trading at relatively low price/earnings or price/book ratios. Both are commonly used measures of a stock’s valuation, with lower readings indicating greater value.

I’m going to have to find the papers that say that post-split stocks outperform for the next 30 months.? Doesn’t sound right — a result like that would have been found from the research pre-1980, and no one suggested that; in fact, the evidence contradicted that consistently.

Note that the investment manager in question uses cheap valuation to filter opportunities.? That the stock has split usually indicates strong price momentum.? Value plus momentum is usually a winner, so why should we be surprised that stock splits often do well?

But I know of three papers that focused on predicting stock splits — two in 1973, and mine in 1982.? It’s not that hard.? Most of it is price momentum, and with a balanced set of stocks that would and would not split, the models predict 70% of the companies that would split.

What’s better, is that the formulas to predict stock splits pick good stocks in their own right — they end up being value and momentum, and maybe a few other factors.? I remember my thesis adviser being surprised at how good my models were at picking stocks.

This brings me to my conclusion: stock splits are a momentum effect, but it is larger when companies are still have a cheap valuation.? Perhaps splits have no effect on stock performance — it is all momentum and valuation.? To me, that is the most likely conclusion, and my thesis anticipated quantitative money management by 10+ years.

In one sense it is a pity I didn’t do anything with it, but if I hadn’t become an actuary, I would never have gained many other insights into the ways that the market works.? I’m happy with the way things worked out.

The Rules, Part XXXIX

The Rules, Part XXXIX

The trouble with VAR and other mathematical models of risk is that if it becomes the dominant paradigm, and everyone begins to use it, it creates distortions in the market, because institutions gravitate to asset classes that the model makes to appear artificially cheap.? Then after a self-reinforcing cycle that boosts that now favored asset class to an unsupportable level, the cashflows underlying the asset can no longer support it, the market goes into reverse, and the VAR models encourage an undershoot.? The same factors that lead to buying to an unfair level also cause selling to an unfair level.

Benchmarking and risk control through VAR only work when few market participants use them.? When most people use them, it becomes like the portfolio insurance debacle of 1987.? VAR becomes pro-cyclical at that point.

Sometimes I think the Society of Actuaries is really dumb.? The recent financial crisis demonstrated the superior power of long-term actuarial stress-testing versus short-term quant models for analyzing risk.? The actuarial profession has not taken advantage of this.? Now, maybe some investment bank could adopt an actuarial approach to risk, and they will be much safer.? But guess what?? They won’t do it because it will limit risk taking more than other investment banks.? Unless the short-term risk model is replaced industry-wide with a long-term risk model, in the short-run, the company with the short-term risk model will do better.

The reason why VAR does not effectively control risk is simple.? VAR is a short-term measure in most of its implementations.? It is a short-term measure of risk for short- and long-term assets.? Just as long-term assets should be financed with long-term liabilities, so should risk analyses be long-term for long-term assets.

This mirrors financing as well, because bubbles tend to occur when long-term assets are financed by short-term liabilities.? Risk gets ignored when long-term assets are evaluated by short-term price movements.

And, as noted above, these effects are exacerbated when a lot parties use them; a monocultural view of short-run risk will lead to booms and busts, much as portfolio insurance caused the crash in 1987.? If a lot of people trade in such a way as to minimize losses at a given level, that sets up a “tipping point” where the market will fall harder than anyone expects, should the market get near that point.

The idea that one can use a short-term measure of risk to measure long-term assets assumes that markets are infinitely deep, and that there are no games being played.? You have the capacity to dump/acquire the whole position at once with no frictional costs.? Ugh.? Today I set up a new client portfolio, and I was amazed at how much jumpiness there was, even on some mid-cap stocks.? Liquidity is always limited for idiosyncratic investments.

The upshot here is simple: with long term assets like stocks, bonds, housing, the risk analysis must be long term in nature or you will not measure risk properly, and you will exacerbate booms and busts.? It would be good to press for regulations on banks to make sure that all risk analyses are done to the greater length of the assets or the liabilities (and with any derivatives, on the underlying, not contract term).

Goes Down Double-Speed (Updated)

Goes Down Double-Speed (Updated)

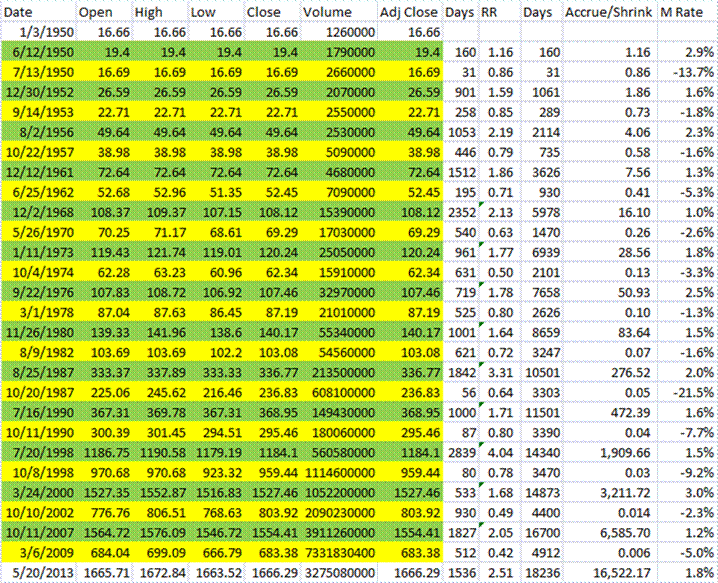
A little more than two years ago, I wrote Goes Down Double-Speed.? I wrote it after the market had doubled from its lows two years earlier.? I want to update the piece and explain we have learned over the past 2+ years, and maybe discuss what could happen over the next 2+ years.? Anyway, here is the modified table of bull and bear markets:

spx_31294_image002

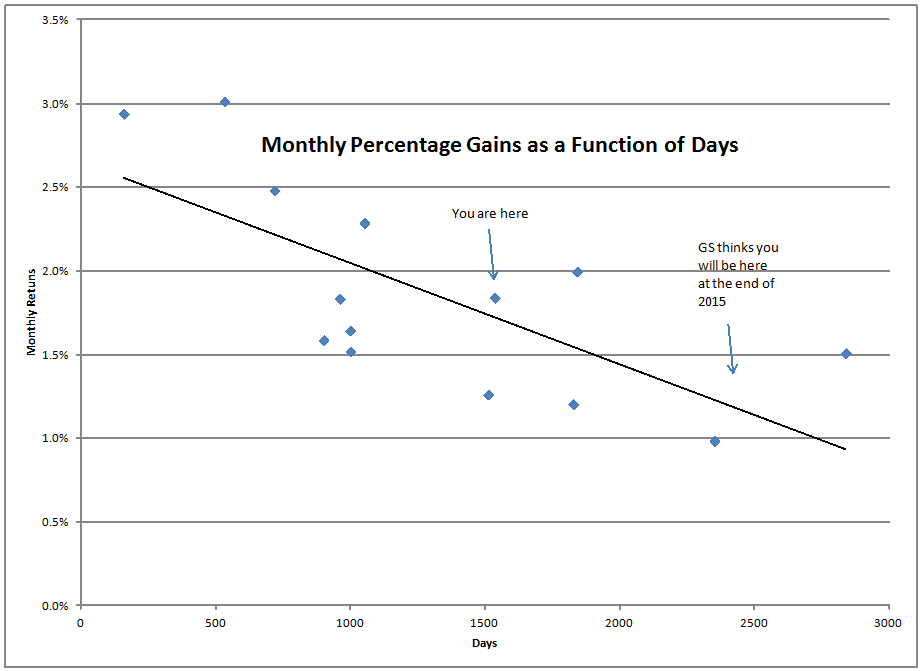
Since the last piece, the gains have come slowly, validating my comment, “But it would be unprecedented for the market to continue to advance at a 3% [per month] pace from here.”? In long recoveries, gains first come quickly, then slowly, then near the end they often come quickly again.? Things are coming quickly again now, but who can tell how long it might persist.

Maybe Goldman Sachs can tell us.? After all they increased their price targets for the S&P 500 yesterday.? Now let me republish my updated bull market graphs from the prior piece:

spx_8180_image001

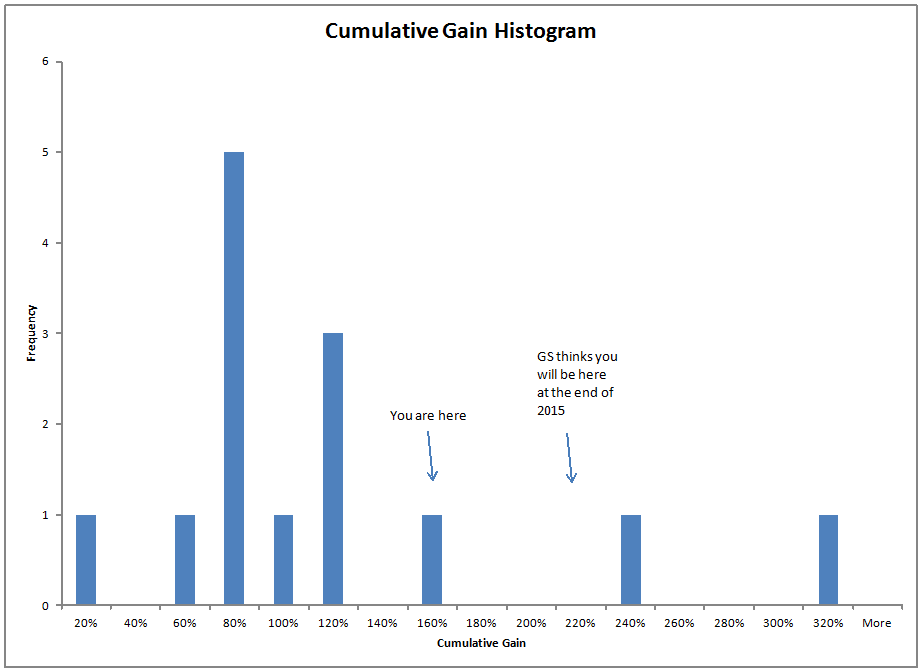
And now look at the cumulative gain:

spx_24509_image001

The predictions of Goldman Sachs are both believable and unbelievable.? Believable: it’s not historically impossible for a rally to last that long, or for it to be so large.? That said the probability historically has been low.

Unbelievable: Unless revenue growth kicks in, that means the profit margin, already at record highs, will soar to an astounding record.? But won’t revenue growth begin again?? That’s hard to say, but if revenue growth starts in earnest, the Fed will start removing policy accommodation, because bank lending will be perking up.? At that point, it is anyone’s guess as to what will happen.? Therefore, I rule out Goldman Sachs’ forecast as a possibility.

The rally continues to get longer in the tooth, and its has been aggressive this year.? I repeat how I ended the original piece: “Consider trimming some of your hottest positions.”

The Rules, Part XXXVII

The Rules, Part XXXVII

The foolish do the best in a strong market

“The trend is your friend, until the bend at the end.”? So the saying goes for those that blindly follow momentum.? The same is true for some amateur investors that run concentrated portfolios, and happen to get it right for a while, until the cycle plays out and they didn’t have a second idea to jump to.

In a strong bull market, if you knew it was a strong bull market, you would want to take as much risk as you can, assuming you can escape the next bear market which is usually faster and more vicious.? (That post deserves updating.)

Here are four examples, two each from stocks and bonds:

  1. In 1998-2000, tech and internet stocks were the only place to be.? Even my cousins invested in them and lost their shirts.? People looked at me as an idiot as I criticized the mania.? Buffett looked like a dope as well because he could not see how the enterprises could generate free cash reliably at any intermediate time span.
  2. In 2003-2007, there were 3 places to be — owning homebuilders, owning depositary financials or shadow banks, and buying residential real estate directly.? This was not, “Buy what you know,” but “Buy what you assume.”
  3. In 1994 many took Mexican credit risk through Cetes, Mexican short-term government debt.? A number of other clever investors thought they had “cracked the code” regarding residential mortgage prepayment, and using their models, invested in some of the most volatile mortgage securities, thinking that they had eliminated all risk, but gained a high yield.? Both trades went badly.? Mexico devalued the peso, and mortgage prepayments did not behave as expected, slowing down far more than anticipated, leading the most levered players to? blow up, and the least levered to suffer considerable losses.
  4. 2008 was not the only year that CDOs [Collateralized Debt Obligations] blew up.? There were earlier shocks around 2002, and the late ’90s.? Those buying them in 2008 and crying foul neglected the lessons of history.? The underlying collateral possessed no significant diversification.? Put a bunch of junk debt in a trust, and guess what?? When the credit cycle turns, most of those bonds will be under stress, and an above average amount will default, because the originators tend to pick the worst bonds with a rating class to maximize the yield, which allows the originator to make more.? Yes, they had a nice yield in a bull market, when every yield hog was scrambling, but in the bear market, alas, no downside protection.

I could go on about:

  • The go-go years of the ’60s or the ’20s
  • The various times the REIT market has crashed
  • The various times that technology stocks have wiped out
  • And more, like railroads in the late 1800s, or the money lost on aviation stocks, if you leave out Southwest, but you get the point, I hope.

People get beguiled by hot sectors in the stock market, and seemingly safe high yields that aren’t truly safe.? But recently, there has been some discussion of a possible “safety bubble.”? The typical idea is that investors are paying up too much for:

  • Dividend-paying stocks
  • Low-volatility stocks
  • Stable sectors as opposed to cyclical sectors.

A “safety bubble” sound like an oxymoron.? It is possible to have one?? Yes.? Is it likely?? No.? Are we in one now?? Gotta do more research; this would be a lot easier if I were back to being an institutional bond manager, and had a better sense of the bond market pulse.? But I’ll try to explain:

After 9/11/2001, institutional bond investors did a purge of many risky sectors of the bond market; there was a sense that the world had changed dramatically.? At my shop, we didn’t think there would be much change, and we had a monster of a life insurer sending us money, so we started the biggest down-in-credit trade that we ever did.? Within six months, yield starved investors were begging for bonds that we had picked up during the crisis.? They had overpaid for safety — they sold when yield spreads were wide, and bought when they were narrow.

But does this sort of thing translate to stocks?? Tenuously, but yes.? Almost any equity strategy can be overplayed, even the largest and most robust strategies like momentum, value, quality, and low volatility.? In August of 2007, we saw the wipeout of hedge funds playing with quantitative momentum and value strategies, particularly those that were levered.

Those with some knowledge of market? history may remember in the ’60s and ’70s, there was an affinity for dividends, with many companies borrowing to pay the dividend, and others neglecting necessary capital expenditure to pay the dividend.? When some of those companies ran out of tricks, they would cut or eliminate the dividend, and the stock would fall.? Now, earnings coverage of dividends and buybacks seems pretty good today, but watch out if one of the companies you own has a particularly high dividend.? You might even want to look at some of their revenue recognition and other accounting policies to see if the earnings are perhaps somewhat liberal.? You also compare the dividend to what the cash flow from operations is, less cash needed for maintenance capital expenditure.

I don’t know whether we are in a “safety bubble” now for stocks.? I do think there is a “yield craze” in bonds, and I think it will end badly when the credit cycle turns.? But with stocks, I would simply say look forward.? Analyze:

  • Margin of safety
  • Valuation, absolute & relative
  • Return on equity
  • Likely and worst case earnings growth

And then balance margin of safety versus where you have the best opportunities for compounding capital.? If relative valuations have tipped favorably to less common areas for stock investing that considers safety, then you might have to consider investing in industries that are not typically on the “safe list.”? Just don’t? compromise margin of safety in the process.

What to Do When Things are Nuts?

What to Do When Things are Nuts?

I have not been a fan of this rally, and I have been selling into it.? I do have a rule for equity clients — cash never goes above 20%.? I have been close to that recently, and after rebalancing some companies that have hit the top of the weighting band, I have bought those companies with the lowest weights in the portfolio.? I have also added some stable companies in the recent past — Berkshire Hathaway, Ingram Micro, Validus Holdings, AFLAC, and CST Brands.

My next quarterly reshaping comes up next week, and again, I will be looking at neglected industries in the market for areas to purchase.? When the momentum runs this hard, I have to be content to trail (though I haven’t been trailing).? I have to ask where things will be three or more years from now, rather than ponder the next quarter.? The answer to that is more murky than I would want, because of abnormal economic policy.? It makes us all more skittish, and obscures price signals.

I have suggested in the past that a good solution in the face of uncertainty is to do half of what you would like to do. Doing half breaks the psychological stranglehold of fear and greed, because regardless of what happens, part of your decision was a success.

You could also start to make a “shopping list.”? Start looking for names that you would like to buy 10, 20, 30% lower, and set alerts.? Who knows how rapidly things will move when the correction or bear market comes.

You could keep a close eye on the 200-day moving average for the S&P 500, waiting for the index to cross under that as a sell signal, but if you want to be ahead of the crowd, maybe you want to use the 190-day moving average. 🙂

I tend to use industry selection and other factors, like balance sheet strength and reliability of cash flows as my main risk reduction tools rather than outright reduction of equities owned.? In general, I have been a good picker of stocks over the last 13 years, and I want to continue using that advantage.

With bonds, I am playing it safe with short and intermediate corporates, and taking reasoned chances with emerging markets debt.? Beyond that, I am thinking of buying long Treasuries as a deflation hedge.

The equity market is well above where long-term valuation measures like the Q-ratio, and CAPE10 would value it.? Most of that is due to low interest rates and high levels of QE.? How certain are you that both will persist, and for how long?? Personally, I think both will persist for some time, but not forever.? Profits attract competitors, and low rates discourage savers.

Though we don’t know when change is coming, we have to be ready for change.? Whatever you do for defense, make preparations now to be defensive; this era and valuation levels will not persist.

Aside from that, remember that when a system is so artificially supported, it relies on peace & continued support from governments.? Either could vary.? Peace is not certain, and neither is the current set of economic policies.? Be ready, because there can be all manner of surprises.

Full disclosure: long BRK/B, IM, VR, AFL, CST

Industry Ranks May 2013

Industry Ranks May 2013

Industry Ranks 6_1521_image002

My main industry model is illustrated in the graphic. Green industries are cold. Red industries are hot. If you like to play momentum, look at the red zone, and ask the question, ?Where are trends under-discounted?? Price momentum tends to persist, but look for areas where it might be even better in the near term.

If you are a value player, look at the green zone, and ask where trends are over-discounted. Yes, things are bad, but are they all that bad? Perhaps the is room for mean reversion.

My candidates from both categories are in the column labeled ?Dig through.?

You might notice that this time, I have no industries from the red zone.? That is because the market is so high.? I only want to play in cold industries.? They won’t get so badly hit in a decline, and they might have some positive surprises.

If you use any of this, choose what you use off of your own trading style. If you trade frequently, stay in the red zone. Trading infrequently, play in the green zone ? don?t look for momentum, look for mean reversion.? I generally play in the green zone because I hold stocks for 3 years on average.

Whatever you do, be consistent in your methods regarding momentum/mean-reversion, and only change methods if your current method is working well.

Huh? Why change if things are working well? I?m not saying to change if things are working well. I?m saying don?t change if things are working badly. Price momentum and mean-reversion are cyclical, and we tend to make changes at the worst possible moments, just before the pattern changes. Maximum pain drives changes for most people, which is why average investors don?t make much money.

Maximum pleasure when things are going right leaves investors fat, dumb, and happy ? no one thinks of changing then. This is why a disciplined approach that forces changes on a portfolio is useful, as I do 3-4 times a year. It forces me to be bloodless and sell stocks with less potential for those with more potential over the next 1-5 years.

I like some technology names here, some telecom related, some basic materials names, particularly those that are strongly capitalized.

I?m looking for undervalued industries. I?m not saying that there is always a bull market out there, and I will find it for you. But there are places that are relatively better, and I have done relatively well in finding them.

At present, I am trying to be defensive. I don?t have a lot of faith in the market as a whole, so I am biased toward the green zone, looking for mean-reversion, rather than momentum persisting. The red zone is pretty cyclical at present. I will be very happy hanging out in dull stocks for a while.

That said, some dull companies are fetching some pricey valuations these days, particularly those with above average dividends.? This is an overbought area of the market, and it is just a matter of time before the flight to relative safety reverses.

The Red Zone has a Lot of Financials; be wary of those.? I’m considering paring back my insurers.

What I find fascinating about the red momentum zone now, is that it is loaded with noncyclical companies. That said, it has been recently noted in a few places how cyclicals are trading at a discount to noncyclicals at present.

In the green zone, I picked most of the industries. If the companies are sufficiently well-capitalized, and the valuation is low, it can still be an rewarding place to do due diligence.

That said, it is tough when noncyclical companies are relatively expensive to cyclicals in a weak economy. Choose your poison: high valuations, or growth that may disappoint.

But what would the model suggest?

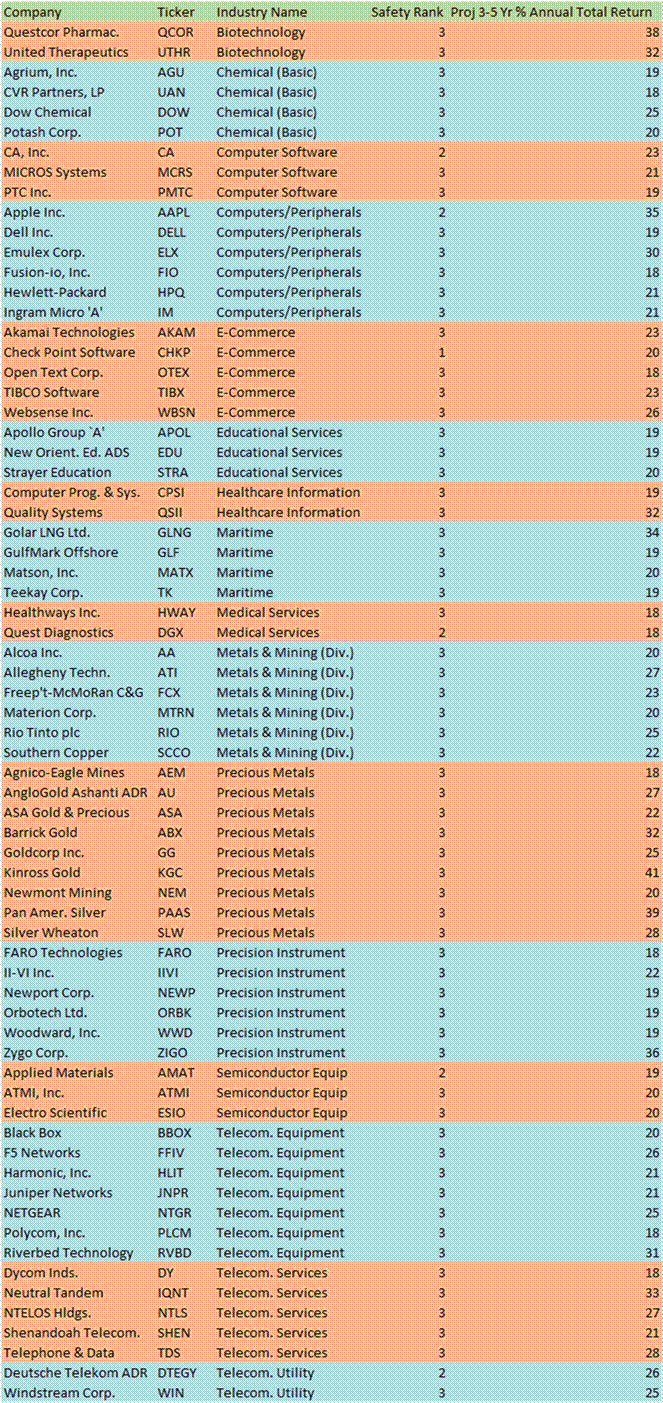
Ah, there I have something for you, and so long as Value Line does not object, I will provide that for you. I looked for companies in the industries listed, but in the top 3 of 5 safety categories, an with returns estimated over 18%/year over the next 3-5 years. The latter category does the value/growth tradeoff automatically. I don?t care if returns come from mean reversion or growth.

But anyway, as a bonus here are the names that are candidates for purchase given this screen. Remember, this is a launching pad for due diligence.

Industry Ranks 6_19997_image002

Full disclosure: Long APOL IM

On the Laffer Curve Regarding Marginal Corporate Tax Rates

On the Laffer Curve Regarding Marginal Corporate Tax Rates

Twitter is serendipitous to me.? I don’t track it all day long, or I would never get anything done.? Usually, I keep it off, unless I am sending off tweets.? But I accidentally saw a tweet from Cardiff Garcia of FT Alphaville. regarding a presentation done by Brad DeLong.? Here it is:

CardiffGarcia Cardiff Garcia 1 May
This slide from @delong‘s presentation made me belly-laugh (via http://bit.ly/ZmqeKq?): pic.twitter.com/beZcJs8Rwk
So I looked, and here is what I found:
BJNC6Y_CYAAB2Of.png large
I looked at it and said, “Huh, yeah, whoever did this was a total hack.? Totally arbitrary curve drawing.”? But then I thought a little more.? “If I estimated a quadratic equation (parabola) what would it look like versus the data?”
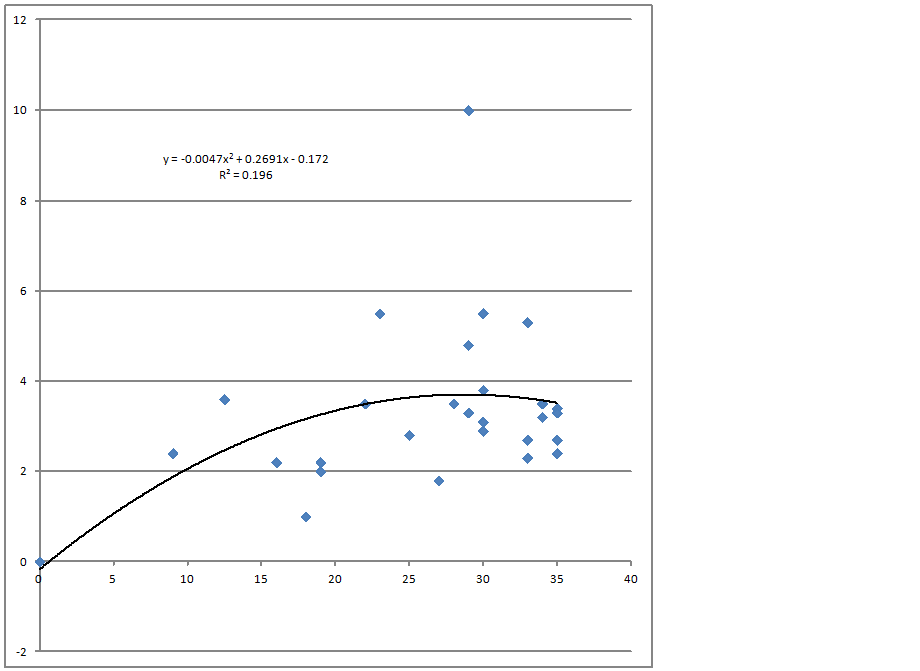
So I took the points and eyeball estimated the values, and dropped them into an Excel spreadsheet, and ran the regression.? Turns out that both DeLong and the Wall Street Journal, and those they relied on were wrong.? Remember that the horizontal axis is marginal corporate tax rate, and the vertical axis is corporate taxes received as a percentage of GDP.
delong comment_30011_image001
At a 5% level of significance, the equation is not significant, and the coefficients are not significant, though they are close.? The signs all go the right way, and the intercept is near zero.? That said, the prob-value for the equation as a whole (F test), is 6.5%, not far from the 5% threshold, so it looks like there is some validity to the idea that as marginal corporate tax rates rise, so do corporate taxes as a percentage of GDP, until the taxes get too high.
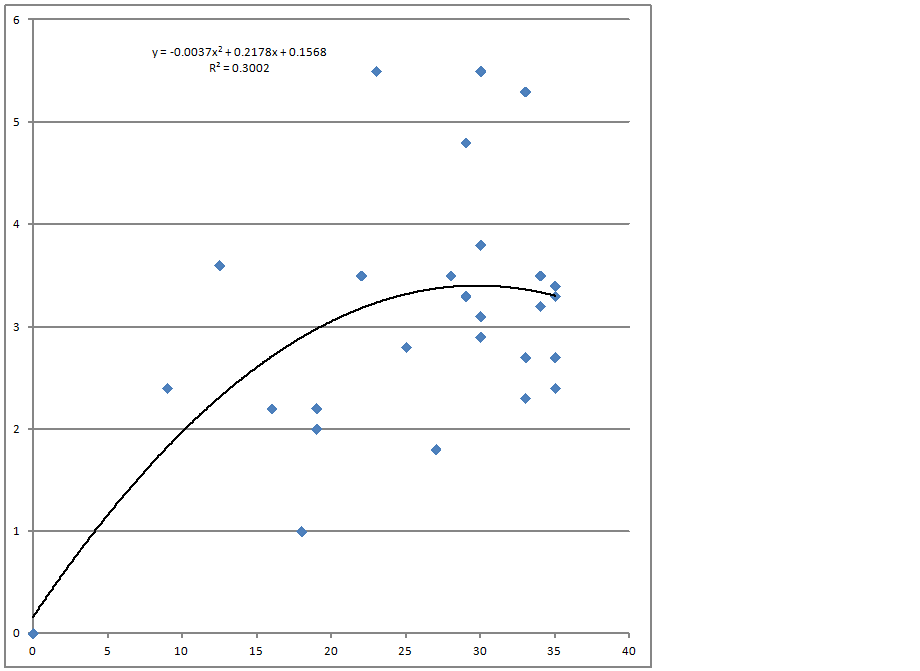
Only one data point of the above analysis, Norway, is statistically significant, with an error 3+ standard deviations versus the model.? Norway is different, with its huge sovereign wealth fund, so what happens to the model if we exclude it, and re-run the model?
delong comment_3027_image001
Under these conditions, at a 5% level of significance, the equation is significant, with a prob-value of 1.4%, and all but one of the coefficients are significant, and the coefficient on the squared term has a prob value of 11.6%.? The signs all go the right way, and the intercept is near zero.? It looks like there is some validity to the idea that as marginal corporate tax rates rise, so do corporate taxes as a percentage of GDP, until the taxes get too high.
I didn’t test anything else.? With both equations we learn two ideas:
  • The tax take tops out at a 30% marginal rate
  • You don’t give up much if you set the marginal rate at 20%

Now, this is a cursory analysis on a limited data set.? But the idea that corporations start to go elsewhere when tax rates get too high is a reasonable hypothesis.? The WSJ analysis was a joke, but so was DeLong’s dismissal of the data.

I’m no great fan of the idea of the Laffer Curve, never have been, but this was the first time I gained some sympathy for the idea.? So, be wary who you listen to, study statistics and their limitations, and generally, be skeptical, but not cynical.? There is truth out there, we just need to find it.

PS — If anyone wants me to publish the detailed statistics, I will, but I omitted them because they make most of my readers’ eyes glaze over.
The Gold Medal Gold Model, Tarnished?

The Gold Medal Gold Model, Tarnished?

From one of my longtime readers:

I just wanted to toss this suggestion your way and the motivation is partly selfish, but given the decline in gold the last 3-4 days (I actually exited all my long positions around 1500-1505 last Friday based on the breach of the technical support level at 1525-1535 and am now short in my trading account from that same level) I’d be interested to get your qualitative thoughts and maybe an update on your refined quantitative model with negative real interest rates and where it says gold should be trading.

If it turns out substantially above the current price of 1360, I’d be curious if you think that model isn’t valid or if gold is a bargain here. ?This article here got my wheels turning that bases on a gold price model on ratio to CPI:

http://www.marketwatch.com/story/golds-fair-value-is-800-an-ounce-2013-04-16?link=MW_story_popular

But to come up with an estimate of gold?s fair value, they calculate a ratio of gold to inflation going back as far as they were able to obtain data. They report that this ratio, when expressed in terms of the U.S. Consumer Price Index, has averaged about 3.2-to-1. Even at $1,400 an ounce, this ratio stands at 6.03-to-1, or nearly double this average.?

From a qualitative standpoint, the negative interest rate model made the most sense to me simply from a critical thinking standpoint. ?The relationship to CPI seems less reasonable to me if one starts with premise that gold is an alternative currency.

Anyways, thanks for any response or addressing this on your blog.

Links: The Gold Medal Gold Model, Gold does Nothing.

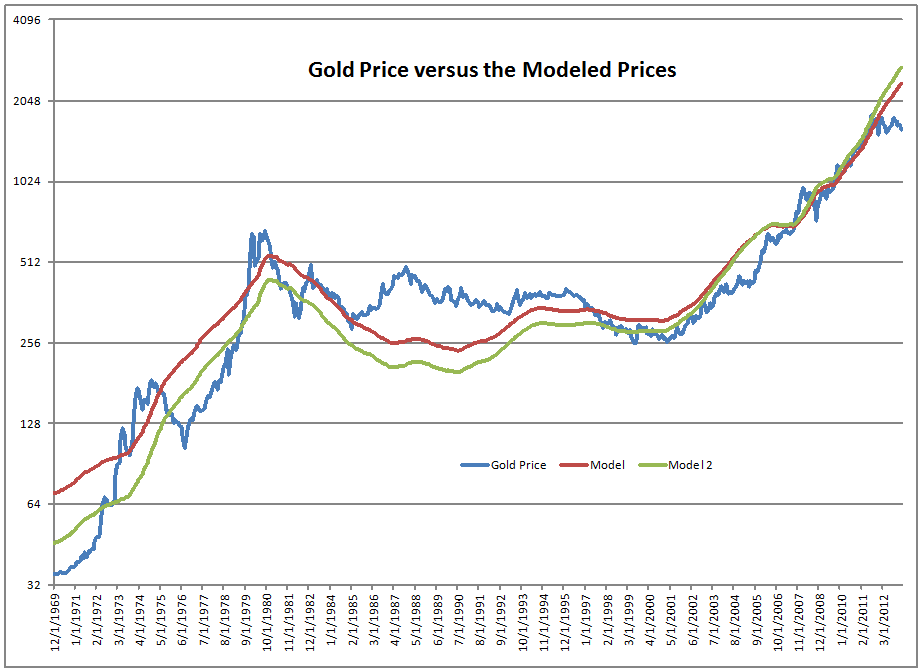
I updated my gold model.? This is what it looks like without re-estimating the parameters:

Eddy's Gold Model_16809_image001

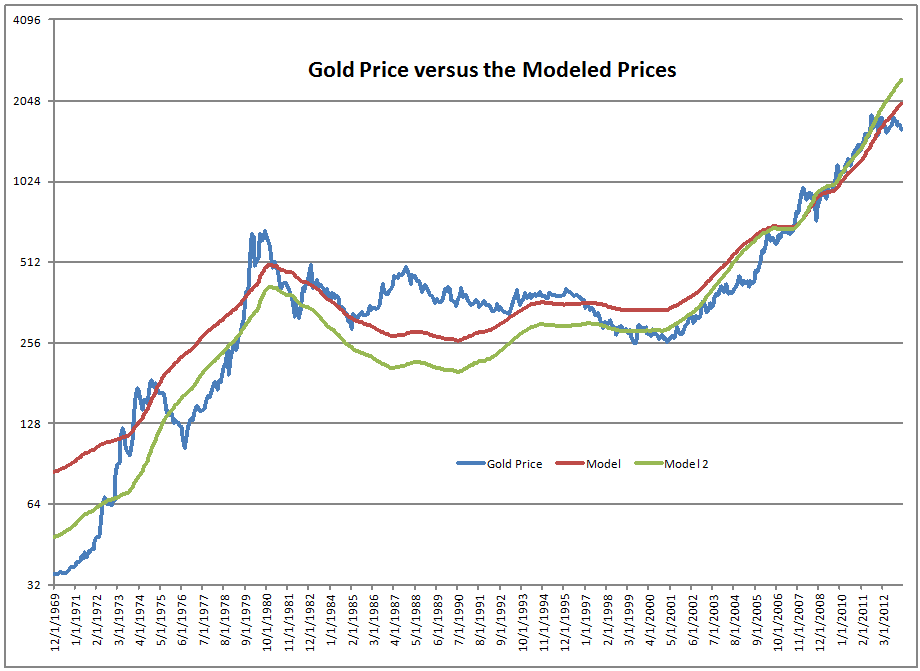
And this is what it looks like after re-estimating the parameters:

Eddy's Gold Model_11787_image001

The real cost of carry in holding gold is negative, and it has been consistently negative for the last five years. and mostly so for the last ten years.? Thus the run-up in the price of gold over the last 10 years.

Now models are just that, models.? I can make three seemingly contradictory statements about this model:

  • The old models did not predict the path of the gold prices well.
  • The re-estimated models fit the data better than the old models.
  • If the model is accurate, there is economic pressure to make the price of gold rise.

My hypothesis at this point in time is that easily tradable products based on gold encouraged speculative pressure, leading the price of gold to overshoot, and now it is correcting.? That said, when the real cost of carry is so negative, gold should appreciate.

Alternatively, we could try to develop a supply-driven model of gold, where we estimate the marginal costs of mining an additional ounce of gold.? Ore depletion is significant, but the effect is relatively constant compared to demand for gold.? It also helps to explain why the stocks of most gold miners have not done well, even with a rising gold price.

We often like to think that if a commodity price is rising, the stock of the producer must do even better.? Not always true, if the prices of extraction/production rise faster than the commodity price, as it has been with gold producers, the stocks will be a bad investment.

My final opinion is this: if you have a 5-year time horizon, I think you will do well with physical gold, where you take delivery, and store it yourself.? With easily tradable paper versions of gold, it is less clear, because you would need to analyze the actual assets.? There might be some credit risk involved.

I don’t think the currency devaluation competition is going away anytime soon, so gold will likely do well against paper.? The real question is when will some major country decide to give up and raise taxes dramatically, inflate, or default.? Aside from the raising taxes scenario, gold should do pretty well.? I might get less optimistic if the gold miners began making significant money,producing much more gold, but producing gold remains a hard business.

Theme: Overlay by Kaira