Category: Quantitative Methods

Book Review: The Ivy Portfolio

Book Review: The Ivy Portfolio

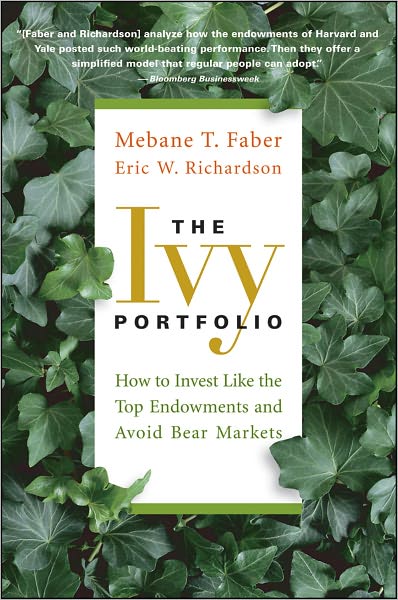
This is an unusual book, and a good book.? Unlike the book, “Outperform,” which reviews lesser known endowments, and endowment investing generally, this book reviews the Harvard and Yale endowments, which up until 2008, the year before the book was published, were among the best in terms of performance.

But this book is more than that.? It goes through the strategies of the major endowments, and looks for ways that average people can try to replicate the results.

But average investors don’t have the same set of investments available to them as the large endowments do.? If you aren’t a qualified investor who has access to the full range of investments ordinary mortals are denied — private limited partnerships (hedge? funds, private equity, commodity funds, etc), what can you do?? This book discloses investments that are similar if not equivalent, and versions that are lower cost through ETFs.

After that, the book takes a direction that would initially seem different than endowment investing.? It discusses trend following, which endowments do not in general use as a strategy.? Now, some hedge funds use it, but few endowments actively embrace it.? The book shows how return can be enhanced and volatility reduced by buying investments that are over their 200-day, or 10-month moving averages.? From my own research I can partially validate the approach.? It is a clever way of implementing a form of momentum investing, which may be a cheap way for average investors to mimic hedge funds who follow trends.

Then mimicry moves to a new level as the book goes through the basics of mining data out of 13F filings, where large investors file their long investments with the SEC.? Guess what?? Imitating bright people can help an investor beat the market — it can allow a bright person to mimic the long side of equity investing on the cheap, but with a lot of data analysis (or you can pay up for Alphaclone).

In one sense, the book seems like two books — one on endowment investing, and another on tools for clever investing available to average investors.? My way of reconciling the two is that the authors are clever guys who are trying to give their best ideas to retail investors so that they can do as well as sophisticated institutional investors who have a wider array of investments to choose from.? The retail investors don’t have the same array of investments to choose from, but they have the advantage of flexibility that institutions don’t and can more quickly trade out of investments that may be on the way to underperformance via trend-following.

And so with much effort, if you apply their ideas, you have the potential of doing as well in investing as the major endowments.? Or, absorb one of their passive strategies with little effort, and maybe you will do as well.? Strategies that have done well in the past may not do so in the future.

But on the whole, I heartily recommend this book.? There is a lot for investors of all types to learn from it.

Quibbles

Those reading the book should also read my essay, “Alternative Investments, Illiquidity, and Endowment Management. (Google it if there is no link)”? Taking on illiquidity is not a free lunch.? It can impose real costs when there is a need for cash among those endowed.? Personally, I think that ten years from now, illiquid investments will only be taken on by those that can lock them away.

Who would benefit from this book:

Those wanting to potentially mimic the high returns of the Harvard and Yale endowments could benefit from the book, but realize that a lot of the past is an accident, and that it might be difficult to achieve high returns in the future from strategies that worked in the past.? That said, the authors have offered strategies that take some degree of work to apply, so there may be barriers to entry for applying some of the strategies.

If you want to, you can buy it here: The Ivy Portfolio: How to Invest Like the Top Endowments and Avoid Bear Markets.

Full disclosure: I asked the publisher for this book, and they sent it to me.? I read and review ~80% of the books sent to me, but I never promise a review, or a? favorable review.

If you enter Amazon through my site, and you buy anything, I get a small commission.? This is my main source of blog revenue.? I prefer this to a ?tip jar? because I want you to get something you want, rather than merely giving me a tip.? Book reviews take time, particularly with the reading, which most book reviewers don?t do in full, and I typically do. (When I don?t, I mention that I scanned the book.? Also, I never use the data that the PR flacks send out.)

Most people buying at Amazon do not enter via a referring website.? Thus Amazon builds an extra 1-3% into the prices to all buyers to compensate for the commissions given to the minority that come through referring sites.? Whether you buy at Amazon directly or enter via my site, your prices don?t change.

Valuation & Momentum — The Impossible Dream

Valuation & Momentum — The Impossible Dream

This piece is a brief and final update to the piece The Holy Grail Projects, which I have since renamed “The Impossible Dream” projects.? I have solved both of them, and with far less effort than I would have anticipated.? There is a way to gain superior bond performance, with one factor, at least as far as the past is concerned, but with higher volatility.

For equities, two simple factors are required, but they beat the market by 2%/year with 70% of the equity volatility over 130 years.

Personally, I find these two results surprising, particularly in the short time that I received them.? That said, I only passed over the data once for each project, which gives me more confidence in the results.

If you have interest in this, e-mail me.? In general, I have not favored tactical asset allocation in the past, but these measures have given me some confidence.

PS — from my days at Provident Mutual in the 90s, what I have replicated is similar? to what one firm I interviewed showed us who had the best track record.? I was really impressed with them and that gives me more confidence.

The Holy Grail Projects

The Holy Grail Projects

When I started my asset management business, I did not know what I was doing.? I probably still don’t, though finally I have a little more assets under management than I have of my own assets managed by my strategies.? I learned that I needed to manage both stocks and bonds, in order to provide both enterprising and safe investments, respectively.

But in an environment like this, where bonds are overvalued in general, is the safe option safe?? My methods of bond management produce rather blah yields at a time like this, because I am trying to preserve capital.

But then potential investors talk to me, and they ask two things of me.

1) Can’t you create a strategy that shifts between your stock and bond strategies, such that we can minimize losses and maximize gains?

2) Can’t you create a bond strategy that provides more yield on average, while still preserving capital?

I am tempted to say, “If I had such a strategy, I would be employing it from my yacht.”? Then again, the last time I went out on he open seas, I was as sick as a dog.? Time for a new analogy.? Okay, I am searching for the Holy Grail.? Not likely to find that… and as Calvin noted, if all of the alleged relics from the days of Christ were real, the amount would be a large multiple of what was there.

All that said, there are some cofactors for each problem that might work.? With bonds (problem 2), there are momentum effects, as well as mean-reversion effects.? Those can complement the intelligent bond manager who looking at the situation may see risk and return out of line, or fairly priced.

I may have a solution to this problem, which partially benefits from the ideas of Mebane Faber.? Buy the bond classes where the prices are above their 200 day moving averages.? This is an oversimplification, but it seems to work.

But stocks are more difficult, and I do not know whether I will end up with a solution here or not.? Here’s the trouble:

  • Stocks are driven by earnings expectations
  • Stocks are driven by valuation
  • Valuation is drive by cost of capital, as well as yield spreads.
  • Cost of capital is on average similar to BBB bond yields.
  • There are still momentum effects, as well as mean reversion effects

I don’t have a solution to the first problem, though I am struggling with it.? Truly if anyone had a good timing algorithm, would he share it?

On the Usefulness of Yield Spreads

On the Usefulness of Yield Spreads

When I was a risk manager and bond manager for a life insurance company (at the same time, dangerous, but great if done right) I had to have models that drove yields on corporates from Treasury yields.? Initially, I found that I had just eight years of yield data from Bloomberg.? That didn’t seem right, so I went to my boss,? who said, “Call our coverage at Bear and Merrill.? Ask to talk to the “Historian.”? Bear and Merrill are likely to have the longest data series.

So I went and called them and they handed me off to a researcher who had been working with bonds a long time.? The response was, “Computers changed everything.? No one thought in terms of spreads until computing power was cheap enough to calculate spreads.? Assuming that we kept the bond trading data, you probably would have seen prices in dollars as late as the mid-1980s.? No yields.? No spreads.? And the truth is we don’t do a good job of preserving the past.”

This explained why my boss had this antiquated bond calculator at his desk.? Every now and then he would use it.? Me?? I would use Bloomberg, or a model that I built myself.

Ugh.? Okay, so no data.? 96 months will have to do it.? As it was, I noticed that the highest quality bonds had the tightest relationships with Treasury yields, but by the time you got down to single-B bonds, the relationship was tenuous at best.? Betas versus Treasury yields declined with credit quality, as did the goodness-of-fit (R-squared).

Another incident seemed unrelated at the time, but today seems very related — one day I asked the high yield manager what sorts of spreads he looked for in buying bonds.? He told me that he did not trade on the basis of spreads — high yield bonds were quoted in dollar terms.? Spreads were just a fallout, though he added that yield was more important to high yield bonds than spread, particularly in a low interest rate environment — he said that there was a risk to high yield bonds that went beyond the spread.? High yield bonds are risky enough that when nominal yields get low enough, it is probably time to start reducing exposure.

Now, we don’t have any significant data series on high yield bonds.? But we do have one on BBB bonds.? Oh, sorry, we have to speak Moody’s here — Baa bonds.? And, we have the same series on Aaa bonds, available at FRED.

The data series go all the way back to 1919 on a monthly basis, and back to 1986 on a daily basis.? The yields are comprised of noncallable bonds 20-30 years in maturity.? Moody’s did the calculations, and we are all the better off for it.

Now, anyone that does work on the Treasury yield curve knows that the US government made life tough when they withdrew the 30-year back in 2001.? As an aside, when the US government did that, there was a huge grab for yield on the long end.? I sold into it, realizing that the Bush Administration would be offering a lot more debt than the omission of the 30 would eliminate.? I bought much of it back 6 months later for gains.

Both the 20-year and 30-year yield series are incomplete.? That said, Treasury yield curve shapes are pretty limited.? If you have four points on the curve, you can estimate the rest with 99%+ R-squareds.? I created pseudo-data for the gaps in the 20- and 30-year yield series.

I needed both series, because the 30-year series went back to the mid-1970s on a daily basis, and the 20-year series went back to 1953 on a monthly basis.

Anyway here is what I learned when I ran my two regressions:

And then the monthly calculations:

I take some heart that the beta coefficients are very similar, and the residuals are as well.? R-squareds are very high as well.? So what does this tell us?

  • There is a credit factor that effects yields, and the effect on Baa bonds is roughly 1.5x that of Aaa bonds.
  • As Treasury yields get lower, Baa bond yields rise at roughly 45% of the rate.? There is the nominal yield need — even Baa bonds tend to need a certain nominal yield, particularly for 20+ year bonds.
  • Present yield levels are fair for long Baa bonds, to the extent that Moody’s measures them accurately.

Unlike beta calculations, this estimate is consistent across monthly and daily observations.? We can have some confidence here.? Thus I would say be near the benchmark in terms of credit exposure.? And remember, spreads are not the most useful way to think about yields.

Problems with Constant Compound Interest (5)

Problems with Constant Compound Interest (5)

This is a continuation of an irregular series which you can find here.? Maybe if I were more scientific, I would have called it “All Exponential Growth Processes Run Into Constraints and Threats,” or if I were more poetic, “Nothing Lasts Forever — Nothing Grows to the Sky.”

Regardless, simple modeling is the bane of long-duration financial calculations.? I remember talking with some friends who served on a charitable board with me, about some investment grade long bonds (11-30 years) that I had purchased for a life insurance client that yielded 7-9% in late 1999.? They said to me that it was foolish to lock up money for so long in bonds, when you could earn so much more in stocks.? My three comments to them were:

  • Prohibitive for life insurers to hold equities
  • At current levels of the market, the yield of these bonds more than compensates for the possibility of capital growth in equities (valuations are stretched)
  • The risk in the bonds is a lot lower.

And, I said we ought to shift shift our charity’s asset allocation to more bonds, as we were invested past the maximum of our guidelines in equities.? They looked in the rearview mirror and said that we were doing fabulous.? Why change success?

I was outvoted; I was a one-man minority.? There are a lot of people who would have loved to make that change in hindsight, but done is done.? I ended up leaving the board a year later over a related issue.

Now, don’t think that I am advising the same in 2011.? We may be headed for significant inflation or deflation; it is difficult to tell which.? Bonds offer little competition to equities here.? Commodities and cash may be better, but I am reluctant to be too dogmatic.? If the economy turns down again, long Treasuries would be best.

Here’s the difficulty: most people have been trained to think at least one of a few things that are wrong:

  • That we can use simple models to forecast future outcomes.
  • That average people are capable of avoiding fear and greed when it comes to investing.
  • That financial markets are random in the sense that last period’s return has no effect on the returns of future periods.
  • Over long periods of time, average investors can beat long Treasuries by more than 2%/year.? (Corollary to the idea that the equity premium is 4-6% versus 0-2%/year over high quality bonds.)
  • That financial markets are expressions of what is going on in the real economy.
  • That the real economy tends toward stability
  • That government actions make the real economy more stable

I’m prompted to write this because of two articles that I ran across in the last day: Retiring Boomers Find 401(k) Plans Fall Short, and Stay Out of the ROOM (registration required).

I’ve written about this before in many places, including Ancient and Modern: The Retirement Tripod.? And yet, when I wrote about these issues 20 years ago, one of the things that I tried to point out was that as the demographic bulge retired, it would be difficult for homes and asset markets to throw off the returns necessary, because there would not be enough buyers for the assets/homes.? If a large portion of the population wants to convert assets into a stream of income — guess what?? They are forced sellers, and yields that they will get will be compressed as a result.

In a situation like that, those that are better off, and can delay turning all of their assets into an earnings stream should be disproportionately better off.? As with corporations, so with individuals/families: those with slack assets and flexibility are able to deal with volatility better than those for whom the environment must be stable/favorable for the plan to succeed.

Now, the Wall Street Journal article points at the problems of 401(k) plans.? What they say is true, but the same is true of other types of defined contribution and defined benefit plans.? When assets underperform, and/or investors make bad choices, guess what?? The pain has to be compensated for somehow:

  • 401(k): They will work longer, maybe all of the rest of their lives, and cut back on expenses and dreams.
  • Non-contributory DC: maybe the employer will ask them to kick in voluntarily, or he might give more.? Also same as 401(k)…
  • Private sector DB plans: employers may contribute more, or they may terminate them.
  • Public sector DB plans: Taxes may rise, spending cuts enacted, forced contributions to retiree plans negotiated, plans terminated for a 457 plan, partial plan termination, job cuts, funny accounting practices (worse than the private sphere), brinksmanship over debts, etc.

Note that one of the answers is not “take more risk.”? First, risk and return are virtually uncorrelated in practice.? Only when enough people realize that might risk and return become positively correlated.? Second, there are times to increase and decrease risk exposure.? Typical people won’t want to do that, because of euphoria (the example of my friends above) and panic.? The time to add to high risk assets is when no one wants to touch a high yield bond.? More broadly, always look for asset classes that throw off the best cash flow yields, conservatively estimated, over the next ten-plus years.? Be sure and factor in the likelihood for economic regime changes and capital loss, inflation, deflation, etc.

Good asset allocation marries the time horizon of an investor to the forecasts for future returns, conservatively stated, and considers what could go wrong.? At present, investment opportunities are average-ish.? I would be wary of stretching for yield here, or raising my risk exposure in equities.? Stick with high quality.

And, for those that are retired, I would be wary of taking too much into income.? I have a simple formula for how much one could take from an endowment at maximum:

  • 10 Year Treasury Yield
  • Plus a credit spread — 2% if spreads are sky-high, 1% if they are good, 0.5% if they are tight.
  • less losses and fees of 0.5% — higher if investment expenses are over 0.25%.

Not very scientific, but I think it is realistic.? At a 3.5% 10-yr T-note yield, that puts me at a 4% maximum withdrawal rate, given a 1% credit spread.? This attempts to marry withdrawals to alternative uses for capital in the market.? You may withdraw more when opportunities are high, and less when they are low.? (But who can be flexible enough to have a maximum spending policy that varies over time?)

Now some of the advanced models that calculate odds of retiring successfully are a step in the right direction, but they also need to reflect demographics, time-correlation of returns, regime-shifting returns/economics, etc.? Things don’t move randomly in markets; that doesn’t mean I know which way things are going, but it does mean I should be cautious unless the market is offering me a fat pitch to hit.

These statements apply to governments as well, and their financial security programs.? In aggregate, investments can’t outgrow growth in GDP by much, unless labor takes a progressively lower share of national income.? (And who knows, but that the pressure on union DB plans to earn high returns might lead to takeovers/layoffs in private firms…)? The real economy and the financial economy are one over the long haul, but can drift apart considerably in the intermediate-term.

In summary, any long promise/analysis/plan made must reflect the realities that I mention here.? We’ve spent years on the illusions generated by assuming high returns off of financial assets.? Now with the first Baby Boomers trying to retire, the reality has arrived — sorry, not everyone in a large birth cohort can retire comfortably.? Wish it could be otherwise, but the economy as a whole can’t generate enough to make that proposition work.

I don’t intend that this series have more parts, but if one strikes me, I will write again.

Goes Down Double-Speed

Goes Down Double-Speed

Eddy Elfenbein wrote an interesting post on the market doubling from its bottom.? But given all of the odd things going on in the markets, and one of my mottoes is “Weird begets weird,” I asked how unusual the fall was? before the rise.? Over the last 61 years, it is unprecedented.? Here’s the table:

Return table

This table lists all of the major turning points as I see them.? The summary statistics are these: bull markets last 3.5x as long as bear markets on average.? Bear markets move at 1.9x the rate of bull markets. (double speed)

But now consider cumulative bear markets as I define them:

Cumulative Loasses

and the monthly losses versus the number of days for the loss.


The longer the losses go on, the less intense the losses are on an annualized basis.? But the loss level is higher per unit time than for gains — the amount of time spent in gains is 3.5x that of the losses.? Look at the cumulative gains:

Though the gains clump around doubling, there are two results in the triple to quadruple area — makes up for a lot of losses.

As one might expect, short rallies tend to be more intense than long rallies.? Normal rallies since 1950 tend to double the index value.? Abnormal falls cuts the index in half.

But for today that leaves us overextended.? Yes, levels have rapidly doubled versus the low.? That’s unusual; it undoes a harder than normal fall.? But it would be unprecedented for the market to continue to advance at a 3% pace from here.? That would be uncharted waters.

Consider trimming some of your hottest positions.

On the Percentage of Market Cap held by Domestic Stock ETFs

On the Percentage of Market Cap held by Domestic Stock ETFs

I don’t have all the resources that I would want in order to do complex analyses.? Give me the database, and the right software, and I can do amazing things.

Even with limited data, and cruddy software, I still have something interesting this evening.? On January 21st, I made measurements of domestic equity ETFs to try to analyze what percentage of domestic equities were held by ETFs.

In order to limit my efforts, I polled the largest 61 domestic stock ETFs, excluding funds that are leveraged or inverse.? (those don’t buy/sell the equities directly, but use derivatives.? Granted, the derivative seller has to hedge, but he very well may cross hedge, messing up the estimates.)? That accounted for 90% of the markets cap of ETFs.? I then took the actual stock holdings of the ETFs and aggregated them, and then compared those holdings to the market capitalizations of the underlying stocks themselves, ending with a percentage of each stock held by the top 90% of ETFs.

I then ran a regression of that variable on several other variables.

SUMMARY OUTPUT
Regression Statistics
Multiple R
0.655372491
R Square
0.429513102
Adjusted R Square
0.428951442
Standard Error
0.013189645
Observations
7,118.000000000
ANOVA
df SS MS F Significance
F
Regression
7.000000000

0.931250612

0.133035802
764.719743739
Residual
7,110.000000000

1.236903529

0.000173967
Total
7,117.000000000

2.168154141
Coefficients Standard
Error
t Stat P-value Lower 95% Upper 95%
Intercept
0.002247578

0.000264739

8.489772940
0.000000000 0.001728610 0.002766546
shr insd
(0.000086814)

0.000017370

(4.997942180)
0.000000593 (0.000120865) (0.000052764)
beta
0.001683951

0.000182311

9.236686447
0.000000000 0.001326567 0.002041335
shr inst
0.000292763

0.000005154

56.804885114
0.000282660 0.000302866
mktcap
(0.000000003)

0.000000018

(0.151538794)
0.879555010 (0.000000039) 0.000000033
3m avg volume
(0.000000002)

0.000000002

(1.282295801)
0.199780706 (0.000000006) 0.000000001
3m realized volatility
0.000076315

0.000005765

13.237614053
0.000000000 0.000065014 0.000087616
Float/Shs
0.000001184

0.000002810

0.421210862
0.673613846 (0.000004325) 0.000006693

In short, I learned that ETF holdings of stocks were:

  • Inversely proportional insider holdings
  • Proportional to the stock’s beta, realized volatility, and amount held by institutions, and
  • Seemingly not related to market cap, trading volume or float.

Even the intercept term has some value as it is near the actual average percentage of market cap held by the top 90% of ETFs, which was 2.15%.? Assuming the same proportion applies to the last 10% that would mean that domestic stock ETFs own 2.39% of domestic stocks.? That’s enough to affect pricing at the margin.

Now, that percentage held by the top 90% of domestic ETFs in any common stock was as high as 17.9%, and as low as zero.? In terms of percentage of market capitalization held by the top 90% of domestic ETFs, we hit zero at stock 2912.

Implications

  • Domestic stock ETFs tend to pick more volatile stocks.
  • Domestic stock ETFs tend to pick stocks held by major institutions.
  • Domestic stock ETFs tend to pick stocks less held by insiders.? (They tend to be more boring.)

My summary is that those who create ETFs, even the big successful ones, tend to follow trends.? By their nature, they are extrapolating from what worked in the past, but in the process of doing so, end up overchoosing some names, and in the process add to their volatility.

That’s all for now, I still don’t feel well.

Eliminating the Rating Agencies

Eliminating the Rating Agencies

Yes, I’m the same guy that wrote the series that culminated with In Defense of the Rating Agencies ? V (summary, and hopefully final).? But I’ve heard enough unintelligent kvetching about the rating agencies, post Dodd-Frank.? You would think that some of them would realize there is something more fundamental going on here, but no, they don’t get the fact that the regulators have outsourced the credit risk function to the rating agencies, and that is the main factor driving the problem.? Okay, so let me give you a simple way to manage credit risk without having rating agencies, even if it is draconian.

Let’s go back to first principles.? As a wise British actuary said, “Risk premiums must be taken as earned, and never capitalized,” even so should regulatory accounting aim itself.

In general, earning Treasury rates is a reliable benchmark for an insurance company.? Match assets and liabilities, and never assume that you can earn more than Treasury yields.

But what if we turned that into a regulation?? Take every fixed income instrument, and chop it in two.? Take the bond, and calculate the price as if it had a Treasury coupon.? Then take the difference between that price and the actual price, and put it up as required capital.

I can hear the screams already.? “Bring back the rating agencies!”? But my proposal would eliminate the rating agencies.? All yields above treasury yields are speculative, and should be reserved against loss.? If the whole industry were forced to do this, the main effect would be to raise the costs of financial services.? It would be a level playing field.? Insurance premiums would rise, and banks would charge for checking accounts.

Such a proposal, if adopted, would simplify life for regulators, reduce risk for most financial companies, and lead to higher costs for consumers.? That’s why it will not be adopted, easy as it would be to use.

Incentives Matter, or, Why I Didn’t Set up as a Hedge Fund

Incentives Matter, or, Why I Didn’t Set up as a Hedge Fund

I didn’t set as a hedge fund for a reason.? First, I changed my mind from prior plans, and wanted to serve people below the top 1% of society, as well as those above, and institutions.? But there is another set of reasons that is more fundamental.

My view is that requiring a manager invest almost all of his spare assets in his strategies is a far more effective means of aligning interests than a performance fee, because it discourages taking undue risk.? It?s the same reason why Wall Street worked a lot better when the firms were all partnerships, and not offering performance incentives to employees.? I?m with Buffett on this one, which is why I set up my firm the way I did ? 80%+ of my liquid assets are in the strategy.? Buffett started with more of a hedge fund structure, and ended up running a corporation where most of his assets were invested.? That provides alignment of interests, while acting to limit the downside, which I think are the goals of most investors.

Beyond that, I think shorting is a difficult way to make money.? Double alpha sounds wonderful in theory, but is really difficult to do in practice.? Common risk control works for long investments — as investments rise, trimming them locks in gains and lowers risks.? As investments fall, their ability to hurt diminishes.? Downside is limited, and upside is unlimited.

With shorting, upside is limited and downside is unlimited.? I can’t tell you how frustrating it is in working for a hedge fund when a large short moves against you.? You might be right in the long run, but can you survive the short run?? As a short goes wrong its impact gets larger, versus when a short goes right, its impact diminishes.

This is why I think alpha-is-the-goal shorting is very difficult to do.? My suspicion is that the average hedge fund that tries it loses, which is why bear funds rarely attract assets, even over a decade as bad as the last one.? Also, hedge fund fee structures encourage undue risk taking.? I did not set up as a hedge fund partly out of my last hedge fund experience, where I saw that risk control is almost impossible to achieve on the short side in a concentrated portfolio.

Part of the problem rests in the concept of the? credit cycle.? The best time to be a short is when the negative phase of the credit cycle arrives.? Aside from that, you are wasting your time being a short.? But who can wait for that time?? The optimal portfolio would be long during the boom phase of the credit cycle, and short during the bust phase.? That is tough to do, but at least it helps to know what the goal should be.? For me as a long only manager, it means taking more risk when credit spreads are tightening, and less when they are falling apart.

I am not out to make a fortune for myself, just enough to support my family.? If more comes beyond that; that’s fine, but I am not aiming for that.? Money for me is not my main goal, rather, I will not be happy at all if my clients do not do well.? I abhor the idea of being a sponge off of the assets of others.? I want to earn my own way for clients.? Lord helping me, I will do that.

UPDATE: One more note.? I say “I eat my own cooking.”? Hedge funds might say (after the truth serum was administered): “We eat lots of our own cooking when we succeed, much less when we don’t.”

Incentives matter.? Do you want asymmetric (but still positive) goals for your managers, or do you want them to genuinely lose money if they fail?? The hedge fund structure offers a free-ish option to the managers — after all, much like mutual funds, they can start a new fund if the first one fails.? Eventually some fund will achieve a performance incentive.

Special Birthdays for Nerds (like me)

Special Birthdays for Nerds (like me)

I called my bank today to try to straighten out something.? In the process, they asked my birthday for verification purposes.? I said, ?Twelve, Five, Sixty.? My birthday is special.? It multiplies.?

After a longish pause, the guy on the other end said, ?Huh, it does multiply.? Cool, I wonder how common that is.?? I replied, ?Good question.? I have known that my birthday multiplied since I was seven, but I never thought of that question until you asked it, and I must say that I don?t know.?

Well, now I do know.? Part of the question here stems from two digit date fields ? mm/dd/yy, in the American system. 12 X 5 = 60.? How common is that?

Over a 400 year period, there are 146,097 days.? (365.25 * 4) – 3 days.? No leap years in 1700, 1800, and 1900, but yes, leap year in 2000.

Month Possible Days
1 31
2 28
3 31
4 24
5 19
6 16
7 14
8 12
9 11
10 9
11 9
12 8

In this situation, over 100 years, there are 212 days where the month and day multiply to be the year.?? That?s 848 over a 400 year period.? February 29th would work in XX58, but that is never a leap year.

Then I said, why limit it to multiplication, why not consider addition, subtraction and division?? With addition, any combination of month and year will produce a year, so over a 100 year period, there should be 365 additive special birthdays.? February 29th would work in XX31, but that is never a leap year.? So, 1460 over 400 years.

Subtraction is more scarce for special birthdays.? The potential number of special birthdays in any month is the month number itself.? All of the special days would pack into the beginning of a century, for us ending at 12/1/2011.? 78 per century, or 312 over 400 years.

Finally there is division, which is the rarest.? The number of days in a given month is equal to the number of factors for a month.? In order that would be 1, 2, 2, 3, 3, 2, 4, 2, 4, 3, 4, 2, 6.? That makes 35 over a century, or 140 over 400 years.

So how many mathematically special birthdays are there in total?? Wait, we have to net out double counting.? Without boring you with the math, double counting happens with multiplication and division when the day is one. 02/01/2002 is special for division and multiplication.? Addition and multiplication match for 02/02/2004.? Over 400 years, there are 52 days of overlap in total.

This brings us to the final table:

Addition Multiplication Subtraction Division Total
Denominator 146,097 146,097 146,097 146,097 146,097
Special days 1,460 848 312 140 2,708
Percentage 1.00% 0.58% 0.21% 0.10% 1.85%
One in 100 172 468 1,044 54

So, by my definition, one in 54 have mathematically special birthdays.? I?m sure there are other ways to view this, and I look forward to comments from those that will broaden my mind, and/or correct my errors.

Theme: Overlay by Kaira