Category: Quantitative Methods

Book Review:Beat the Market: Invest by Knowing What Stocks to Buy and What Stocks to Sell

Book Review:Beat the Market: Invest by Knowing What Stocks to Buy and What Stocks to Sell

I am usually not crazy about books that propound a simple way to beat the market.? This is one of those books.? What makes me willing to write a review about this book, is that the writer, Charles Kirkpatrick is willing to incorporate some fundamental measures into his analyses, notably price-to-sales, which will help with industrial companies, but not with financials.

This is a simple book that reinforces the idea that one needs to pay attention to valuation (in a rudimentary way), and also to momentum.? While I don’t endorse the specific methods of the book, I will say that for someone with a low amount of time, and wanting to do a little better than the market averages, he could do so over the intermediate-term with the methods in the book.

Note: I am not endorsing the technical methods in the book, but most of the methods boil down to momentum, anyway.

If you want, you can find it here: Beat the Market: Invest by Knowing What Stocks to Buy and What Stocks to Sell

PS ? Remember, I don?t have a tip jar, but I do do book reviews.? If you enter Amazon through a link on my site and buy things from them, I get a small commission, and you don?t pay anything extra.? I?m not out to sell things to you, so much as provide a service.? Not all books are good, and not every book is right for everyone, and I try to make that clear, rather than only giving positive book reviews on new books.? I review old books that have dropped of the radar as well, like this one, because they are often more valuable than what you can find on the shelves at your local bookstore.

Book Reviews: The Complete Guide To Option Pricing Formulas, and Derivatives, Models on Models

Book Reviews: The Complete Guide To Option Pricing Formulas, and Derivatives, Models on Models

This is not my ordinary book review.? These are good books that will only appeal to a small fraction of my readers, because few will have need for the knowledge. Both are written by Espen Gaarder Haug, who is kind of a character.? He collects option pricing formulas the way some people collect Barbie Dolls, Beanie Babies, or Baseball Cards.? He has interacted with some of the brightest minds in the field, and collaborated with a few of them.? In both books the math is significant — it would help if your calculus was sharp, and for any value some algebraic knowledge is needed.

Let’s start with the more esoteric of the two books, The Complete Guide To Option Pricing Formulas.? Almost every option formula is included there, together with ways of estimating volatility, certain statistical techniques, aspects of compound interest math, etc.? The book is very comprehensive, and for those that need how to estimate the value of standard and non-standard options, it is a good book to keep on hand as a reference, together with the free CD-ROM containing an Excel add-in that allows you to use the formulas inside Excel.? I have used them for some of the insurance companies I have worked for; the software was easy and reliable.

The second book Derivatives, Models on Models, is different.? He interviews 15 significant thinkers on options and derivatives, and presents 15 papers by them.? Most of them contain tough math; some I couldn’t understand.? The real value of the book was in the interviews, where many of the interviewees showed significant knowledge of the limitations of their models, and how derivatives were misunderstood by the public, or by their users.

There are quirky aspects to this book, including cartoons and photos that are somewhat self-aggrandizing to the author, but make the point in a humorous way.? I liked both books, but only a modest fraction of my readers should have any interest here.

If you want it, you can find them here:

Derivatives Models on Models

The Complete Guide to Option Pricing Formulas

PS ? Remember, I don?t have a tip jar, but I do do book reviews.? If you enter Amazon through a link on my site and buy things from them, I get a small commission, and you don?t pay anything extra.? My objective is to aid my readers, and not explicitly take money from them.

Momentum in the S&P 500

Momentum in the S&P 500

Time for another break from “All crisis, all of the time.”? I have long been fascinated by momentum anomalies, and this is an initial attempt to under stand them better.? My contentions have been that:

  • Sharp moves mean-revert, gradual moves persist.
  • In the short-run momentum persists, in the intermediate-term, it mean-reverts, and in the long-run, oddly, it persists.

Let’s see how well my default views stack up against the evidence.? I used Professor Shiller’s augmented S&P 500 data from 1871 to mid-2008 to ask the following question: given the performance of the last year and the last month, what can that tell us about the likely returns for the next year and next month?

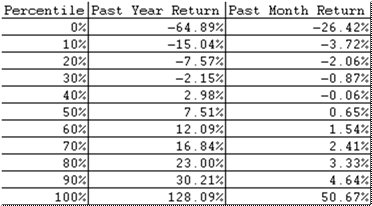
I divided performance into ten deciles for the past year and the past month.? Here are the monthly and annual returns by decile:

For purposes of completeness, I also calculated the number of observations by decile:

Note the correlation.? The main diagonal elements support the idea that monthly and yearly returns are correlated.? Not too surprising.

Returns Over the Next Year

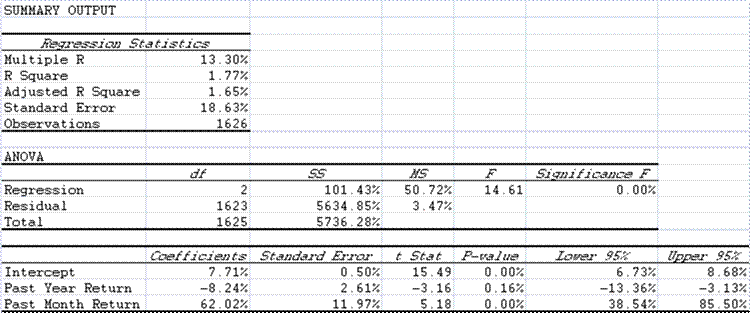
So, how do returns over the next year relate to returns over the last month and year?

Okay, the R-squared is low on this calculation, but the drift from the regression is that there is mean reversion from the past year’s return, and momentum from the monthly returns.? Oddly, some of the worst return occurred when yearly returns were pretty average.

Returns Over the Next Month

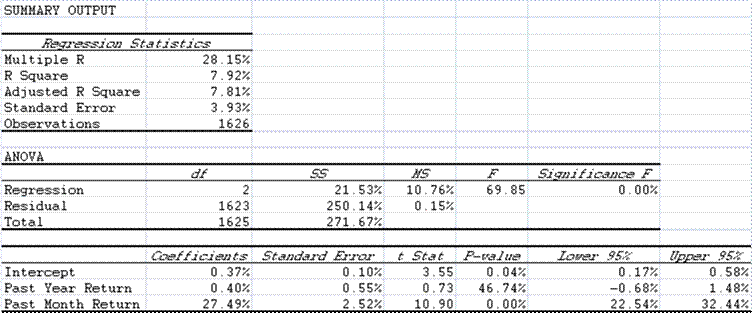
So, how do returns over the next month relate to returns over the last month and year?

The R-squared is a little better here, and the main result is that the past year’s returns do not impact the next month’s returns much, but the past month’s returns do.? There may be some evidence for when monthly momentum is strong, if annual momentum is strongly positive or negative, there will be outperformance.

So, what do I conclude here?

  • Monthly momentum persists over the next month and year.
  • Annual momentum might persist over the next month, and with a lesser tendency might revert over the next year.

One constant I have observed in financial economics: mean-reversion exists, but the tendency is weak.

PS — where are we now?? Lowest deciles for both monthly and annual returns, which indicates bad performance for the next month , but good performance for the next year.? Buckle in, it will be volatile.

Regarding Leveraged ETFs

Regarding Leveraged ETFs

I am a skeptic on leveraged ETFs in one way.? My view is that the more levered they get, the less likely they are to replicate the behavior of their index, however levered.

To get high amounts of leverage, they must rely on futures, options, swaps, and options on swaps, and the higher the amount of leverage they attempt to replicate, the greater the amount of slippage they will experience versus their multiplied index.? There is also slippage from rolling futures from month to month.

Here’s my challenge, and I may do this myself, or, though I encourage others to do it.? Add the performance of the bullish and bearish funds of an index together, for a given amount of leverage.? If there is no friction or fees, they should do as well as T-bills.? My guess is the higher the leverage the lower the aggregate returns.

Let the games begin.? Does anyone want to run this analysis before I do it, say, six months from now?

The Humility of Realism, Redux

The Humility of Realism, Redux

I want to return to this topic to deal with some comments that I received.? Before I start, I want to repeat a comment that I made at Barry’s blog:

Barry, I?m going to toss out a third possible cause for the end of the Great Depression. The first two are FDR?s programs and WWII, both of which I don?t find compelling.

I grew up in this business as a risk manager, and a bit of a innovator there. I had experience with nonlinear dynamic modeling which most actuaries and financial analysts, even most quants, don?t get or use. The economy, and most industries are nonlinear dynamic systems, which means there will be cyclical behavior, and that behavior will be more volatile the greater the level of fixed commitments in the system that must be satisfied.

Economies that primarily use equity finance are more stable than those that primarily use debt finance. It becomes easier to have a cascade of failure the greater the overall debt burden is on the system. So, the total debt level has a major impact on the behavior of the economy. In 1929, total debt to GDP was 280%. By 1941, that level was 160% or so, where it stayed (more or less) until 1985.

After that, debt to GDP moved up parabolically to 360% by 2007, and now we find ourselves in the soup in two ways: 1) total level of debt, 2) complexity of debt because of securitization and to a lesser extent, derivatives.

Why did the depression end around 1941? Reason 3 (my reason): enough debt had been paid down or written off, and loans could be made to good borrowers, but only enough that financial sector would grow slowly (not faster than GDP).

The answer today, in my opinion, is that we need expedited procedures for bankruptcy to reset the system, getting lenders to compromise with borrowers, and bring down the debt to GDP ratio. I don?t think the present programs will work, and they may actually prolong the crisis, a la Japan. In my opinion, we won?t see significant economic growth until the debt to GDP ratio falls into the 150-200% range.

That is my opinion in a nutshell.? Or, as I commented regarding Hank Paulson here:

He could have tried a more modest solution of expediting bankruptcy processes, because the most pressing need for the economy is to turn bad debts into lesser equity stakes, so that the debt overhang can clear.

This probably includes streamlining personal bankruptcy such that lenders receive back loans with smaller principal balances, plus property appreciation rights.

Total debt levels must be reduced below 180% of GDP, and then the Fed must add a new constraint to their policy. Tighten when Debt/GDP rises above 180%, and raise bank capital thresholds in response to the overall indebtedness of the economy.

Better to go back to a gold standard, I say, but if you’re going to have fiat money, at least do it intelligently, so that debt does not get out of control, as it did in the 20s, and 1985-2007.

In essence this would give a third mandate to the Fed.? When total debt to GDP levels get above 180%, tighten, and make bank exams tougher.? Below 120%, flip it (sending a nickel to my pal Cody).

Now, I received a number of responses to my original article.? I’d like to mention a few of them here, and respond.

From Ray Taylor — ?.hmmm ? ?I say Big Bang???so you?re a financial analyst with a wife and eight children and you don?t mind being unemployed for a few years?or, alternatively, bagging groceries at Kroger (if it?s still in business)?you might want to ask the rest of your family for their opinion.

Good point.? I have a decent amount of safe assets laid away, but I am an equity manager, so I am not in a great spot.? I am more than willing to bag groceries, though, or work at other more mundane tasks if things get really bad.? My father taught me the value of hard work.? I am not worried for my family if our nation survives.? I am concerned over whether our nation survives.? Present policies are lowering the odds of survival.

Also, I have many friends in my church that will help me if things get bad.? I helped in the good times; they will help in the bad.

From Michael M. — First, I have a deep suspicion that people who advocate we take our medicine sharply, are generally in positions where the pain will not happen to fall sharply on them, but on other people. I suspect the author is one of these. I am pretty appalled at the indifference such people show to the enormous suffering real depression would bring to huge numbers of people.
Second, I do not know of strong agreement that the Great Depression cured itself; most seem to think the fortuitous enormous spending of World War II finished it off, not an automatic self-regulating process.

Michael, I am 65% exposed to equities relative to my net worth.? Part of that is a promise that I made to my long only investors that I would always have a minimum amount of my net worth exposed to what they are investing in.? I speak what I think is the truth because that is what I am supposed to do ethically, whether it hurts me or not.

Also, I believe my proposals would cause the most people the least pain.? The present proposals of our government point in the direction of FDR and Japan, prolonging the pain.

You are right that there is no consensus saying the Great Depression healed itself.? As I said to Barry above, what I am saying is that the consensus is wrong, and that the Austrian School and those that understand nonlinear systems theory are right.? We can’t establish prosperity by government actions (leaving aside infrastructure); prosperity comes through private actions.

From Mike in NOLa — With respect to protectionism, Michael Pettis has pointed out that China today is much like the US was in the late 1920?s, with huge foreign currency reserves and manufacturing overcapacity. As such, China may be the one to go protectionist, either explicitly, or by monetary manipulation. See his last two posts:

http://mpettis.com/

I read everything Michael Pettis writes.? I agree totally.

From JVDeLong:— David – a question for you. I cannot claim a good grasp of macro, but my intuitive sense is that the key is your comment about the ratio of debt to GDP. Some of these claims must be wiped out by default – but the chief political characteristic of the system is an utter inability to inflict losses. Everyone must be bailed out.

So if we cannot allow piecemeal bankruptcies to clear the system, then what is the alternative except national bankruptcy ? which takes the form of meeting all the claims in nominal terms and then hyper-inflating?

I have stayed with stock market investments on the theory that either the crisis will be brought under control and the stocks will recover, or that the efforts will fail and national bankruptcy will ensue, which means that money-equivalents are not a conservative investment. I do not think the Fed/Treasury will repeat the deflation scenario of the 1930s.

BTW – I heard James Grant speak last week, and he is bearish on money and bullish on high yielding corporate bonds, but I dunno ? that looks like threading a needle.

Your thoughts (and I would be happy to be told that I am crazy)?

With respect to Mr. Grant and high yield, I would agree with him.? I am also bearish on the dollar, and would consider oil, gold, or yen as alternatives at present.

National bankruptcy, or significant inflation, is a possibility that everyone should consider.? I agree with you, the Fed and the Government do not want to repeat the 30s, which is why I think inflation is more likely, unless pressure from international interests makes the US government soak its own populace to pay foreigners.

Kevin Murphy says — David: Would a reverse ETF such as the Proshares Ultrashort treasury funds be a good hedge against inflation or a failure of the Government to finance it?s obligations at current interest rates?

Though I don’t like levered ETFs because they usually underperform their targets, yes, that would be a good strategy.

Ben Says: — Has anyone tried to estimate what the economic situation would have been in the US had we not won the war? I know it sounds stupid, but I?m very dubious about this ?WWII ended the depression theory?. Winning WWII was such a profound positive shock to the US economy that attempts to draw economic analogies and quantify an equivalent amount of peacetime stimulus seem stretched at best.

In terms of the question of how much stimulus we need, there must be many more examples of countries applying economic stimulus to study than the few people are bantering about at the moment. OK, so modern day Japan, Britain in the 70?s and the total experience of the New Deal are not encouraging for Keynesians. Where are the happy endings?

Good points, the Keynesian remedies have not generally worked. Policymakers follow those remedies not because they work, but because they maximize their own power.

VennData Says:– The claim that ?this will give a chance to see who was truly correct about what to do then versus now?? is an exaggeration of the benefit of ex post outcomes of economic cause and effect.

The idea that a ?Bling Standard? is somehow realistic, desirable, is wrong, Even the Swiss have dumped theirs. It makes you vulnerable to whomever buys up ?all the? gold: SWFs, foreign central banks, Private equity, Hedge funds etc? The Fed may have had a hand in too much leverage, but the system self-corrects. The biggest problem after Reagan?s appointment of Greenspan was Bush?s administrative fiat: the 2004 leverage ruling and Congress?s post-Clinton budget busting.

One change we need is addressed correctly above: government policies need to be counter cyclical during boom times – no nation wants to be hamstrung by the pro-cyclical ?Bling Standard? – government systems should be counter-cyclical.

At a minimum, the Fed needs to be allowed into VIP lounge where the punch bowl resides.

VennData, I agree with you that policy needs to be countercyclical under a fiat money or gold standard.? In general, governments are averse to doing so, because it reduces their power.? For that reason, I believe that the government should not be in the money business; it gives them power that they have not managed well, and don’t deserve.

But, you misunderstand my comment that you quoted.? I expect the government to interfere massively, and that the malaise will be prolonged as a result.? Bernanke’s methods, and those of the Treasury, will be ineffective, showing that we really did not learn the right lesson from the Great Depression.? The right lesson would be that in fiat money environment, the central bank must limit the creation of leverage.

Russ Wood Says: JVDeLong wrote — So if we cannot allow piecemeal bankruptcies to clear the system, then what is the alternative except national bankruptcy ? which takes the form of meeting all the claims in nominal terms and then hyper-inflating?

The alternative lies in the denominator of the Debt/GDP ratio. We have to grow GDP as fast as possible. Unfortunately, no one wants to talk about creating incentives for growth. The only discussion is how to cushion everyone from slower growth.

Russ, I sympathize with your views, but growing GDP rapidly is impossible in a credit-based economy when the banks are compromised.? Debt reduction is the main way out, intially.

=–=-==-=-=-=-=-=–==-=-=-

So, my views remain unchanged, and perhaps affirmed.? Depressions, like popped bubbles, are primarily phenomena of finance.? They happen when cash flows from assets are insuffiicient to cover liability cash flows.

Would that our government would wake up and realize that the right policy is the one that feels wrong in the short run.? Aside from that, does anyone care about the implications regarding individual freedom?? Or, that group freedoms are affected as well?
Ten Notes For the Current Crises

Ten Notes For the Current Crises

1) General Growth Properties — another case of too much leverage, illiquid assets, and liquid liabilities.? I live near Columbia and Baltimore, so I know of a lot of property owned by General Growth that was bought when they acquired the Rouse Corp.? I can hear the Rouses in the distance congratulating themselves on a good sale.

For those that haven’t read me much, the deadly trio of too much leverage, illiquid assets, and liquid liabilities is what causes most corporate defaults of financial companies, not lesser issues like mark-to-market accounting.

2) The government thinks it is doing something good, and then it realizes that it is in over its head.? Consider AIG and Fannie Mae.? Where does the bailout end?? The government does not have a team of financial analysts competent to dig into murky balance sheets, and they have the mistaken notion that they must act fast.? Having worked on several takeovers of large financial firms, I can tell you that work done quickly destroys value.? Either there is an underestimate that leads to losing the bid, or an overestimate that leads to overpaying, and an eventual writeoff of part of the investment.

With Fannie Mae and AIG, (and probably Freddie also) the government clearly did not know what it was doing.? What were the main drivers of the loss, and how much worse could they get?? Is this scenario self-reinforcing?? The cursory work led to a bad result that is getting worse.

3) Amazing that we are almost to the end of the first $350 billion of bailout capital.? The government is behaving like a person that just won the lottery, and is profligate with spending, because they’ve never had that much money to throw around with complete discretion until now. As it says in Proverbs 13:11, “Wealth gained by dishonesty will be diminished, but he who gathers by labor will increase. [NKJV]”? Easy come, easy go.? I am not surprised in the slightest that the US Government has mis-estimated the loss exposures.? They don’t have anyone with a concentrated interest (a profit motive) in the result.

4) Here’s another angle in the Fed refusing to disclose what assets they are financing.? If we knew who they were buying from, and what they were buying, the markets would ask the question, “How much more firepower are they willing to expend?”? If the judgment is “little”, market players would sell what the Treasury/Fed was buying, and if the judgment is “a lot”, market players would buy what the Treasury/Fed was buying.

That leads me to believe that the Treasury/Fed doesn’t want to commit a lot more resources to this fight.? If they felt they had a lot more firepower, they would happily disclose their actions, because the private markets would aid their actions.

5) I’ve been talking about it for over a decade, so pardon me if I point at the great pensions disaster.? We have had a lost decade where DB pension money needed to earn 8-9%/yr, and earned around 1%/year.? That gap of 7-8%/yr over 10 years is enough to destroy most well-funded plans at the beginning of the period.? The problem exists for DC plans as well, because as people age, they lose time to compound their money.? Hey, think of this — the dumb guys that put all their money in the stable value fund did much better than those that put their money at risk.? So much for the equity premium in hindsight, but now it’s time to begin committing funds to riskier assets.? (Don’t do it all at once.)

6) At least Mr. Obama can make one market go up — muni bonds.? Wait, that’s not good?!? At least healthy municipalitiestheir borrowing rates improve as higher taxes lead the wealthy to shelter income from taxation.

7) Maybe Obama’s tax poicy could have more bite.? Close down tax havens.? This is something I can get behind.? I like low tax rates, but I don’t like the ability for some to lower their tax rates, and not others.? Let there be a level playing field in the tax code, such that there is no advantage to moving profits offshore.

Now, could Obama enact real tax reform that would be fair, and cause Buffett (and others) to pay taxes on his unrealized capital gains?? He could, but he won’t, because he is a slave of Democratic special interests.

8 ) I understand why the Treasury did it.? They wanted an opaque way of encouraging the purchase of weak banks by stronger banks.? So, they let them absorb tax losses of the acquired bank.? Too bad it is not legal, but legality doesn’t affect our government much these days.

9) Give Spain a hand — they managed to increase capital requirements on their banks during the good times.? Things aren’t perfect now, but Spanish? banks are in decent shape given all of the credit stress.

10) Why is the Fed funds rate so low?? The 75 basis fee point forces the effective Fed funds rate from 1.00% to 0.25%.? Though some see the Fed hemmed in here, I think that as they reduce the Fed funds rate, they will also reduce the 75 bp fee.

Sell Stocks, Buy Corporate Bonds

Sell Stocks, Buy Corporate Bonds

I have lots of models, but I am only one person, so some of my models sit idle becuase I don’t have time to update them.? Well, today, as I was reading Barron’s, I ran across the “Current Yield” column, and read this:

THE STOCK MARKET IS PRICED FOR a recession, but the bond market is priced for a depression. So says Rob Arnott, the brainiac who heads Research Affiliates, an institutional advisory.

That’s not hyperbole. Corporate bonds rated Baa or triple-B, the low end of investment grade by Moody’s and Standard & Poor’s designations, offer the biggest yield premium since the early 1930s, notes RBC Capital Markets.

That’s a problem for pulling the economy out of the credit crisis, but an opportunity for investors. Indeed, investment-grade corporates with near-record premiums arguably offer better return potential than common stocks, especially relative to their risks. “I haven’t seen this many markets offering double-digit opportunities since 1989-90 or ever so briefly in 2002,” says Arnott.

Part of it reflects the sheer weight of numbers. Corporates rated Baa yield about 550 basis points (5.5 percentage points) more than comparable Treasuries, nearly half again the spread in the 2002 post-WorldCom-Enron debacle and twice the average of post-war recessions.

You have to go back to the early 1930s, when Baa corporates yielded 700 basis points over Treasuries, to find a comparable situation. And notwithstanding all the hyperventilation in the media that this is worst financial crisis since the Great Depression, there’s never been such a full-court response to the threat of debt deflation — the $700 billion TARP, the bailout of Fannie Mae and Freddie Mac, the likelihood of trillion-dollar deficits and a doubling in the Federal Reserve’s balance sheet in just over two months.

I know things are bad in the corporate bond market, but I didn’t think it was that bad.? This made me ask, “Hmm… what about my stocks versus bonds model?”? That article is one of my better ones; a lot of time and effort got poured into that.? So, I sat down and re-engineered the model, since, embarrassingly, the original model was lost.

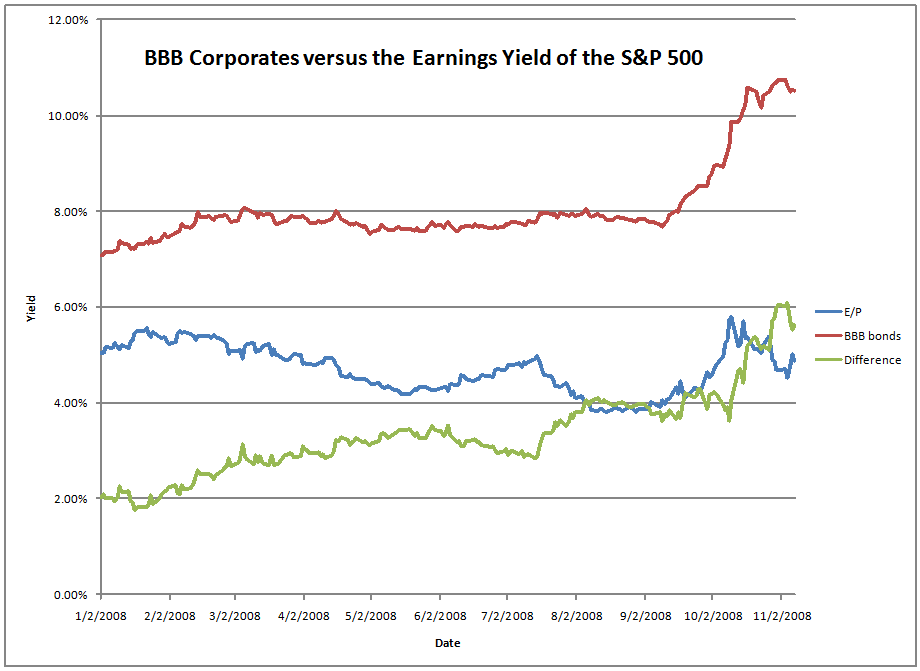
The key question is whether the yield on BBB corporates is more than 3.9% higher than the earnings yield on the S&P 500.? The answer is yes, and that means we should sell stocks and buy corporate bonds.? But, here is the embarrassing thing for me.? The first recent signal to sell stocks and buy bonds came in mid-August, but since I didn’t track the model regularly, I missed that.? Since the original model worked off monthly data, even selling in early September would have preserved a lot of value.? It is not as if corporate bonds have done well since August, but they have done much better than the S&P 500.

Here’s a graph summarizing 2008 via my model:

When the green line goes over 3.9%, it is time to buy corporate bonds. That is not a frequent occurrence; this model gives of signals only a few times per decade. Check out my original piece for more details.

So, with that, I offer my conclusions:

  • It is still time to allocate money to corporate bonds versus equities.? Where I have flexibility with my own money, I am allocating money away from Equity and to BBB investment grade and high yield corporates.
  • Though there are a lot of reasons to worry, corporate yield spreads discount a lot of trouble.
  • The model indicates a fair value of the S&P 500 at around 700.? Uh, I’m not predicting that, but if we hang around at yield levels like this for long, yes, the equity market will adjust to the competition.? More likely is the equity market treads water while corporates rally.
  • A caveat I toss out is that all areas of the credit markets where the government is not meddling are disproportionately hurt, because investors are fleeing toward guaranteed areas.? Thus, corporates are hurting.
  • College endowments and other investors that hate to buy conventional assets should consider corporates now.? It is my bet that a portfolio of low investment grade and junk grade corporates will outperform a 60/40 portfolio of Stocks and T-Notes.
  • If you have the freedom to sell protection on a broad basket of corporates, this might be a good time to do it, when everyone else is scared to death.? Time to insure corporate credit, perhaps.
  • One more caveat before I am done.? The rule has only been tested on data since 1953.? It is not depression-proof.??? I hope to gather the data from that era and validate the formula, but that will be difficult.

So, be careful out there, and remember that corporate bonds typically do better than stocks in a prolonged bear market for credit.? Yield levels like the present typically bode well for corporate bonds versus stocks.

How Stocks Work, Sort of

How Stocks Work, Sort of

I enjoyed the pieces by Felix Salmon and James Surowiecki, and Eddy Elfenbein on how stocks work.? I have reproduced their arguments here, together with my thoughts.

Felix Salmon: What’s the relationship, in theory, between a company’s return on equity, on the one hand, and its stock price, on the other? Does a high return on equity mean a rising stock price, or is it a rising return on equity which means a rising stock price? Or, to put it another way: if one company has an ROE which is (expected to be) flat at 4%, and another company has an ROE which is (expected to be) flat at 14%, would you expect the latter to rise more than the former, or indeed either of them to rise at all?

Jim Surowiecki: Your first question, unfortunately, can’t really be answered in the abstract. It’s perfectly possible for a business with high returns on capital to still be overvalued – that is, for its stock price to overestimate the cash flows it will generate over time. In that case, the fact that a company is generating high returns on capital won’t translate into an increase in its stock price. Microsoft’s average return on invested capital, for instance, is consistently good – above 25% — but its stock is just about where it was a decade ago.

This speaks to your second question, which is really about expectations. If the market is accurately forecasting the returns on capital of the low-ROIC company and the high-ROIC company, you wouldn’t expect the latter’s stock price to dramatically outperform the former. But assuming both are fairly valued, the high-ROIC company will have a much higher valuation, meaning it will generate more income for shareholders going forward (in the form of dividends, buybacks, etc.)

That’s why, all things being equal, you want to own shares of companies that generate high returns on capital rather than those of companies that don’t. This is, in a way, self-evident. If you put money into a company, you want it to use that money to generate high returns, higher than you could get elsewhere. That’s what companies that have high returns on capital do: Microsoft earns an additional twenty-five cents for every dollar it invests. By contrast, companies with low returns on capital create less value, and companies that earn returns that are lower than their cost of capital (as was true of Japanese companies between 1990 and the early part of this century) actually destroy value for their shareholders.

Eddy Elfenbein: A company?s share price is the net present value of all future cash flows. A company?s return-on-equity is a measure of profits for the next year relative to present equity, so the two are connected. However, a high ROE does not translate to a rising share price, but a rising ROE should. Regarding your question, I would assume that the market has discounted both stocks? net present value which incorporates ROE. Therefore, I would only expect the stocks to rise at the pace of the risk-free rate plus the equity risk premium.

This may help: ROE can be broken down into three parts; profit margin, asset turnover and leverage. It goes like this:

Profit margin is earnings divided by sales. Asset turnover is sales divided by assets. Leverage is assets divided by equity.

Earnings……….Sales…………..Assets
—————X—————-X————–
Sales…………….Assets………..Equity

Note that the sales and assets cancel each other out to give you Earnings divided by Equity.

David Merkel: The question can be answered in the abstract, with some noise.? With a few assumptions/limitations as disclosed in this article, Quantitative Analysis is not Trivial ? The Case of PB-ROE.? In most mature industries where capital constrains growth, there is a linear relationship between price-to-book and and ROE.??? This is a result of the dividend discount model, given the assumptions of the article that I cited.

There is the inherent assumption that net worth is the limiting factor in doing new business.? If that is not the case, then the model does not work.? If sales is the limiting factors the equation becomes price-to-sales as a function of profit margins.

FS: What’s the relationship between stock price, ROE, and risk-free rate of return? Would one expect ROEs in a country with a zero risk-free rate to be lower than ROEs in a country with a higher risk-free rate? How does that feed in to stock prices, if at all?

JS: You would expect returns on invested capital to be lower in countries with lower risk-free rates (like Japan). Two reasons suggest themselves for this: first, the low risk-free rate may be indicative of lower growth prospects for the economy as a whole. But also, when the risk-free rate is low, the hurdle rate for corporate investments is also lower (because investors’ expectations of what counts as a reasonable return are also lower.) That may make companies more likely to invest in low-return projects. Both factors have something to do with why Japanese firms have underperformed over the last twenty years (and in particular in that 1990-2002 stretch). But I think the most important factors explaining the low ROIC of Japanese firms were their indifference to shareholder value and their willingness to invest in value-destroying projects.

EE: Again, a company?s share price is the net present value of all future cash flows. ROE is the best measure of the growth of future cash flows. How do we discount that? We discount it by the cost of capital which is risk-free rate plus an equity-risk premium. That?s why a lower risk-free rate tends to boost equity prices.

According to the Gordon Model, it should look something like this:

Price = Earnings/(Risk Free Rate + Equity Risk Premium – ROE)

DM: The risk free rate often has little to do with where corporations can source funds.? Eddy talks about the equity risk premium, but that varies over time.? At present that risk premium is high.? If the country in question is in a liquidity trap, like Japan, equity risk premiums are high.? In general, equity risk premiums are a free market, and disconnected from the “risk free rate” represented by short government bonds

FS: How can a company with a positive ROE destroy economic value for shareholders?

JS: The key to understanding how a company with a positive ROE can nonetheless destroy economic value is simply recognizing that equity is not free. It has a cost, just like debt does, a cost that reflects the return that investors demand as compensation for the risks and opportunity costs that owning equities entail. We can debate how to calculate that cost of equity (risk-free rate + market risk premium is a simple solution). But the basic principle is, as I said above, that a company is only creating economic value for its shareholders if it’s earning more than its cost of capital. Again, this is intuitive: if you were the part owner of a company that, on a risk-adjusted basis, was earning less than the yield you could get on a 30-year T-bill, you probably wouldn’t keep your money in that company, because you would effectively be losing money with every day that passed. Shareholders feel the same way, so the share prices of companies that earn less than their cost of capital are unlikely to rise over time. According to a study by the Japanese government, Japanese companies’ return on capital was below their cost of capital for roughly the entire decade of the 1990s through 2002. If you want to know why Japanese stock prices fell precipitously during that period, that’s the biggest reason why: the companies weren’t creating any value for shareholders. And what made it worse was that, as a result of the bubble, expectations were already inordinately high.

One thing I should say, though: Japanese companies have significantly improved their performance in the past five years, and there’s a strong case to be made that, as in the U.S., the recent sell-off of the Nikkei has been massively overdone. In fact, if you think that the transformation of Japanese firms in recent years will be long-lasting (I’m agnostic on the question), then the Nikkei looks very undervalued right now – or at least it did before it rose something like 15% in the last week and a half.

EE: All companies in all industries are in phantom competition with the cost of equity capital. Even though you can?t see it, you?re struggling against it every day. So even if a company manages to squeak out positive ROE, capital will not flow your way if you keep losing to everybody else.

DM: No disagreement here.? Companies must earn more than their cost of capital in order to add value.? This helps explain why low positive ROEs trade at a discount to book value.

=-=-=–==-=-=-=-=-=-=-=-=-=-

That’s all, and spite of all the discussion here, I own shares of? Honda Motors and the SPDR Russell/Nomura Small Cap Japan ETF,

Full disclosure: long JSC HMC

Conducting Reverse Auctions for the US Treasury

Conducting Reverse Auctions for the US Treasury

I regularly read “A Dash of Insight,” and greatly appreciate the commentary of Dr. Jeff Miller.? What I write here is an effort to encourage what he wrote in this piece advising President-Elect Obama.? (I would have my own advice for the President, but there are so many vying for his ear now, that I sigh and say “Let the poor man get on with it.? He will be imprisoned for the next four years, and likely find less capability of doing what he wants than he imagined.”)

How would one implement what Dr. Jeff suggests?? As a bond manager, I was pretty good at price discovery.? I would convene a committee of large holders of the illiquid instruments and ask them what are the largest classes of homogeneous structured securities that no longer have markets now.? Once they agree on the classes (probably the AAA portions of the senior-sub structured ABS, RMBS and CMBS deals), the agent for the Treasury picks a subset of the largest deals, and announces how much of each security (say 10% of each tranche) they will offer to buy.

Market participants are then invited to submit binding offers to sell any amount of the securities up to the maximum.? The Treasury’s agent could require a minimum amount of bids in order for an auction to be valid (say 2-3x the purchase amount).

One tweak I would put in would be to award the bonds to the winning bidders at the price offered by the bidder with the highest bid not receiving bonds.? I used this successfully for years in bond auctions, and though it makes the trader shake his head initially, when I would say, “I’m offering protection against regret in advance, besides, I want aggressive bids.” they would say, “Okay, I get it.”

After the auctions, there would be benchmark prices, yields, and spreads for a wide number of securities, and then the modelers would apply those prices to the mezzanine and maybe the subordinate tranches, which are too small to hold auctions for.

Similar securities might find trading levels as well, but if not, the Treasury could run another set of auctions, and repeat as necessary.? Given the most of the securities auctioned are AAA, at worst, the Fed might have an interest in the short-to-intermediate AAA paper.

If the Treasury followed a procedure like this, it could unjam the securitized fixed income markets, and do so at prices where the taxpayer bears modest losses at best.? I am not as optimistic as Bill Gross or Warren Buffett on this matter.? The point of the auction is to get the sellers to compete against each other, not compete with the government’s agent.

Now, price discovery is a two-edged sword.? FInding the market clearing price will make the markets start moving again, but it also might prove that some financial institutions are inverted (negative net worth), if not insolvent (can’t get enough cash to pay all immediate claims).? If we are willing to stomach the possible insolvencies that this will reveal, then I am game for Dr. Jeff’s proposal.

And, maybe this will show the need for RTC II, successor to the old Resolution Trust Company.? Bad financial institutions need to be conserved/liquidated, so that leverage can be reduced in the financial system of the US.

So, let something like this be tried, but be ready for adverse consequences if the pricing turns out to be worse than anticipated.

Time to Ditch the Style Box

Time to Ditch the Style Box

If you were trying to create a system for controlling investment risk in equity investing, how would you do it?? What I would do is look at the factors that are the least positively correlated in terms of return generation, and focus on them.

But what do investment managements consultants do?? They divide the world up into managers that look at two factors: large/mid/small capitalization, and value/core/growth.? This has been popularized by the Morningstar “Style Box.”

Looking over the last 15 years, the style box is very correlated with itself.? The lowest correlation is 75%, between largecap value and smallcap growth.? That is not a reason to categorize managers; the difference between the average largecap value and growth manger is teensy. It is even true between largecap value and smallcap growth.? And in more recent years, the correlations have been tightening to nearly 90% at worst.

So, consider country allocations.? Over the last 15 years, the correlations in developed markets have been 45% at worst, with the average being near 70%.? Looking at the last few years, both figures are higher.? My opinion: the advent of naive quantitative investing has pushed all correlations higher.

But now consider correlations across economic sectors.? Over the past 14 years, the correlations have been 32% at worst.? Across industries, which are more diverse than sectors, some of the correlations are negative, perhaps affording true diversification.

My point here is that those that look at capitalization size and value/growth are missing the boat.? If you classify managers based on that, you are focusing on minor concerns that do not aid much in diversification.? Better to focus on the industries that a manager invests in, and/or the countries that those companies are located in — there is a real oportunity to limit risks through either of those two methods.

Now, as for me, when I pick stocks, I start with the industry.? I ignore the factors in the style box.? I look for industries that are near the bottom of their pricing cycle, and buy the highest quality companies there.? For industries that are doing well, but are undervalued, I buy companies with undervalued growth prospects, with good quality balance sheets.

I strongly believe that the investment consultant community has shortchanged its clients by focusing on the “style box.”? Very little of the risks of the market result from factors in the style box, while much resluts from industry selection, which is a richer model.

So, as for me, if I have to be squeezed into the style box, call me midcap value with some style drift, buying companies larger and smaller, and outside the US, as conditions dictate.? I’m looking for the best value over the next three years, and I don’t like non-economic factors distracting me.? Why should that be such a crime, that the ignorant gatekeepers screen me out?

The risk model for the investment consultants is broken.? Let them find one that better reflects the way that the market works.

Theme: Overlay by Kaira