Category: Quantitative Methods

Second Quarter 2008 Portfolio Changes

Second Quarter 2008 Portfolio Changes

For this quarter, I sold two my two placeholder assets, the Industrial and Technology SPDRs, and Arkansas Best, which had richened enough for me to trade out of it.

I had two rebalancing buys, Charlotte Russe and Avnet.? On Charlotte Russe, the rebalancing buy occurred because I tendered all my stock @ $18 in the Dutch Tender, and 45% of it got bought.? On Avnet, things aren’t as bad as the market thought on 4/15, in my opinion.? I had one rebalancing sell, Helmerich and Payne.? Just taking some off the table for risk reduction purposes.

Here is my final comparison file that was based off of data at the close of business on Monday.? To comply with the Bloomberg data license, all numeric fields remaining are ones that I calculated.? The columns of the file rank the 290 stocks on the following metrics (lower better unless noted):

  • 52-week RSI
  • Trailing P/E
  • P/Book (2)
  • P/Sales (2)
  • P/2008E
  • P/2009E
  • Dividend Yield (higher better)
  • Net Operating Accruals (2)
  • Implied Volatility
  • Neglect (higher better)

The grand rank sums up the ranks giving double weights to P/B, P/S, and NOA.? My current stocks are highlighted in yellow, except for the two middle ones, which are in orange.? Candidates for sale come from the lower half (high grand ranks), candidates to buy from the upper half.

Here were my purchases (P/2008E):

  • International Rectifier — 9.5x
  • Group 1 Automotive — 7.1x
  • OfficeMax — 9.3x
  • Universal American Financial — 5.8x

Cheap names all (and could get cheaper?).? If you asked me what my concerns might be over this group of names, I would say that credit quality is adequate but not stellar.? I would also confess a little doubt on Universal American.? It looks cheap, and lines of business they are in are stable lines.? They lost money on mezzanine subprime mortgage ABS.? I looked at the writedowns, and they seem adequate.? If you send the security vintages 2006-2007 to zero, this stock is still cheap, in my opinion.?? What I can’t evaluate is whether they could have operational problems in their senior health insurance business.? It’s a good business, if managed properly.

As for International Rectifier and Group 1, I have owned them before.? With IRF, I like industrial technology — stuff that is harder to obsolete.? On Group 1, I looked at all of the small cap auto retailers, and picked this one.? I liked its business mix, and what seemed to be a clean balance sheet, with few immediate needs for liquidity.? The group as a whole has been smashed, and is discounting very unfavorable conditions.? I don’t think things are that bad, and besides, a lot of the revenues come from repairs and sales of used cars.

With OfficeMax, I think prospects are less cyclical than the market seems to believe.? Office supplies get purchased during bad economic times as well, and the current price already discounts? a lot of pain.

Well, those are my purchases.? Let’s see how they fare over the coming years.

Full disclosure: long HP CHIC AVT GPI UAM OMX IRF

Industry Ranks April 2008

Industry Ranks April 2008

Okay, here are my industry ranks for April 2008. Please remember that my model can be used in value mode (the green zone) or in momentum mode (the red zone). I usually just stick to the green zone, but this time I included a few red zone ideas. So, this time I added in technology companies, insurance, industrial and healthcare companies. Yeah, I know that’s a lot, and my results reflected that — usually I have just 20 or so companies from the screen, but this time it is 80+.

Oh, my screen, aside from industry, has only two factors: market cap greater than $100 million, and Price-to-book times Price-to-forward earnings must be less than 10. Ben Graham had a similar criterion, except that he used trailing P/E, and his cutoff was 22.5. Here are the tickers:

ABG ACGL ACMR ACW ADPI AEL AFFM AGYS AHL AIG AMSF ARM AWH AXS BBW BC BRLC BRNC CBR CHUX CLS CMOS CNA CVGI DK EDS ENH ENSG FFG FL FLEX FMR FRPT GPI HMX HOTT HTRN IKN INDM IPCR IRF KEM KG LAD LNY LTR MENT MIG MRH MRT MWA MXGL NCS NNBR NSIT NSTC NYM OCR ODP PCCC PDFS PKOH PLAB PMACA PNX PRE PSS PTP RE RMIX RNR ROCK RTEC SAF SAH SANM SEAB SMP SNX TECUA THG TRS TRW TRX UAM UNM XL XRIT

Lots of insurers — what can I say, the group is cheap… cheaper than the lack of pricing power should make them. Add in two more tickers that crossed my desk today: MRO and AWI, and I think I am ready to put my spreadsheet together and start analyzing promising cheap companies. One nice thing about my methods is that it can accommodate a large number of tickers. When you add up the tickers from yesterday and today, and add in the 32 existing tickers, that’s almost 300 tickers altogether.

Fortunately, my ranking system helps my winnow down the list pretty quickly, as it scores cheapness on a wide number of variables at once, and throws in many of the anomalies that are mispriced in the markets. Then it is up to me to use business judgment to decide what makes sense, because most cheap stocks are cheap for a reason, while the gems are merely overlooked.

Feel free to pitch in more stock ideas. I should come to decisions within a week or so.

PS — Have you checked out Newsflashr.com yet? It looks like a promising way of aggregating financial news, as well as other news.

Why I Don’t Think the Troubles in Financials are Over Yet

Why I Don’t Think the Troubles in Financials are Over Yet

When I was a investment grade corporate bond manager back in 2002, there were three “false starts” before the recovery began in earnest. The market started rallies in December 2001, August 2002, and October 2002. I remember them vividly, and I behaved like the estimable Doug Kass during that period, buying the dips, and selling the rips.

In this bear market for the financials, we are only through the first leg down. Here is what remains to be reconciled:

  • Residential housing prices are still too high by 10-20% across the US on average.
  • The same is true of much of commercial real estate.
  • The mortgage insurers have not failed yet. Triad Guaranty is close, but at least two of them need to fail.
  • There is still too much implicit leverage within the derivative books of the investment banks.
  • Too many credit hedge funds and mortgage REITs are left standing.

I have tried to avoid being a pest on issues like these, but the overage of leverage has not been squeezed out yet.

Another Dozen Notes on Our Manic-Depressive Credit Markets

Another Dozen Notes on Our Manic-Depressive Credit Markets

This is what I sometimes call a “Great Garbage Post.”? I’ll cover a lot of ground, so bear with me.

1) How to do a bank/financial bailout: a) wipe out common and preferred equity and the subordinated debt (and offer some warrants to the debtholders).? Make the senior debt take a haircut of 50% (and offer warrants), and the bank debt a haircut of 20% (and offer warrants). Capital is offered in exchange for the equity interest, together with some senior financing pari passu with the banks.? If the management and other stakeholders do not like those terms (or something like them), then don’t bail them out.

Now, realize I’m not crazy about “lender of last resort” powers being in the hands of the government, but if we’re going to do that, you may as well do it right, and bail out depositors in full, while having others take modest to large haircuts.? There is no reason why the government/Federal Reserve should bail out common or preferred equityholders, and those that bought risky debt should pay part of the price as well.? This should only be done for institutions where significant contagion effects could affect other financial institutions.? The objective is to create a firewall for depositors, and the rest of the financial system.

2)? Bear Stearns.? Ugh, a bank run.? A testimony to leverage.? Book value is only fair if one can realize the value over time.? High leverage implies a haircut to book value in bad times, because the value of the assets can go down dramatically.? Will they get a buyer?? I don’t know, and I wouldn’t trust JC Flowers.? If what Jamie Dimon might be thinking is what the Bloomberg article states, then I think he has the right idea: keep the best businesses, dissolve the rest.

But remember, during crises, highly levered financial institutions are vulnerable, unless most of their financing is locked in long-term.? Most investment banks don’t fit that description, particularly with all of the synthetic leverage in their derivative books.

3) The downgrades on commercial bank credit ratings will continue to come, particularly for those that were too aggressive in lending to overlevered situations, e.g., home equity lending.? Home equity lending is very profitable in good times, but then it gets overcompetititive, and underwriting standards deteriorate.? Then a lot of money gets lost, as in 1998, where most of the main lenders went under.? In this case, most of the lenders are banks, and they aren’t concentrated in that line alone.

4)? Home builders are taking it on the chin.? Consider this article about joint venture failures of homebuilders.? It is my guess that we will see a few of the major homebuilders fail.? It will take us to 2010 to reconcile all of the excess inventory.? Personally, I would guess that the stable home ownership rate is still below the current level by maybe 2% of the households.? We tried to force homeownership on people that were not ready for it, people who didn’t have enough financial slack to make it through even a slight recession.

5) I find it amusing that Bob Rubin, the only guy in the Clinton Administration that I liked, says that few people anticipated this bubble. (Sounds like Greenspan, huh?)? Well, in a sense he’s right.? Probably fewer than 1% of Americans anticipated these results, but there were enough writers in the blogosphere that were saying that something like this would come (including me), that some could take warning.? As in the tech bubble, there were a number of notable commentators warning, but no one listens during the self-reinforcing cycle of the boom.

6) I am sticking with a 50-75 basis point move from the Fed in the coming week.? They want to move aggressively, but they don’t want to use up all of their conventional ammo, when they are so close to the “zero bound.”? They might disappoint the markets, but not on purpose.? They will tend to follow what the markets suggest.

7) This Fed is more willing to try novel solutions than in the Greenspan era.? Even so, I expect them to run into constraints on their ability to deal with the crisis, which will force the Treasury Department (yes, even in the Bush Administration) to act.

8)? The glory of “core inflation” is not that it excludes the most volatile classes of goods, but the ones for which there is the most excess demand.? Food price inflation is running.? Farmers can’t keep up with the demand.? Poetic justice for the hard-working farmers of our country, who have had more than their share of hard years.? Agriculture is one of the industries that makes America great.? Let the rest of the world benefit from our productivity there.

9)? This is one of those times where one can get a “pit in the stomach” from considering the possibilities from a financial crisis.? As leverage dries up, those with the most leverage on overvalued asset classes get margin calls, leading to forced liquidations.? As it stands now, many credit hedge funds are finding it difficult to maintain their leverage levels, and other hedge funds are finding their lending lines reduced.? This forces a reduction in speculation, and the prices of speculative assets.

10)? Be careful using the ABX indices.? They are too easy to short, and do not represent the values that are likely to be realized in the cash markets.? The same is true of the CMBX indices.? This would lead me to be a bull, selectively, in AAA CMBS, after careful analysis of the underlying collateral.? (CMBS was a specialty of minewhen I was a mortgage bond manager.)

11)? Two interesting articles on character and capitalism.? This is a topic that I havea lot to say about, but every time I sit down to write about it, I am not satisfied with the results.? Let me make a down payment on an article here.? Capitalism is good, but Capitalists often abuse it.? Short-sighted capitalists play for short-term advantage, and end up burning up relationships.? Longer-term capitalists play fair, because they not only want deal one, but deals two, three, four, etc.? They play fair because they will do better in the long run, even if they are intelligent pagans.? (Christians should play fair anyway, because their Father in heaven looks at their deeds.? If we love Him, we will please Him.)

Economics isn’t everything.? Smart businessmen know that a good reputation is golden.? They also know that happy employees are more productive.? Suppliers that get paid on time are more loyal.? These are the benefits of ethical, long-run thinking.

12) In closing, a poke at quantitative analysis done badly.? Consider Paul Wilmott, or William Shadwick.? With bosses over the years, often they would ask me a seemingly simple quantitative question, and I would reply, “Here’s the standard answer: XXXXX.? But there are many reasons why that answer could be wrong, because the math makes too many assumptions about market liquidity, investor rationality, soundness of funding sources, etc.”? Most quants don’t know what they are assuming.? They are too good with the math, and not good enough at the human systems that inadequately lie behind the math.

As a quantitative analyst, I have generally been a skeptic.? At times like this, when the assumptions are breaking down, it gives me a bit of validation to see the shortfall.? That said, it’s no fun to be right when you are losing money, even if it is less than others are losing.

Personal Finance, Part 15 — How I Buy Cars

Personal Finance, Part 15 — How I Buy Cars

When I buy a car, I analyze what car I would like to buy.? I look at reliability, repair costs, overall costs, and style.? I use Consumer Reports to help me analyze this.? Then I go to the website(s) of the manufacturer in question, and copy the data on all of the used models on offer at the dealerships within 30 miles of me.? With price as the dependent variable, I then run a regression with model year as dummy independent variables, and total miles as an independent variable.? After I run my regression, I look at the cars with the biggest price deviations, the predicted price is a lot higher than actual.? I then look at the features of the underpriced cars, and choose one where there are good features with a discounted price.

I go to that dealer, review the car, test drive it, and if it passes my tests, I haggle over the price, and buy it. ? In my experience, this cuts thousands off the price of the car.? What a great reason to have studied econometrics.

One Dozen Notes on Our Crazy Credit Markets

One Dozen Notes on Our Crazy Credit Markets

1) I typically don’t comment on whether we are in a recession or not, because I don’t think that it is relevant. I would rather look at industry performance separate from the performance of the US economy, because the world is more integrated than it used to be. Energy, Basic Materials, and Industrials are hot. Financials are in trouble, excluding life and P&C insurers. Retail and Consumer Discretionary are soft. What is levered to US demand is not doing so well, but what is demanded globally is doing well. Much of the developed world has over-leverage problems. Isn’t that a richer view than trying to analyze whether the US will have two consecutive quarters of negative real GDP growth?

2) So Moody’s is moving Munis to the same scale as corporates? Well, good, but don’t expect yields to change much. The muni market is dominated by buyers that knew that the muni ratings were overly tough, and they priced for it accordingly. The same is true of the structured product markets, where the ratings were too liberal… sophisticated investors knew about the liberality, which is why spreads were wider there than for corporates.

3) Back to the voting machine versus the weighing machine a la Ben Graham. It is much easier to short credit via CDS, than to borrow bonds and sell them. There is a cost, though. The CDS often trade at considerably wider spreads than the cash bonds. It’s not as if the cash bond owners are dumb; they are probably a better reflection of the true expectation of default losses, because they cannot be traded as easily. Once the notional amount of CDS trading versus cash bonds gets up to a certain multiple, the technicals of the CDS trading decouple from the underlying economics of the bond, whether the bond stays current or defaults. In a default, often the need to buy a bond to deliver pushes the price of a defaulted bond above its intrinsic value. Since so many purchased insurance versus the true need for insurance, this is no surprise.. it’s not much different than overcapacity in the insurance industry.

4) If you want a quick summary of the troubles in the residential mortgage market, look no further than the The Lehman Brothers Short Swaption Volatility Index. The panic level for short term options on swaps is above where it was for LTCM, and the credit troubles of 2002. What a take-off in seven months, huh?

LBSOX

5) Found a bunch of neat charts on the mortgage mess over at the WSJ website.

6) I have always disliked the concept of core inflation. Now that food and fuel are the main drivers of inflation, can we quietly bury the concept? As I have pointed out before, it doesn’t do well at predicting the unadjusted CPI. Oh, and here’s a fresh post from Naked Capitalism on the topic of understating inflation. Makes my article at RealMoney on understating inflation look positively tame.

7) The rating agencies play games, but so do the companies that are rated. MBIA doesn’t want to be downgraded by Fitch, so they ask that their rating be withdrawn. Well, tough. Fitch won’t give up that easily. Personally, I like it when the rating agencies fight back.

8 ) Jim Cramer asks if Bank of America will abandon Countrywide, and concludes that they will abandon the bid. Personally, I think it would be wise to abandon the bid, but large companies like Bank of America sometimes don’t move rapidly enough. At this point, it would be cheaper to buy another smaller mortgage company, and then grow it rapidly when the housing market bounces back in 2010.

9) Writing for RealMoney 2004-2006, I wasted a certain amount of space talking about home equity loans, and how they would be another big problem for the banking system. Well, we are there now. No surprise; shouldn’t we have expected second liens to have come under stress, when first liens are so stressed?

10) In crises, hedge funds and mortgage REITs financed by short-term repo financing are unstable. No surprise that we are seeing an uptick in failures.

11) As I have stated before, I am not surprised that there is more talk of abandoning currency pegs to the US dollar. That said, it is a getting dragged kicking and screaming type of phenomenon. Countries get used to pegs, because it makes life easy for policymakers. But when inflation or deflation gets to be odious, eventually they make the move. Much of the world pegged to the US dollar is importing our inflationary monetary policy.

12) Finally, something that leaves me a little sad, people using their 401(k)s to stay current on their mortgages. You can see that they love their homes, as they are giving up an asset that is protected in bankruptcy, to fund an asset that is not protected (in most states). Personally, I would give up the home, and go rent, and save my pension money, but to each his own here.

One Dozen Thoughts on Bonds, Financials and Financial Markets

One Dozen Thoughts on Bonds, Financials and Financial Markets

1) The blog was out of commission most of Saturday and Sunday, for anyone who was wondering what happened. From my hosting provider:

We experienced a service interruption affecting the Netfirms corporate websites and some of our customer hosted websites and e-mail services.

During scheduled power maintenance at our Data Centre on Saturday Feb. 23 at approximately 10:30 AM ET, the building’s backup generator system unexpectedly failed, impacting network connectivity. This affected several Internet and Hosting Providers, including Netfirms.

Ouch. Reliability is down to two nines at best for 2008. What a freak mishap.

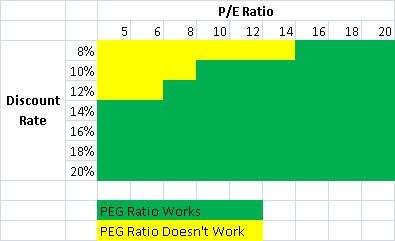
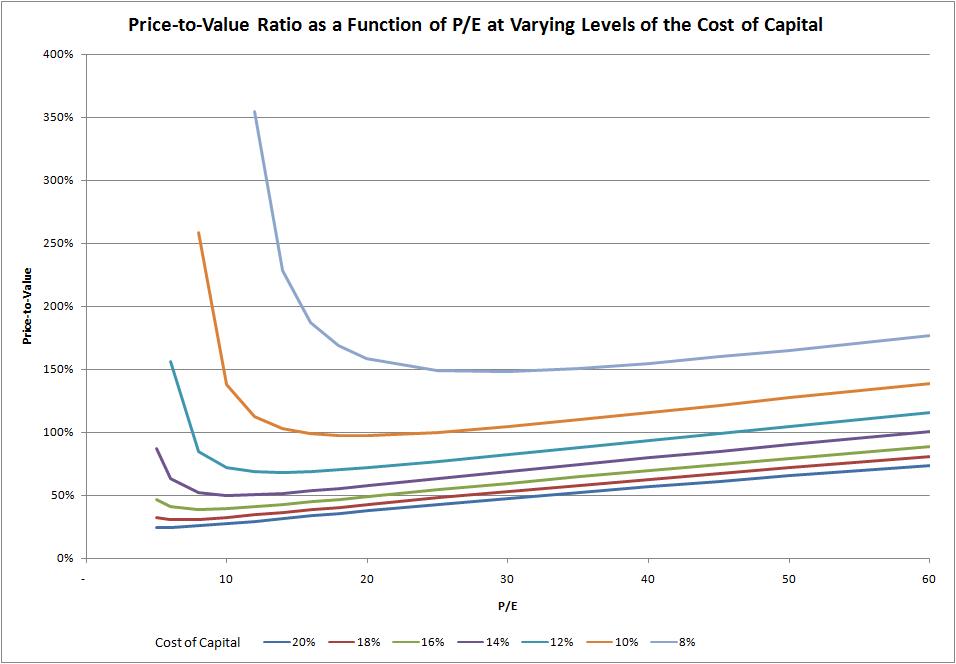
2) Thanks to Bill Rempel for his comments on my PEG ratio piece. I did not have access to backtesting software, but now I do. I didn’t realize how much was available for free out on the web. He comes up with an interesting result, worthy of further investigation. My main result was that PEG ratio hurdles are consistent with a DDM framework within certain moderate values of P/E and discount rates. Thanks also to Josh Stern for his comments.

3) I posted a set of questions on Technical Analysis over at RealMoney, and invited the technicians to comment.


David Merkel
Professionals are Overrated on Fundamental Analysis
2/21/2008 5:19 PM EST

I’m not here to spit at technicians. I have used my own version of technical analysis in bond trading; it can work if done right. But the same thing is true of fundamental investors, including professionals. There are very few professional investors that are capable of delivering above average returns over a long period of time. Part of it is that there are a lot of clever people in the game, and that raises the bar.

But I have known many good amateur investors that do nothing but fundamental analysis, and beat the pros. Why? 1) They can take positions in companies that are too small for the big guys to consider. 2) They can buy and hold. There is no pressure to kick out a position that is temporarily underperforming. With so many quantitative investors managing money to short time horizons, it is a real advantage to be able to invest to longer horizons amid the short-term volatility. 3) They can buy shares in companies that have been trashed, without the “looks that colleagues give you” when you propose a name that is down over 50% in the past year, even though the fundamentals haven’t deteriorated that much. 4) Individual investors avoid the “groupthink” of many professionals. 5) Individual investors can incorporate momentum into their investing without “getting funny looks from colleagues.” (A bow in the direction of technical analysis.)

When I first came to RM 4.4 years ago, I asked a question of the technicians, and, I received no response. I do have two questions for the technicians on the site, not meant to provoke a fundy/technician argument, but just to get opinions on how they view technical analysis. If one of the technicians wants to take me up on this, I’ll post the questions — hey, maybe RM would want to do a 360 on them if we get enough participation. Let me know.

Position: none


David Merkel
The Two Questions on Technical Analysis
2/22/2008 12:15 AM EST

I received some e-mails from readers asking me to post the questions that I mentioned in the CC after the close of business yesterday. Again, I’m not trying to start an argument between fundies and techies. I just want to hear the opinions of the technicians. Anyway, here goes: 1) Is there one overarching theory of technical analysis that all of the popular methods are applications of, or are there many differing forms of technical analysis that compete against each other for validity (and hopefully, profits)? If there is one overarching method, who has expressed it best? (What book do I buy to learn the theory?)

2) In quantitative investing circles, it is well known (and Eddy has written about it recently for us) that momentum works in the short run, and is often one of the most powerful return anomalies in the market. Is being a good technician just another way of trying to decide when to jump onto assets with positive price momentum for short periods of time? Can I equate technical analysis with buying momentum?

To any of you that answer, I thank you. If we get enough answers, maybe the editors will want to do a 360.

Position: none

I kinda thought this might happen, but I received zero public responses. I did receive one thoughtful private response, but I was asked to keep it private. Suffice it to say that some in TA think there is a difference between TA and chart-reading.

As for me, though I have sometimes been critical of TA, and sometimes less than cautious in my words, my guesses at the two questions are: 1) There is no common underlying theory to all TA, there are a variety of competing theories. 2) Most chart-readers are momentum players, as are most growth investors. Some TA practitioners do try to profit from turning points, but they seem to be a minority.

I’m not saying TA doesn’t work, because I have my own variations on it that I have applied mainly to bond investing. But I’m not sure how one would test if TA in general does or doesn’t work, because there may not be a commonly accepted definition of what TA would say on any specific situation.

4) One more note from RM today:


David Merkel
Just in Case
2/25/2008 4:20 PM EST

Um, after reading this article at the Financial Times, I thought it would be a good idea for me to point readers to my article that explained the 2005 Correlation Crisis. Odds are getting higher that we get a repeat. What would trigger the crisis? A rapid decline in creditworthiness for a minority of companies whose debts are referenced in the relevant credit indexes, while the rest of the companies have little decline in creditworthiness. One or two surprise defaults would really be gruesome.

Just something to watch out for, as if we don’t have enough going wrong in our debt markets now. I bumped into some my old RM articles and CC comments from 2005, and the problems that I described then are happening now.

Position: none, and there are times when I would prefer not being right. This is one of them. Few win in a bust.

There are situations that are micro-stable and macro-unstable, and await some force to come along and give it a push, knocking it out of its zone of micro-stability, and into a new regime of instability. When you write about situations like that before the fact, it is quite possible that you can end up wrong for a long time. I wrote for several years as RM about overleveraging credit, mis-hedging, yield-seeking, over-investment in residential real estate (May 2005), subprime lending (November 2006), quantitative strategies gone awry, etc. The important thing is not to put a time on the prediction because it gives a false message to readers. One can see the bubble forming, but figuring out when cash flow will be insufficient to keep the bubble financed is desperately hard.

5) This brings up another point. It’s not enough to know that an investment will eventually yield a certain outcome, for example, that a distressed tranche of an ABS deal will eventually pay off at par. One also has to understand whether an investor can handle the financing risks before receiving the eventual payoff. Will your prime broker continue to finance you on favorable terms? Will your regulator force you to put up more capital against the position? Will your investors hang around for the eventual payoff, or will they desert you, and turn you into a forced seller? Can your performance survive an asset that might be a dud for some time?

This is why the price path to the eventual payoff matters. It shakes out the weak holders, and moves assets that should be financed by equity onto strong balance sheets. It’s also a reason to be careful with your own balance sheet during boom times, and in the beginning and middle of financial crises — don’t overextend your positions, because you can’t tell how long or deep the crisis might be.

6) I agree with Caroline Baum; I don’t think that the FOMC is pushing on a string. The monetary aggregates are moving up, and nominal GDP will as well… it just takes time. The yield curve has enough slope to benefit banks that don’t face a lot of credit problems… and the yield curve will steepen further from here, particularly if the expected nadir of Fed funds drops below 2%. Now, will real GDP begin to pick up steam? Not sure, the real question is how much inflation the Fed is willing to accept in the short run as they try to reflate.

7) Now, inflation seems to be rising globally. At this point in the cycle, the FOMC is ahead of almost all major central banks in loosening policy. I think that is baked into the US dollar at present, so unless the FOMC gets even more ahead, the US Dollar should tread water here. Eventually inflation elsewhere will get imported into the US. It’s just a matter of time. That’s why I like TIPS here; eventually the level of inflation passing through the CPI will be reflected in implied inflation rates.

8 ) Okay, MBIA will split in 5 years? That is probably enough time to strike deals with most everyone that they wrote coverage for structured products, assuming the losses are not so severe that the entire holding company is imperiled. If it’s five years away, splitting is a possibility, but then are the rating agencies willing to wait that long? S&P showed that they are willing to wait today. Moody’s will probably go along, but for how long?

9) I found it interesting that AQR Capital has not been doing well in 2008. When quant funds did badly in the latter half of 2007, I suffered along with them. At present, I am certainly not suffering, but it seems that the quants are. I wonder what is different now? I suspect that there is too much money chasing the anomalies that the quant funds target, and we reached the end of the positive self-reinforcing cycle around mid-year 2007; since then, we have been in a negative self-reinforcing cycle, with clients pulling money, and the ability to carry positions shrinking.

10) Now some graphs tell a story. Sometimes the story is distorted. This graph of the spread on Fannie Mae MBS is an example. Not all of the spread is due to the creditworthiness of Fannie Mae. Those spreads have widened 30 basis points or so over the past six months for Fannie’s on-the-run 5-year corporate bond, versus 50 basis points on the graph that I referenced. So what’s the difference? Increased market volatility makes residential MBS buyers more skittish, and they demand a higher yield for bearing the negative optionality inherent in RMBS. Fannie and Freddie are facing harder times from the guarantees that they have written, and the credit difficulties at the mortgage insurers, but it would be difficult to imagine the US Government allowing Fannie or Freddie to default on senior obligations.

That’s another reason why I like agency-backed RMBS here. You’re getting paid a decent spread to bear the risks involved.

11) I would be cautious about using prics from CMBX, ABX, etc., to make judgments about the cash bonds that they reference. It is relatively difficult to borrow and short small ABS and CMBS tranches. It is comparatively easy to buy protection on the indexes, the only question is what level does it take to induce another market participant to sell protection to you. When there is a lot of pressure to short, prices overshoot on the downside, and stay well below where the cash bonds would trade.

12) One last point, this one coming via one of our dedicated readers passing on this blurb from David Rosenberg at Merrill Lynch:

A client sent this to us last week

It was a New York Times article by Louis Uchitelle in December 1990 on the housing and credit crunch. In the article, there is a quote that goes like this ? ?This is different from the experience of the Great Depression, but something related to the 1930?s is beginning to happen?. Guess who it was that said that (answer is at the bottom of the Tidbits).

Answer to question above

?Ben Bernanke, a Princeton University Economist? (and future Fed chairman, but who knew that then?).

My take: it is a very unusual time to have a man as Fed Chairman who is a wonk about the Great Depression. That makes him far more likely to ease. The real question is what the FOMC will do if economic weakness persists, and inflation continues to creep up. I know that they want to save the day, and then remove all policy accomodation, but that’s a pretty difficult trick to achieve. In this scenario, I don’t think the gambit will work; we will likely end up with a higher rate of price inflation.

Is the PEG Ratio a Valid Concept?

Is the PEG Ratio a Valid Concept?

This piece is a work in progress, so I solicit your feedback on it. How could it be improved?

=-=-=-=-=-=-=-=-=-=-=-=-=-=-=-=-=-=-=-=-=-=-=-=-=-=-=-=-=-=-=-=-=-=-=-=-=-=-=-=-=-

I enjoy it when my expectations are proven wrong, because it means that I learned something in the process. When I began preparation for this post (which will probably have two parts, because I am having difficulty posting files, tables and pictures at my blog), I expected to write a post that would conclude that the PEG ratio (P/E divided by the anticipated growth rate expressed as an integer) is a nifty market artifact, but had no sound theoretical grounding.

The answer to the question in my title is complex. The answers are No, Sometimes, and Yes.

  • If you?re a deep value investor: No.
  • If you?re a moderate value or core investor: Sometimes.
  • If you?re a fundamentally-driven moderate growth investor: Yes.
  • If you?re an aggressive growth investor: No.

When I did my earlier post on my version of the Fed Model, I began by showing that it was a simplification of the simple version of the dividend discount model [DDM], which states that the value of a stock is equal to the present value of its future dividends. I?m going to do the same thing here with a few changes:

? I can?t prove what I am stating analytically, that is, by manipulating equations. I?m going to do it through scenario analysis and regression.

? My piece on my Fed model used the simple DDM. This piece uses a three-stage DDM. The stages are growth, transition, and maturity. For those with access to a Bloomberg Terminal, my implementation is a more conservative version of what they did.

Three-Stage DDM Assumptions

  • ? Initial forecast earnings (E1)
  • ? Initial dividend payout ratio as a portion of earnings (PR1)
  • ? Growth rate of earnings in the first phase of the model (g)
  • ? Length of the first phase (5 years)
  • ? Length of the second transition phase (6 years)
  • ? Ultimate earnings growth rate in maturity (6%)
  • ? Ultimate payout ratio in maturity (50%)
  • ? Discount rate for the dividend stream (ks), otherwise known as the required rate of return (i.e., what does an investor have to expect to earn in order to get him to part with his cash?)

In brief, in the first phase of the model, earnings grow at a rapid rate, and dividends are paid at a relatively low rate, in the second (transition) phase, the earnings growth and dividend payout rates grade linearly into the rates of the ultimate phase. The resulting dividend stream gets discounted at a discount rate reflecting the riskiness of the company.

Limitations of the Model

  • ? It is difficult to forecast earnings for next year, much less give a growth rate for the next 5 years. I use sell side estimates as an initial jumping off point.
  • ? Companies grow erratically.
  • ? The maturation of a company is rarely so linear.
  • ? The lengths of the first two phases are somewhat arbitrary, though the sell side typically does 5-year growth rates.
  • ? A 6% growth rate in maturity is consistent with long term nominal GDP growth, but it is still quite an assumption.
  • ? Payout rates and growth rates should be inversely correlated. To the extent that capital constrains business growth, a higher rate of dividend payout should result in a lower earnings growth rate.
  • ? The discount rate is difficult to calculate. Theoretically, it should be 2-3% percent higher than the highest yield on the longest, most subordinated debt or preferred of the company. If a company has no debt, compare it to the yields of bonds of other companies with similar put option implied volatility 20% or more out of the money. Then add 2-3% to those yields.
  • ? Payout rates and the discount rate should be negatively correlated. Companies with high payout rates will be judged to be less risky most of the time, and vice-versa.

All that said, the DDM is a model, and a richer model than the PEG ratio. My question became, ?Are there conditions where the results of the DDM resemble a PEG ratio?? The answer to that is yes, when:

  • The discount rate is 14% or lower
  • At lower discount rates, only for higher P/Es. For example at a discount rate of 8%, the PEG ratio works for P/Es 16 and higher.

Now I oversimplified my conclusions here. Look at this graphic:

Validity Space
Or, based off of that, consider this graph, which shows the PEG hurdle rates as a function of initial P/Es. and cost of capital (discount) rates:

Price-to-Value Graph

How did I come to this result? For differing levels of the discount rate, I varied P/E levels, calculating the initial phase growth rate that would make price equal to value in the DDM. Those P/E and growth levels gave me the PEG ratios. Those PEG ratios were often quite flat for higher P/Es at a given level of the discount rate of 14% or below. There is usually a bit of a smile or smirk, but you can see an average level.

At 16% or higher levels of the discount rate, the PEG ratio falls apart. At low levels of P/E the required PEG ratio should be low. At high levels of P/E, the required PEG ratio can be higher. The intuition here is that situations with high discount rates, and thus high risk, require high growth to fuel value in a DDM calculation.

At low discount rates, and low P/Es, the DDM says that value investors don?t need much growth at all in order to buy good values. If one considers the inverse of the P/E, the E/P, or earnings yield, when it is greater than the discount rate, it is hard to lose money, even when earnings don?t grow. Even more so when the dividend yield exceeds or is near the discount rate.

A Formula for the PEG Ratio Hurdle

Taking the average PEG hurdle rates for P/Es 16 and above, where price equaled DDM Value, for various discount and payout rates, I calculated a regression to give a more general PEG hurdle rate formula. The factors appeared multiplicative, so I used a formula that looked like this:

ln ( average PEG hurdle) = a + b * ln(discount rate) + c * ln(payout rate) + e (error term)

The regression had an adjusted R-squared of 98%, with all coefficients statistically significant at prob-values of 99% or better. a was 7.8646, b was -1.3169 and c was .0752. In summary form, the formula looks like this:

Average PEG hurdle = 26.03 * discount rate-1.3169 * payout rate0.0752

Pretty good, but after a little while, I asked if I could create a formula that better represented the curves in graph 2. So, I ran the following regression:

ln (PEG hurdle) = a + b * ln(discount rate) + c * ln(payout rate) + d * ln(P/E) + e (error term)

I had a debate as to how to censor the data. I threw out data points with negative PEG hurdles in the first analysis. In the second one, I threw out negative PEG hurdles, and PEG hurdles over 2.0x. On the second analysis, my reasoning was that if PEG hurdles over 2.0 are acceptable, we?re in weird times. Now perhaps that pre-judges the situation, but the right functional form for graph 2 eludes me here. Personally, I would use the second formula here:

Formula 1: Average PEG hurdle = 0.01823 * discount rate-1.6279 * payout rate0.1039 * PE Ratio0.1893

Formula 2: Average PEG hurdle = 0.02035 * discount rate-1.4215 * payout rate0.0941 * PE Ratio0.2704

Formula 1 has an R-squared of 76%, and with 2 it is 88%. The t-statistics are all significant at 99% levels.

Now, suppose I am a growth investor and I decide to apply formula 2. I look for stocks with PE ratios of around 20, my discount rate is 15%, and the dividend payout rate is around 10%. What annual earnings growth should I be looking for over the next 5 years? The formula says 36.6%. Pretty aggressive. At a discount rate of 12%, the growth rate drops to 26.6%.

What this points out in a way is the difficulty of making consistent money in growth stocks. The earnings growth rates needed to make money in excess of the discount rate on average over time is higher than most growth investors realize.

Growth investors overpay for growth. That is one of the reasons that I am a value investor.

One final note: Jim Cramer has a limit for what he is willing to pay for growth stocks ? a PEG ratio of 2.0x. Now, he?s a bright guy, so there are two ways that I can interpret this. 1) Since momentum plays a large role in Cramer?s investing, the 2.0x ceiling limits his risk while he plays momentum. Or, 2) he has longer periods of competitive advantage and transition than I do. I favor the first interpretation, because it is rare in my opinion that growth investors should pay over 1.5 times the growth rate for any investment, unless the barriers to entry are significant.

Summary

PEG ratios work for core and growth investors, but the PEG ratio hurdles needed for investment are lower than most investors think, so long as the expected rate of return (discount rate) is high.? As for me, I will stick with value investing, where the need for earnings growth is negligible.

Correction: Pushing on a String? Credit Marches to its Own Drummer.

Correction: Pushing on a String? Credit Marches to its Own Drummer.

With apologies to Mr. Krugman, I must correct some of what I wrote in my piece, “Pushing on a String? Credit Marches to its Own Drummer.“? When one does statistical analyses, one needs to understand the limitations/features of the tools that one uses.? Bloomberg’s regression function had a funny default that led me to make an error.? Had I done it right, the R-squared over the full sample period would have been 64.8% (correlation 80.5%), with a beta of 0.614.? Lagging the Fed funds target by one year, roughly the time it takes Fed policy to work boosted the R-squared to 77.2% (correlation 87.9%), with a beta of 67.1%.

But, here ‘s what is unusual.? If one is looking at the last five years, the relationship has broken down.? During that period, with no lag, the R-squared was 11.2% (correlation 33.5%), with a beta of negative 13.0%.? Even with the lag, the R-squared was 3.8% (correlation 19.4%), with a beta of negative 3.7%.

My conclusion: given the unusual credit conditions in the 2000s, where we have had extremes of default and monetary policy, I would not rush to say that the Fed is pushing on a string, yet.? That said, the debts of financial companies are a larger part of the index than they were five of ten years ago, and they are the ones in trouble at present, unlike the prior difficulties in industrials and utilities in 2001-2003.? Because of that, the Baa index of Moody’s may lag longer than ordinary versus Fed funds… but Fed policy has been called impotent before, and usually just before it shows its bite, as in the tech bubble of 2000, or the liquidity rally of spring 2003.

To my readers: if you see something that might be amiss in my writings, post a comment.? I owe it to all of you that I post corrections when I make mistakes.? Thanks for bearing with me on this one.? In the original piece, I sounded more certain than I should have, to my detriment…

Pushing on a String?  Credit Marches to its Own Drummer.

Pushing on a String? Credit Marches to its Own Drummer.

Thanks to Naked Capitalism for pointing out this post by Paul Krugman. Here was my response:

Mr. Krugman, do your homework. Extend the graph out to five years, and you will see that yields on Baa bonds fluctuated between 7.1% and 5.7% over that time period. The correlation between Fed funds and Moody’s Baa series was pretty small during that time period, whether the fed funds rate was rising or falling. I just calculated the R-squared on the regression — 0.1%, for a 3.2% correlation.

Maybe it’s just a bad time period, so I ran it back to 1971, which was as far as my Bloomberg terminal would let me go. (Maybe I’ll go to FRED and download longer series, and use Excel, but I don’t think the result will be much different — the R-squared was 6.5%, for a correlation coefficient of 25.5%. Not a close relationship in my book for two time series relationships that are both interest rates.

Practical economists like me are aware that credit-sensitive investments often have little practical relationship to Fed funds. We work in the trenches of the bond market, not the isolation of academic economics, where you don’t contaminate your theories with data.

The Fed may or may not be pushing on a string, but you have certainly not proven your case.

-=-=-=-=-

Here’s the graph for the Fed funds rate and Moody’s Baa yield series since 1971. (When I ran my calculations, I used monthly, but could only get the graph back to 1971 if I went to quarterly.

Fed funds and Moody?s Baa

(graph: Bloomberg)

As I said, not much of a correlation, but why so low?? This is related to a topic on which Bill Rempel has asked me for an article.? (To do that article, I have to drag a lot of yield data off of Bloomberg for analysis; I will be getting my full subscription soon, and once that happens, I can start.)

As an investment actuary, I’ve had to develop models of the full? maturity/credit yield curve — maturities from 3 months to 30 years (usually about 10 points) and credit from Treasuries, Agencies and Swaps to Corporates, AAA to Single-B.? A Treasury yield curve at any point in time can be fairly expressed by a four factor model, and the R-squared is usually around 99%.? (I learned this in 1991, and there is a funny story around how I learned this, involving a younger David and a Bear Stearns managing director.)

The short end of the Treasury yield curve is usually far more volatile than the long end in yield terms (but not in price terms!).? All short high-quality rates are tightly correlated, and that includes Fed funds, Agency discount notes, T-bills, LIBOR (well, usually), A-1/P-1 commercial paper, etc.? As one goes further down the yield curve in maturity, the correlations weaken, but still remain pretty tight among bonds rated single-A or better.? (As a further note, Fed funds and 30-year Treasury yields also don’t correlate well.)

Credit is its own factor, which varies with expectations of the economy’s future prospects.? A single-B, or CCC borrower can only repay with ease if the economy does well.? If prospects are looking worse, no matter what the Fed does to short high-quality rates, junk grade securities will tend to rise in yield.? Marginal investment grade securities (BBB/Baa) will tread water, and short high-quality bond yields will correlate well with Fed funds.

When I say “credit is its own factor,” what I am saying is that outside of Treasury securities, every credit instrument participates to varying degrees in exposure to the future prospects of the economy.? (Credit in its purest form behaves like equity returns.)? For conservatively capitalized enterprises with high quality balance sheets, their credit spreads don’t change much as prospects change for the economy.? For entities with low quality balance sheets, their spreads change a lot as prospects change for the economy.

So, for two reasons, Mr. Krugman should not have expected the Fed funds target rate and the Moody’s Baa yield to correlate well:

  1. Fed funds is a short rate, and Moody’s Baa is relatively long (bonds go over the full maturity spectrum).
  2. Fed funds correlates well with the highest quality yields, and Baa is only marginally investment grade.? Recessions should hurt Baa spreads, leaving yields relatively constant.
Theme: Overlay by Kaira