Category: Quantitative Methods

On Financial Risk Statements, Part 1

On Financial Risk Statements, Part 1

Photo Credit: Chris Piascik

Most formal statements on financial risk are useless to their users. Why?

  • They are written in a language that average people and many regulators don’t speak.
  • They often don’t define what they are trying to avoid in any significant way.
  • They don’t give the time horizon(s) associated with their assessments.
  • They don’t consider the second-order behavior of parties that are managing assets in areas related to their areas.
  • They don’t consider whether history might be a poor guide for their estimates.
  • They don’t consider the conflicting interests and incentives of the parties that?direct the asset managers, and how their own institutional risks affect their willingness to manage the risks that other parties deem important.
  • They are sometimes based off of a regulatory view of what can/must be stated, rather than an economic view of what should be stated.
  • Occasionally, approximations are used where better calculations could be used. ?It’s amazing how long some calculations designed for the pencil and paper age hang on when we have computers.
  • Also, material contract provisions that are hard to model/explain often get ignored, or get some brief mention in a footnote (or its equivalent).
  • Where complex math is used, there is no simple language to explain the economic sense of it.
  • They are unwilling to consider how volatile financial processes are, believing that the Great Depression, the German Hyperinflation, or something as severe, could never happen again.

(An aside to readers; this was supposed to be a “little piece” when I started, but the more I wrote, the more I realized it would have to be more comprehensive.)

Let me start with a brief story. ?I used to work as an officer of the Pension Division of Provident Mutual, which was the only place I ever worked where analysis of risks came first, and was core to everything else that we did. ?The mathematical modeling that I did in there was some of the best in the industry for that era, and my models helped keep us out of trouble that many other firms fell into. ?It shaped my view of how to manage a financial business to minimize risks first, and then make money.

But what made us proudest of our efforts was a 40-page document written in plain English that ran through the risks that we faced as a division of our company, and how we dealt with them. ?The initial target audience was regulators analyzing the solvency of Provident Mutual, but we used it to demonstrate the quality of what we were doing to clients, wholesalers, internal auditors, rating agencies, credit analysts, and related parties inside Provident Mutual. ?You can’t believe how many people came to us saying, “I get it.” ?Regulators came to us, saying: “We’ve read hundreds of these; this is the first one that was easy to understand.”

The 40-pager was the brainchild of my boss, who was the most intuitive actuary that I have ever known. ?Me? I was maybe the third lead investment risk modeler he had employed, and I learned more than I probably improved matters.

What we did was required by law, but the way we did it, and how we used it was not. ?It combined the best of both rules and principles, going well beyond the minimum of what was required. ?Rather than considering risk control to be something we did at the end to finagle credit analysts, regulators, etc., we took the economic core of the idea and made it the way we did business.

What I am saying in this piece is that the same ideas should be more actively and fully applied to:

  • Investment prospectuses and reports, and all investment and insurance marketing literature
  • Solvency documents provided to regulators, credit raters, and the general public by banks, insurers, derivative counterparties, etc.
  • Risk disclosures by financial companies, and perhaps non-financials as well, to the degree that financial markets affect their real results.
  • The reports that sell-side analysts write
  • The analyses that those that provide asset allocation advice put out
  • Consumer lending documents, in order to warn people what can happen to them if they aren’t careful
  • Private pension and employee benefit plans, and their evil twins that governments create.

Looks like this will be a mini-series at Aleph Blog, so stay tuned?for part two, where I will begin going through what needs to be corrected, and then how it needs to be applied.

Lagging Long Yields

Lagging Long Yields

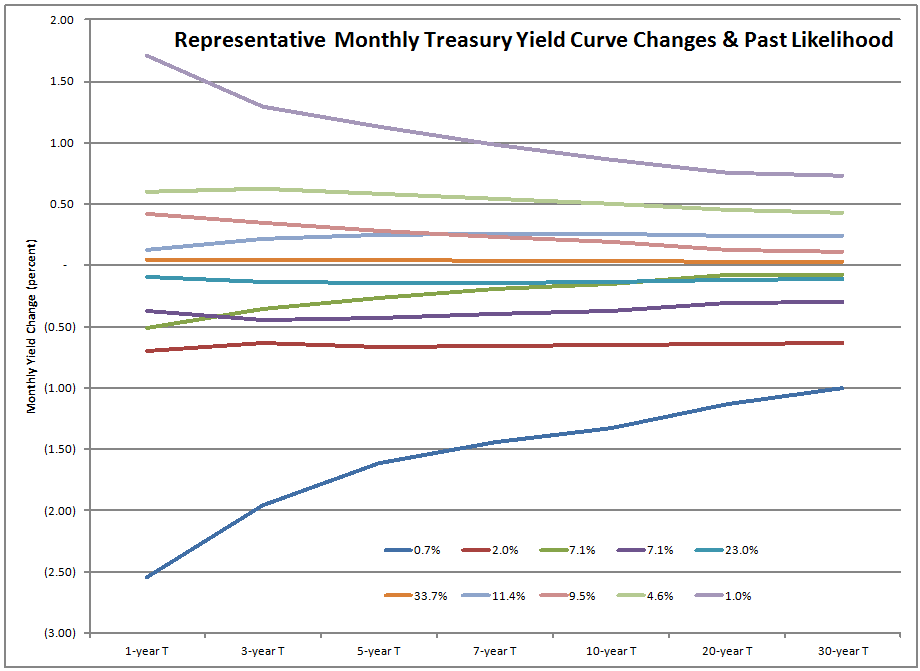
yield curve shifts_22703_image001I’m a very intellectually curious person — I could spend most of my time researching investing questions if I had the resources to do that and that alone. ?This post at the blog will be a little more wonky than most. ?If you don’t like reading about bonds, Fed Policy, etc., you can skip down to the conclusion and read that.

This post stems from an investigation of mine, and two recent articles that made me say, “Okay, time to publish the investigation.” ?The investigation in question was over whether yield curves move in parallel shifts or not, thus justifying traditional duration [bond price interest-rate?sensitivity] statistics or not. ?That answer is complicated, and will be explained below. ?Before I go there, here are the two articles that made me decide to publish:

The first article goes over the very basic idea that using ordinary tools like the Fed funds rate, you can’t affect the long end of the yield curve much. ?Here’s a quote from Alan Greenspan:

?We wanted to control the federal funds rate, but ran into trouble because long-term rates did not, as they always had previously, respond to the rise in short-term rates,? Greenspan said in an interview last week. He called this a ?conundrum? during congressional testimony in 2005.

This is partially true, and belies the type intelligence that a sorcerer’s apprentice has. ?The full truth is that long rates have a forecast of short rates baked into them, and reductions in short term interest rates usually cause long-term interest rates to fall, but far less than short rates. ?There are practical limits on the shape of?the yield curve:

1) Interest rates can’t be negative, at least not very negative, and if they are negative, only with the shortest highest quality debts.

2) It is very difficult to get Treasury yield curves to have a positive slope of more than 4% (30Yr – 1Yr) or 2.5% (10Yr – 2Yr).

3) It is very difficult to get Treasury yield curves to have a negative slope of more than -1.5% (30Yr – 1Yr) or -1% (10Yr – 2Yr) in absolute terms (i.e., it’s hard to get more negative than that).

On points 2 and 3, when the yield curve is at extremes, the real economy and fixed income speculators react, putting pressure on the curve to normalize.

Aside from that, on average how much do longer Treasury yields move when the One-year Treasury yield moves?

Maturity Sensitivity
3-year T 94.64%
5-year T 89.31%
7-year T 85.17%
10-year T 81.14%
20-year T 75.41%
30-year T 72.89%

The answer is that the effect gets weaker the longer the bond is, bottoming out at 73% on 30-year Treasuries. But give Greenspan a little credit — in 2005 the 30-year Treasury yield was barely budging as short rates rose 4%. ?Then take some of the credit away — markets hate being manipulated, so as the Fed uses the Fed funds rate over a long period of time, it gets less powerful. ?In that sense, the Fed and the bond market integrated, as the market began looking past the tightening to the long-term future of US borrowing rates, what happened to short interest rates became less powerful on long yields. ?This is particularly true in an era where China was aggressively buying in US debt, and interest rate derivatives allowed some financial institutions to escape the interest rate boundaries to which they were previously subject.

Also note my graph above. ?I took the Treasury yield curves since 1953, and used an optimization model to estimate 10 representative curves for monthly changes in the yield curve, and the probability of each one occurring. ?If yield curves moving in a parallel direction means the monthly changes at different points in the curve never vary by more than 0.15%, it means that monthly changes in yield curves are parallel roughly 70% of the time.

When do the non-parallel shifts occur? ?When monetary policy moves aggressively, long rates lag, leading the yield curve to flatten or invert on tightening, and get very steep with loosening.

Later, the article hems and haws over whether rising long rates would be a good or a bad thing, ending with the idea that the Fed could sell its long Treasury bonds to raise long yields if needed. ?That brings me to the second article, which says that long interest rates are at record lows, as measured by average Treasury yields on bonds with 10 years or more to mature.

The graph in the second article shows that it takes a long time for inflation to come back after the economy has been in a strongly deflationary mode, where bad debts have to be eliminated one way or another. ?Given the way that monetary policy encouraged the buildup of the bad debts from 1984-2007, it should be little surprise that long rates are still low.

Conclusion

So what should the Fed do? ?If they weren’t willing to try a more radical solution, I would tell them to experiment with selling long Treasuries outright, and not telling the market that it was doing so. ?The reason for this is that it would allow the Fed to separate out the actual effect of more Treasury supply on yields, versus how much the market might panic when it learns?that the long Treasuries might be available for sale. ?The second effect would be like Ben Bernanke mentioning the word “taper” without thinking what the effect would be on the forward curve of interest rates. ?It would be an expensive experiment, but I think it would show that selling the bonds in small amounts would have little impact, while the fear of a flood would have a big but temporary impact.

If the Fed doesn’t want to raise long rates, it could try moving Fed funds up more quickly. ?Historically, long rates would lag more than with a slow rise. (Note: 2004-2007 experience does not validate that idea.)

What do I think the Fed will do? ?I think that eventually they will let all long Treasuries and MBS mature on their own, and?replace them with short Treasuries, should they decide not to shrink the balance sheet of the financial sector as a whole. ?That’s similar to what they did after the 1951 Accord, which restored the Fed’s independence after monetizing some of the debt incurred in WWII. ?Maybe this is the way they eliminate the debt monetization now, if they ever do it.

I think the present Fed will delay taking any significant actions until they feel forced to do so. ?They have no incentive to take any risk of derailing any?recovery, and will live with more inflation should it arrive.

PS –?that?long rates move more slowly than short rates may mean that duration calculations for longer bonds are overstated relative to shorter bonds. ?It might mean that 30-year notes would be 2-3 years shorter relative to one year notes than a parallel shift would indicate.

Problems in Simulating Investment Returns

Problems in Simulating Investment Returns

Photo Credit: Hans and Carolyn || Do you have the right building blocks for your model?

Simulating hypothetical future investment returns can be important for investors trying to make decisions regarding the riskiness of various investing strategies. ?The trouble is that it is difficult to do right, and I rarely see it done right. ?Here are some of the trouble spots:

1) You need to get the correlations right across assets. ?Equity returns need to move largely but not totally together, and the same for credit spreads and equity volatility.

2) You need to model bonds from a yield standpoint and turn the yield changes into price changes. ?That keeps the markets realistic, avoiding series of price changes which would imply that yields would go too high or below zero.?Yield curves also need ways of getting too steep or too inverted.

3) You need to add in some momentum and weak mean reversion for asset prices. ?Streaks happen more frequently than pure randomness. ?Also, over the long haul returns are somewhat predictable, which brings up:

4) Valuations. ?The mean reversion component of the models needs to reflect valuations, such that risky assets rarely get “stupid cheap” or stratospheric.

5) Crises need to be modeled, with differing correlations during crisis and non-crisis times.

6) Risky asset markets need to rise much more frequently than they fall, and the rises should be slower than the falls.

7) Foreign currencies, if modeled, have to be consistent with each other, and consistent with the interest rate modeling.

Anyway, those are some of the ideas that realistic simulation models need to follow, and sadly, few if any follow them all.

Even with Good Managers, Volatility Matters

Even with Good Managers, Volatility Matters

Photo Credit: sea turtle

This is another episode in my continuing saga on dollar-weighted returns. We eat dollar-weighted returns.? Dollar-weighted returns are the returns investors actually receive in a open-end mutual fund or an ETF, which includes their timing decisions, as opposed to the way that performance statistics are ordinarily stated, which assumes that investors buy-and-hold.

In order for active managers to have a reasonable chance of beating the market, they have to have portfolios that are significantly different than the market. ?As a result, their portfolios will not behave like the market, and if they are good stockpickers, they will?beat the market.

Now, many of the active managers that have beaten the market run concentrated portfolios, with relatively few stocks comprising a large proportion of the portfolio. ?Alternatively, they may concentrate their portfolio in relatively few industries at a time, as I do. ?Before I begin my criticism, let me simply say that I believe in concentrated portfolios — I do that myself, but with a greater eye for risk control than some managers do.

My first article on this topic was Bill Miller, who is a really bright guy with a talented staff. ?This is the “money shot” from that piece:

Legg Mason Value Trust enthused investors as they racked up significant returns in the late 90s, and the adulation persisted through 2006.? As Legg Mason Value Trust grew larger it concentrated its positions.? It also did not care much about margin of safety in financial companies.? It bought cheap, and suffered as earnings quality proved to be poor.

Eventually, holding a large portfolio of concentrated, lower-quality companies as the crisis hit, the performance fell apart, and many shareholders of the fund liquidated, exacerbating the losses of the fund, and their selling pushed the prices of their stocks down, leading to more shareholder selling.? I?m not sure the situation has stabilized, but it is probably close to doing being there.

Investors in the Legg Mason Value Trust trailed the returns of a buy-and-hold investor by 6%/year over the time my article covered. ?Investors bought late, and sold late. ?They bought after success, and sold after failure. ?That is not a recipe for success.

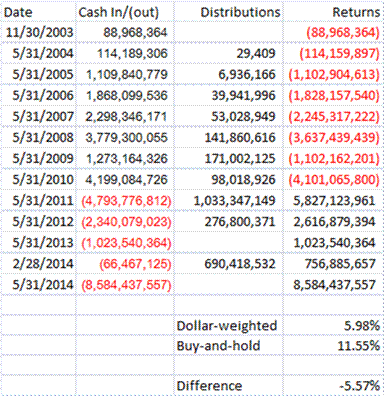
FAIRX_15651_image002Tonight’s well-known fund with a great track record is the Fairholme Fund. Now, I am not here to criticize the recent performance of the fund, which due to its largest positions not doing well, has suffered of late. Rather, I want to point out how badly investors have done in their purchases and sales of this fund.

As the fame of Bruce Berkowitz (a genuinely bright guy) and his fund grew, money poured in. ?During?and after relatively poor performance in 2011, people pulled money from the fund. ?Even with relatively good performance in 2012 and 2013, the withdrawals have continued. ?The adding of money late, and the disproportionate selling after the problems of 2011 led the dollar weighted returns, which is what the average investors get, to lag those of the buy-and-hold investors by 5.57%/year over the period that I studied.

(Note: in my graph, the initial value on 11/30/2003 and the final value on 5/31/2014 are the amounts in the fund at those times, as if it had been bought and sold then — that was the time period I studied, and it was all of the data that I had. ?Also, shareholder money flows were assumed to occur mid-period.)

Lessons to Learn

  1. Good managers who have ideas that will work out eventually need to be bought-and-held, if you buy them at all.
  2. Be wary of managers who are so concentrated, that when they receive a lot of new cash after good performance, that the new cash forces the prices of the underlying stocks up. ?Why be wary? ?Doesn’t that sound like a good thing if new money forces up the price of the mutual fund? ?No, because the fund has “become the market” to its stocks. ?When the time comes to sell, it will be ugly. ?If you are in a fund like this, where the fund’s trading has a major effect on all of the stocks that it holds, the time to sell is now.
  3. There is a cost to raw volatility in large concentrated funds. ?The manager may have the guts to see it through, but that doesn’t mean that the fundholders share his courage. ?In general, the more volatile the fund, the less well average investors do in buying and selling the fund. ?(As an aside, this is a reason for those that oversee 401(k) plans to limit the volatility of the choices offered.
  4. Even for the buy-and-hold investor, there is a risk investing alongside those who get greedy and panic, if the cash flow movements are large enough to influence the behavior of the fund manager at the wrong times. ?(I.e., forced buying high, and forced selling low.)
  5. The forced buying high should be avoidable — the manager should come up with new ideas. ?But if he doesn’t, and flows are high relative to the size of the fund, and the market caps of investments held, it is probably time to move on.
  6. When you approach adding a new mutual fund to your portfolio, ask the following questions: Am I late to this party? ?Does the manager have ample room to expand his positions? ?Is this guy so famous now that the underlying investors may affect his performance materially?
  7. Finally, ask yourself if you understand the investment well enough that you will know when to buy and/or sell it, given you investing time horizon. ?This applies to all investments, and if you don’t know that, you probably should steer clear of investing in it, and learn more, until you are comfortable with the investments in question.

One final note: I am *not* a fan of AIG at the current price (I think reserves are understated, among other things), so I am not a fan of the Fairholme Fund here, which has 40%+ of its assets in AIG. ?But that is a different issue than why average investors have underperformed buy-and-hold investors in the Fairholme Fund.

Factor Glut

Factor Glut

Photo Credit: Dan Century

I use factors in my investing. What *are* factors, you ask? ?Factors are quantitative variables that have been?associated with potential outperformance. ?What are some of these factors?

  1. Valuation (including yield)
  2. Price Momentum (and its opposite in some cases)
  3. Insider Trading
  4. Industry factors
  5. Neglect
  6. Low Volatility
  7. Quality (gross margins as a fraction of assets)
  8. Asset shrinkage
  9. Share count shrinkage
  10. Measures of accounting quality
  11. and more…

This is a large portion of what I use for screening in my eighth portfolio rule. ?I’m not throwing this idea out of the window, but I am beginning to call it into question. ?Why?

I feel that the use of the most important factors are getting institutionalized, such that many major investors are giving their portfolios a value tilt, sometimes momentum tilts, and other sorts of tilts. ?I?also see this in ETFs, where many funds embrace value, yield, momentum, accounting, or?other tilts.

Now, we have been through this before. ?In 2007, momentum with value hedge funds became overinvested in the same names, with many of the funds using leverage to goose returns. ?There was quite a washout in August of that year as many investors exited that crowded trade.

I’m not saying we will see something like that immediately, but I am wary to the point that when I do my November reshaping, I’m going to leave out?the valuation, yield and momentum factors, and spend more time analyzing the industry and idiosyncratic company risks. ?If after that, I find cheap stocks, great, but if not, I will own companies that are hopefully not owned by a lot of people just because of a few quantitative statistics.

I may be a mathematician, but I try to think in broader paradigms — when too many people are looking at raw numbers and making decisions off of them solely, it is time to become more qualitative, and focus on strong business concepts at reasonable prices.

Numerator vs Denominator

Numerator vs Denominator

Photo Credit: Jimmie

Every now and then, a piece of good news gets announced, and then something puzzling happens. ?Example: the GDP report comes out stronger than expected, and the stock market falls. ?People scratch their heads and say, “Huh?”

A friend of mine who I haven’t heard from in a while, Howard Simons, astutely would comment something to the effect of: “The stock market is not a futures contract on GDP.” ?This much is true, but why is it true? ?How can the market go down on good economic news?

Some of us as investors use a concept called a discounted cash flow model. ?The price of a given asset is equal to the expected cash flows it will generate in the future, with each future cash flow?discounted to reflect to reflect the time value of money and the riskiness of that cash flow.

Think of it this way: if the GDP report comes out strong, we can likely expect corporate profits to be better, so the expected cash flows from equities in the future should be better. ?But if the stock market prices fall, it means the discount rates have risen more than the expected cash flows have risen.

Here’s a conceptual problem, then: We have estimates of the expected cash flows, at least going a few years out but no one anywhere publishes the discount rates for the cash flows — how can this be a useful concept?

Refer back to a piece I wrote earlier this week. ?Discount rates reflecting the cost of capital reflect the alternative sources and uses for free cash. ?When the GDP report came out, not only did come get optimistic about corporate profits, but perhaps realized:

  • More firms are going to want to raise capital to invest for growth, or
  • The Fed is going to have to tighten policy sooner than we?thought. ?Look at bond prices falling and yields rising.

Even if things are looking better for?profits for existing firms, opportunities away from existing firms may improve even more, and attract capital away from existing firms. ?Remember how stock prices slumped for bricks-and-mortar companies during the tech bubble? ?Don’t worry, most people don’t. ?But as those prices slumped, value was building in those companies. ?No one saw it then, because they were dazzled by the short-term performance of the tech and dot-com stocks.

The cost of capital was exceptionally low for the dot-com stocks 1998-early?2000, and relatively high for the fuddy-duddy companies. ?The economy was doing well. ?Why no lift for all stocks? ?Because incremental dollars available for finance were flowing?to the dot-com companies until?it became obvious that little to no cash would ever flow back from them to investors.

Afterward, even as the market fell hard, many fuddy-duddy stocks didn’t do so badly. ?2000-2002 was a good period for value investing as people recognized how well the companies generated profits and cash flow. ?The cost of capital normalized, and many dot-coms could no longer get financing at any price.

Another Example

Sometimes people get puzzled or annoyed when in the midst of a recession, the stock market rises. ?They might think: “Why should the stock market rise? ?Doesn’t everyone?know that business conditions are lousy?”

Well, yes, conditions may be lousy, but what’s the alternative for investors for stocks? ?Bond yields may be falling, and inflation nonexistent, making money market fund yields microscopic… the relative advantage from a financing standpoint has?swung to stocks, and the prices rise.

I can give more examples, and maybe this should be a series:

  • The Fed tightens policy and bonds rally. (Rare, but sometimes…)
  • The Fed loosens policy, and bonds fall. (also…)
  • The rating agencies downgrade the bonds, and they rally.
  • The earnings report comes out lower than last year, and the stock rallies.
  • Etc.

But perhaps the first important practical takeaway is this: there will always be seemingly anomalous behavior in the markets. ?Why? ?Markets are composed of people, that’s why. ?We’re not always predictable, and we don’t predict?better when you examine us as groups.

That doesn’t mean there is no reason for anomalies, but sometimes we have to take a step back and say something as simple as “good economic news means lower stock prices at present.” ?Behind that is the implied increase in the cost of capital, but since there is nothing to signal that, you’re not going to hear it on the news that evening:

“In today’s financial news, stock prices fell when the GDP report came out stronger than expected, leading investors to pursue investments in newly-issued bonds, stocks, and private equity.”

So be aware of the tone of the market. ?Today, bad news still seems to be good, because it means the Fed leaves interest rates low for high-quality short-term debt for a longer period than previously expected. ?Good news may imply that there are other places to attract money away from stocks.

Ideas for this topic are welcome. ?Please leave them in the comments.

What Should the Cost of Equity Be to Value Investors?

What Should the Cost of Equity Be to Value Investors?

5766453552_621667909d_z
Photo Credit: Sepehr Ehsani — Which project is better, project A or project B?

I can’t remember where I ran into it, but I found this article on a blog that I had not run into before on Calculating [the] Cost of Equity for Value Investors. ?I think it gets close to the right answer, and I would like to sharpen it here.

My answer to a lot of economic questions is: what’s the alternative? ?Many people look at the shiny formulas in investing but don’t ask what they really mean. ?(More people just don’t look at the formulas… which has its pluses and minuses. ?The math reveals, but it also conceals hidden assumptions.)

After wisely dismissing how to calculate the cost of equity from Modern Portfolio Theory [beta] and the Gordon model, he considers cost of equity based off of return on equity, and begins to get tied up in problems. ?Let me try.

The cost of equity is important for a number?of reasons:

  • It helps answer the question, “When should a company issue?or buy back?stock?”
  • It provides a measure for the alternative use of equity capital on competing unlevered projects/investments of equivalent riskiness.

Note the each of the reasons is structured as a series of comparisons. ?I’ll use a discounted cash flow [DCF] analysis as an example. ?Imagine a simple project requiring an investment of equity capital. ?There is a certain cost, and the risk is enough that you can’t borrow money for financing — it must be funded by equity. ?There are expected after-tax cash flows from the project that you think are a best estimate of returns. ?When would you invest in the project?

I would compare investments versus other similar investments, and look at as many similar projects from a riskiness perspective, and see which investment yielded the best return. ?The second place project as returns go is the alternative project for investment by which the winning project is judged, and surprise, the winning project?has a positive net present value evaluated at the rate of the alternative project.

(An aside: it just hit me that I am recreating part of the learning process that I went through back when I was a TA at UC-Davis 31 years ago, helping teach Corporate Financial Management [CFM], while taking quadratic programming [QP] course at the same time — I ended up doing my QP paper on using QP to choose investments to maximize returns without explicitly calculating internal rates of return, thus quietly solving a problem that the undergrad CFM textbook said could not be done. ?FWIW, which isn’t much.)

Now, I’m waving my hands at what I mean by risk, but to me it is the best estimate of the probability distribution of outcomes, thus giving you estimates of what the likelihood and severity of adverse outcomes could be. ?The thing is, in real life we know these figures poorly at best, but the framework is still useful because the investor making the decision needs to choose the project of a class of projects with roughly the same risk profile. ?Though my initial example included only equity-financed projects, this could be expanded to consider all projects, where the amount of debt on projects affects their risk, and the tax-affected?debt cash flows are?a deduction from returns.

The process would remain the same:?look at as many similar projects from a riskiness perspective, and see which investment yielded the best return on the equity. ?The second place project as returns on the equity go is the alternative project for investment by which the winning project is judged.

Back to Stocks

Where does that leave us as stock investors? ?I subscribe to the “pecking order” theory of the cost of capital, which says that firms use the cheapest form(s) of capital to fund their incremental financing needs, which means they should rarely issue equity.?The exception would be if?they are undertaking a project so large that it would make the company significantly more risky if they were to issue only debt for financing.

We do see companies engaging in buyback activity when they can’t find better uses for slack capital. ?In many cases, there are few large projects begging for the attention of management. ?Buying back stock earns the earnings yield for?the firm. ?Managements buying back stock make the statement that there are no more incremental projects of equivalent risk that would have an unlevered return on equity greater than the earnings yield for the firm.

Now maybe shareholders may have a bigger set of investment choices than the firm does, so perhaps dividends could be a better choice for shareholders, but it will have to be a lot better, because?dividends are taxable.

In general, we want to see management teams be careful users of equity capital, taking note of its cost for the benefit of shareholders. ?Every good management team should have their schedule of possible projects for investment, but always recognize there is the alternative of buying back stock as a last resort. ?In that limited sense, the earnings yield is the cost of equity for the firm, unless big profitable projects beckon.

There’s more to say here, but maybe this is a good start. ?Thoughts?

Possible Bond ETF Problems

Possible Bond ETF Problems

Photo Credit: Penn State

There have been a few parties worrying about crises stemming from ETFs, because they make it too easy for people to sell a lot of assets?in a crisis.

I think that fear is overblown, but I don’t think it is non-existent, and I would like to use a bond ETF as an example of what could be possible.

Most bonds don’t trade every day. ?Only the most liquid bond issues trade every day, and they form the backbone for pricing the bonds that don’t trade.

But how do you price a bond when it doesn’t trade? ?It’s complicated, but let me try to explain…

When a less liquid bond actually has a trade, the bond pricing services take note of it. ?They calculate the yield spread of the less liquid bond versus similar bonds (similar in industry, rating, maturity, currency, domicile, other features) that are liquid, and compare it to:

  • where that yield spread was in the past
  • where the yield spread is relative to other similar?less?liquid bonds that have recently traded
  • where models might imply the yield spread should be, given other securities related to it (stock, preferred stock, junior debt, other bonds in the same securitization, etc.)
  • where investment banks that make a market in the bonds are indicating they would buy or sell.

Now consider that the bond pricing services are doing this for all the bonds they cover every day, and in real time when?the NAVs are made available for ETFs. ?The bond pricing services attempt to create a set of prices for all securities that they cover that is consistent with the market activity in aggregate, adjusting at a reasonable speed to changing market conditions. ?It’s complex, but it allows investors to have a reasonable estimate of the value of their bonds.

(Note: the same thing is done with illiquid stocks as a result of the late trading scandal in mutual funds back in the early 2000s for setting the NAV of mutual funds — ?less liquid?stocks have the same problem in a lesser way than bonds.)

The technical name for this is matrix pricing, which is a bit of a misnomer — multifactor pricing would have been a better name. ?It works pretty well, but it’s not perfect by any means — as an example, you can’t take the calculated price and trade at that level — it is only indicative of where an uncoerced buyer and seller might trade on a normal day. ?It may be a useful guide, though your broker making a market may disagree, which is part of the art of understanding value in the bond markets.

The Possible Problem

Now imagine an ETF with a relatively large amount of less liquid bonds in it, and a market environment where yield spreads are relatively tight, as it is now. ?In such an environment, even the less liquid bonds may have their yield spreads relatively tight?versus their more liquid cousins. ?Now imagine that a relatively violent selloff starts in the bond market over credit issues.

If you were a bond manager at such a time, surprised at the move, but thought it would go further, and you wanted to lighten up on some of your positions, would you try to sell your liquid or less liquid bonds first? ?Most of the time, you would sell the liquid ones, because it is relatively easy to get the trades done. ?If the selloff is bad enough, it will be impossible to sell the less liquid bonds — practically, that market shuts down for a time.

But if there are very few trades of the less liquid bonds, what does the pricing service do? ?Initially, it might rely on the old spread relationships, leaving the less liquid bonds with higher prices than they should have. ?But with enough time, a few trades will transpire, and then the?multifactor models will catch up “all at once” with where the pricing should have been.

For a time, the NAVs would be high relative to where the bonds actually should trade. ?The unit creation/liquidiation process might not catch up with it, because the less liquid bonds are difficult to source, and there is often a cash payment in lieu of the less liquid bonds. ?That cash payment figure could be too high in my scenario, leading to a rush to liquidate by clever investors sensing an arbitrage opportunity.

Now, would this be a catastrophe for the markets as a whole? ?I don’t think so, but some investors could find the NAVs of their bond ETFs move harder than they would expect in a bear market. ?That might cause some to sell more aggressively, but remember, for every seller, there is a buyer. ?Someone outside the ETF processes with a strong balance sheet will be willing to buy when the price is right, because they typically aren’t forced sellers, even in a crisis.

Practical Advice

If you own bond ETFs, know what you own, and how much of the portfolio is less liquid. ?Have a passing familiarity with how the NAV is calculated, and how units get created and liquidated. ?Try to have a sense as to how “jumpy” investors are in the asset sub-class you are investing in, to know whether your fellow investors are likely to chase market momentum. ?They may cause prices of the ETFs to vary considerably versus NAVs if a large number of them take the same action at the same time.

Know yourself and your limits, and be willing to hold or add when others are panicking, and hold or sell when others are too optimistic. ?If you can’t do that, maybe hand it over to a financial advisor who?stays calm when markets are not calm.

Till next time…


Goes Down Double-Speed (Update 2)

Goes Down Double-Speed (Update 2)

2791702123_3a088ec05d_z
Photo Credit: hounddiggity

This is the third time I have written this article during this bull market. ?Here are the other two times, with dates:

The first time, we had doubled since the bottom. ?Second time, up 2.5x. ?Now it is a triple since the bottom. ?That doesn’t happen often, and this rally is getting increasingly unusual by historic standards. ?That said, remember that every time a record gets broken, it shows that the prior maximum was not a limit. ?If you think about that, after a bit you know that idea is obvious, but that isn’t the way that many people practically think about extreme statistics.

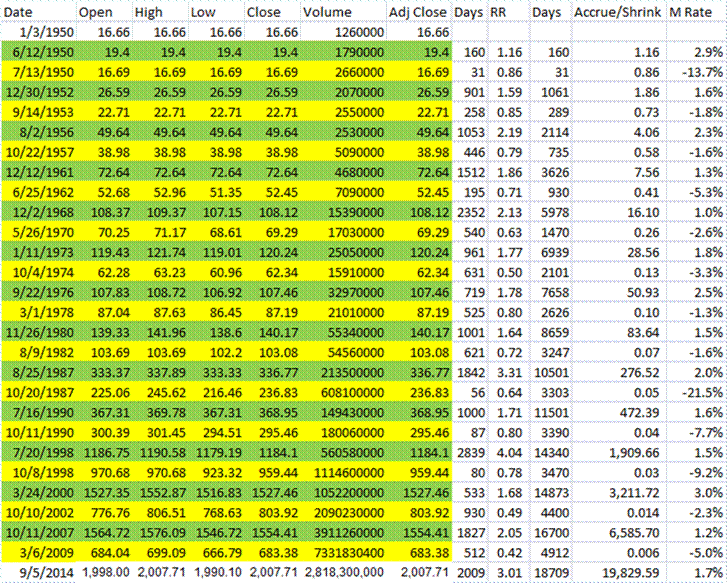
Let’s look at my table, which is the same as the last two times I published, except for the last line:

spx_31294_image002

Since the second?piece, the gains have come slowly and steadily, though faster than between the first and second pieces. ?As I said last time,

In long recoveries, gains first come quickly, then slowly, then near the end they often come quickly again.? Things are coming quickly again now, but who can tell how long it might persist.”

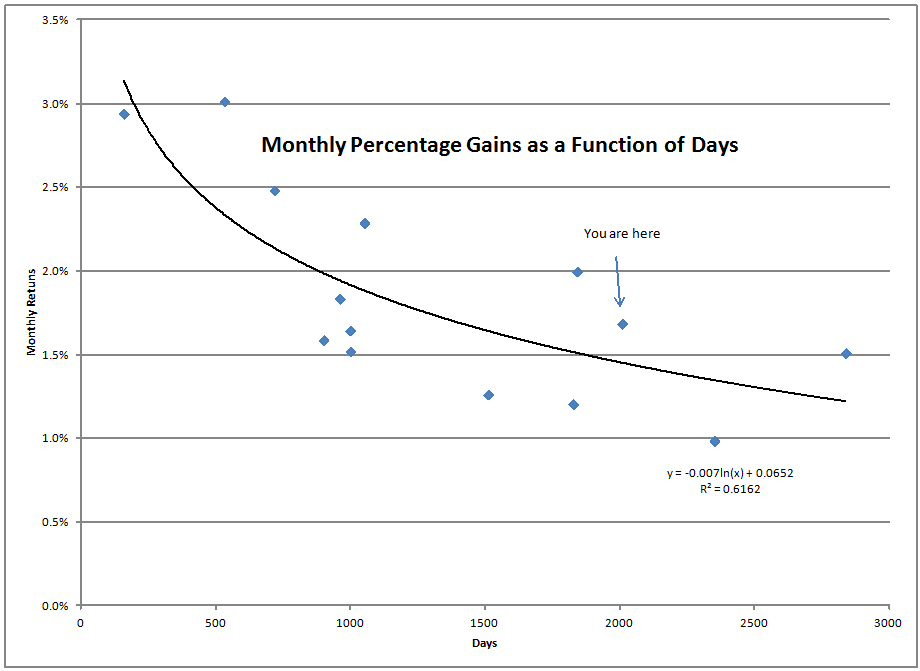
Indeed, and after the first piece, the market did nothing for about 16 months, after which the market started climbing again at a rate of about 1.5% per month for the last 27 months. ?Though not as intense as the rally in the mid-’80s, this is now the third longest rally since 1950, and the third largest. ?It is also the third most intense for rallies lasting 1000 calendar days or more. ?This is a special rally.


spx_8180_image001

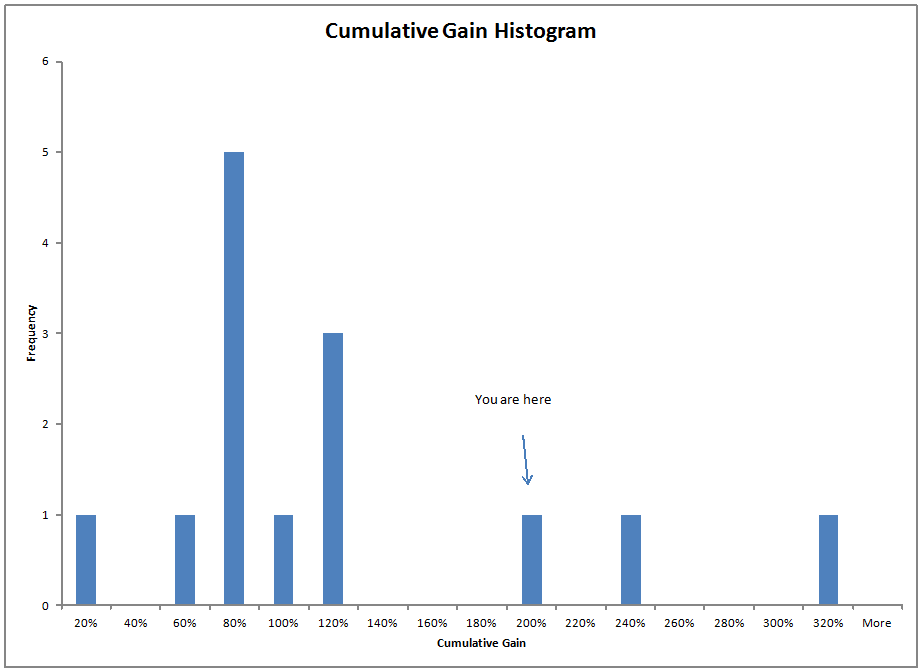
And now look at the cumulative gain:

spx_24509_image001


Does this special rally give us any clues to the future? ?Sadly, no. ?Or maybe, too much. ?Let me spill my thoughts, and you can take them for what they are worth, because I encouraged caution the last two times, and that hasn’t been the winning idea so far.

  1. To top the rally of the ’90s for total size, we would have to see 2700 on the S&P 500.
  2. It is highly unlikely that this rally will top the intensity of that of the ’50s or ’80s. ?Gains from here, if any, are likely to be below the 1.7%/month average so far.
  3. For this rally to set a length record, it would have to last until 12/14/16 (what a date).
  4. Record high profit margins should constrain further growth in the?S&P 500, but that hasn’t worked so far. ?As it is, there are very good reasons for profit margins to be high, because unskilled and semi-skilled labor in the capitalist world is not scarce.
  5. Rallies tend to persist longer when they go at gradual clips of between 1-2%/month. ?Still, all of them eventually die.
  6. At present the market is priced to give 5.5%/year returns over the next 10 years. ?That figure is roughly the 85th percentile of valuations. ?Things are high now, but they have been higher, as in the dot-com bubble. ?We are presently higher than the peak in 2007.
  7. On the negative side, it doesn’t look like the market is pricing in any war risk.
  8. On the positive side, I’m having a hard time finding too many industries that have over-borrowed. ?Governments and US students show moderate?credit risk, as do some industries in the finance and energy sectors.
  9. Finally, the most unusual aspect of this era is how little competition bonds are giving to stocks. ?In my opinion, that idea is getting relied on too heavily for a relative value trade. ?Instead, what we may find is that if bond yields rise, stocks, particularly dividend paying stocks, will get hit. ?By relying on a relative yield judgment for stocks, it places them both subject to the same risks.

I still think that we are on borrowed time, but maybe you need to regard me as a stopped digital clock with a date field, which isn’t even right twice per day. ?Historically, if the rally persists, stock prices should only appreciate at a 8-9% annual rate with the bull this old.

That’s all for now. ?I’m not hedging my equity portfolio yet, but maybe my mind changes near 2300 on the S&P 500, should we get there.

PS — the title comes from the fact that markets move down twice as fast as they go up, so be ready for when the cycle turns. ?The first article in the series focused on that.

On Returns-Based Style Analysis

On Returns-Based Style Analysis

Sometime in the next few weeks, I am going to dig into my pre-2003 [pre-RealMoney] files and see if there is anything there to share with readers. ?Most of my best stories I have already told in my various series. ?The one I will tell tonight I don’t think I have told.

In 1994, we had a problem at Provident Mutual’s Pension Division. ?Our main external equity manager was having a very lousy year as value managers that focused on absolute yield were getting taken to the cleaners. ?This was after a few years of poor performance — the joke was, given the great performance of the past, “Hey, can you develop the 19-year track record?” ?(The last 5 years as a group were horrid, but the previous 14 were great.)

Aside: there aren’t many absolute yield managers in equities today. ?Back when dividend yields were higher, and corporate bond yields were higher, both absolute and relative yield managers flourished as interest rates and dividend yields?crested in the early 1980s, and the stocks paying high dividends got bid up as interest rates fell, much as the same thing happened to zero coupon and other noncallable long duration bonds.

The process started with a call from a manager of managers who proposed that we start up “multiple manger funds,” where we would be the manager of managers.

This offered several advantages:

  • It offered us an easy out with our long-held failing manager, because we are not firing them, just making them a portion of the assets in the value fund.
  • It would make eliminating them easier in a second step, with less PR damage.
  • It would make us look like we were taking action and control in a new way for our clients. (They loved it.)
  • As it was, we did a good job selecting managers, and the funds performed well.
  • We could negotiate lower fees with the managers,
  • It gave us a great marketing story.
  • Our margins and growth improved.

I was critical to the process, being the only member of the team with investment expertise. ?Everyone else was a marketer or the divisional head. ?(I take that back, one member of the marketing area was genuinely sharp with investments.) ?After we chose the managers, I set the allocations.

Now onto tonight’s topic (what a long intro): At the beginning of our relationship with the manager of managers, they did a traditional holdings-based analysis of how a manager managed assets. ?About one year into the process, they introduced returns-based style analysis.

Though the Wikipedia article just cited has a bevy of errors, it will still give you a flavor for what it is. ?Let me give my own explanation:

It takes a lot of effort and wisdom to look at quarterly portfolio snapshots and analyze what a manager is doing. ?You almost have to be as wise as the manager himself to analyze it, but many fund analysts developed the skill.

But returns-based style analysis offered the holy grail: we can understand what the manager is doing simply by comparing the returns of the manager versus returns on ?variety of asset indexes, using constrained multiple regression.

The idea was this: the returns of a manager are equal to his alpha versus a composite index that best fits his performance. ?Since we were dealing with long-only managers, the weights on the index components could not be negative.

The practical upshot to the manager of mangers was: “Whoopee! ?We can analyze every manager under the sun just by looking?at their return patterns. ?No more time-consuming work.”

After the first meeting with the manager of managers, I expressed my doubts, and asked for a special meeting with their quants. ?A week later, I had a meeting with a few members of their staff, of which one was the quant, a nice lady 10 years my junior, who I felt sorry for. ?She started her presentation at a very basic level, and asked “Do you have any questions?” ?I asked, “Isn’t this just an quadratic optimization problem where you are choosing weights on the convex hull?” ?She paused, and said, “Oh, so you *do* understand this.” ?The meeting ended son after that — we agreed on the math, and in math, there is no magic.

But that placed me on the warpath; I genuinely felt the advice we were getting had declined in value. ?I wrote a 16-page report to our manager explaining why returns-based style analysis was inferior.

  • There is no way to correctly estimate error bounds, because of nonlinear constraints. ?(Note: two years later, I guy came up with an approximate way to do it in an article in the Financial Analysts Journal. ?I called him, and we had a great talk. ?That said, approximate is approximate, and I haven’t seen any adopt it.)
  • Because many of the indexes are highly correlated with each other, small differences in manager returns make a huge difference in the weight calculated for each index.
  • If a manager is changing investments because he senses a factor like market cap size or valuation is cheap, it will get interpreted as a change in his index, and will not come out as alpha, but as beta.
  • If I don’t believe that the CAPM and MPT are valid, why should I believe this monstrosity?
  • And more… I hope I find my 16-page paper in my files.

After six more months we terminated the manager of managers, and hired a better one.

  • Lower fees
  • Lower fees from managers (they had greater bargaining power)
  • We reduced our fees to clients
  • Better marketing name
  • Holdings based manager analysis

After that, things were much better, and we continued to grow.

My years at Provident Mutual were exceedingly fruitful — this was just one of many areas where my efforts paid off well.

All that said, there is no way to fix returns-based style analysis. ?It is a bogus concept and needs to be abandoned. ?Those who use it do not grasp the limits of econometrics, and are Sorcerer’s apprentices.

PS — Need I mention that the originator of the idea, Bill Sharpe, is not all that sharp with econometrics? ?He’s a bright guy, but it is not his strong suit.

PPS — there are not many actuaries with a background in econometrics. ?That is why I have written this.

Theme: Overlay by Kaira