Category: Quantitative Methods

Avoid Illiquidity

Avoid Illiquidity

There are several reasons to avoid illiquidity in investing, and some reasons to embrace it. ? Let me go through both:

Embrace Illiquidity

  • You are offered a lot of extra yield for taking on a bond that you can’t easily sell, and where you are convinced that the creditor is impeccable, and there are no sneaky options that you have implicitly sold embedded in the bond to take value away from you.
  • An unusual opportunity arises to invest in a private company that looks a lot better than equivalent public companies and is trading at a bargain valuation with a sound management team.
  • You want income that will last for your lifetime, and so you take some of the money you would otherwise allocate to bonds, and buy a life annuity, giving you some protection against longevity. ?(Warning: inflation and credit risks.)
  • In the past, you bought a Variable Annuity with some good-looking?guarantees. ?The company approaches you to buy out your annuity at a 10-20% premium, or a 20-30% premium if you roll the money into a new variable annuity with guarantees that don’t seem to offer much. ?Either way, turn the insurance company down, and hold onto the existing variable annuity.
  • In all of these situations, you have to treat the money as money lost to present uses. ?If there is any significant probability that you might need the money over the term of the asset, don’t buy the illiquid asset.

Avoid Illiquidity

  • Often the premium yield on an illiquid bond is too low, or the provisions take value away with some level of probability that is easy to underestimate. ?Wall Street does this with structured notes.
  • Why am I the lucky one? ?If you are invited to invest in a private company, be skeptical. ?Do extra due diligence, because unless you bring something more than money to the table (skills, contacts), the odds increase that they are after you for your money.
  • Often the illiquid asset is more risky?than one would suppose. ? I am reminded of the times I was?approached to buy illiquid assets as the lead researcher for a broker-dealer that I served.
  • Then again, those that owned that broker-dealer put all their assets on the line, and ended up losing it all. ?They weren’t young guys with a lot of time to bounce back from the loss. ?They saw the opportunity of a lifetime, and rolled the bones. ?They lost.
  • We tend to underestimate how much we might need liquidity in the future. ?In the mid-2000s people encumbered?their future liquidity by buying houses at inflated prices, and using a lot of debt. ?When everything has to go right, the odds rise that everything will not go right.
  • And yet, there are?two more?more reason to avoid illiquidity — commissions, and inability to know what is going on.

Commissions

Illiquid assets offer the purveyor of the assets the ability to pay a significant commission to their salesmen in order to move the product. ? And by “illiquid” here, I include all financial instruments that carry a surrender charge. ?Do you want to know how much the agent made selling you an insurance product? ?On single-premium products, it is usually very close to the difference between the premium you paid, and the cash surrender value the next day.

Financial companies build their margins into their products, and shave off a portion of them to pay salesmen. ?This not only applies to insurance products, but also mutual funds with loads, private REITs, etc. ?There are many?brokers masquerading as financial advisers, who do not have to?act strictly in the best interests of the client. ?The ability to receive a commission makes them less than neutral in advising, because they can make a lot of money selling commissioned products. ?In general, it is good to avoid buying from commissioned salesmen. ?Rather, do the research, and if you need such a product, try to buy it directly.

Not Knowing What Is Going On

There are some that try to turn a bug into a feature — in this case, some argue that the illiquid asset has no volatility, while its liquid equivalents are more volatile. ?Private REITs are an example here: the asset gets reported at the same price period after period, giving an illusion of stability. ?Public REITs bounce around, but they can be tapped for liquidity easily… brokerage commissions are low. ?Some private REITs take losses and they come as a negative surprise as you find ?large part of your capital missing, and your income reduced.

What I Prefer

In general, I favor liquid investments unless there is a compelling reason to go illiquid. ?I have two private equity investments, both of which are doing very well, but most of my net worth is tied up in my equity investing, which has done well. ?I like the ability to make changes as time goes along; there is value to being able to look forward, and adjust.

No one knows the future, but having some slack capital available to invest, like Buffett with his “elephant gun,” allows for intelligent investing when liquidity is scarce, and yet you have some. ?Many wealthy people run a liquidity “barbell.” ?They have a concentrated interest in one company, and balance that out by holding very safe cash equivalents.

So, in closing, avoid illiquidity, unless you don’t need the money, and the reward is very, very high for making that fixed commitment.

Book Review: The Basics of Financial Econometrics

Book Review: The Basics of Financial Econometrics

FinEconMost of my readers are not going to want to buy this book, because they are not inclined toward math. ?But for those that are math-inclined, I would encourage you not to buy the book. ?Why?

Well, there are much better books on Econometrics out there, that could teach the subject better. ?I can safely say that no Econometrics class would use this book as a text.

Beyond that, the book does not come up with a lot of areas where “this is where you have to be careful in using regression on econometric data.”

I did learn a few things from the chapter on factor analysis, but that is not typically classified as econometrics.

As such, I don’t see any class of people that would benefit from this book.

Quibbles

Already mentioned.

Summary

There is no good audience for this book. ?If you still want the book, you can buy it here:?The Basics of Financial Econometrics: Tools, Concepts, and Asset Management Applications (Frank J. Fabozzi Series).

Full disclosure: The publisher asked me if I would like a copy and I said yes.

If you enter Amazon through my site, and you buy anything, I get a small commission.? This is my main source of blog revenue.? I prefer this to a ?tip jar? because I want you to get something you want, rather than merely giving me a tip.? Book reviews take time, particularly with the reading, which most book reviewers don?t do in full, and I typically do. (When I don?t, I mention that I scanned the book.? Also, I never use the data that the PR flacks send out.)

Most people buying at Amazon do not enter via a referring website.? Thus Amazon builds an extra 1-3% into the prices to all buyers to compensate for the commissions given to the minority that come through referring sites.? Whether you buy at Amazon directly or enter via my site, your prices don?t change.

Book Review: What’s Behind the Numbers?

Book Review: What’s Behind the Numbers?

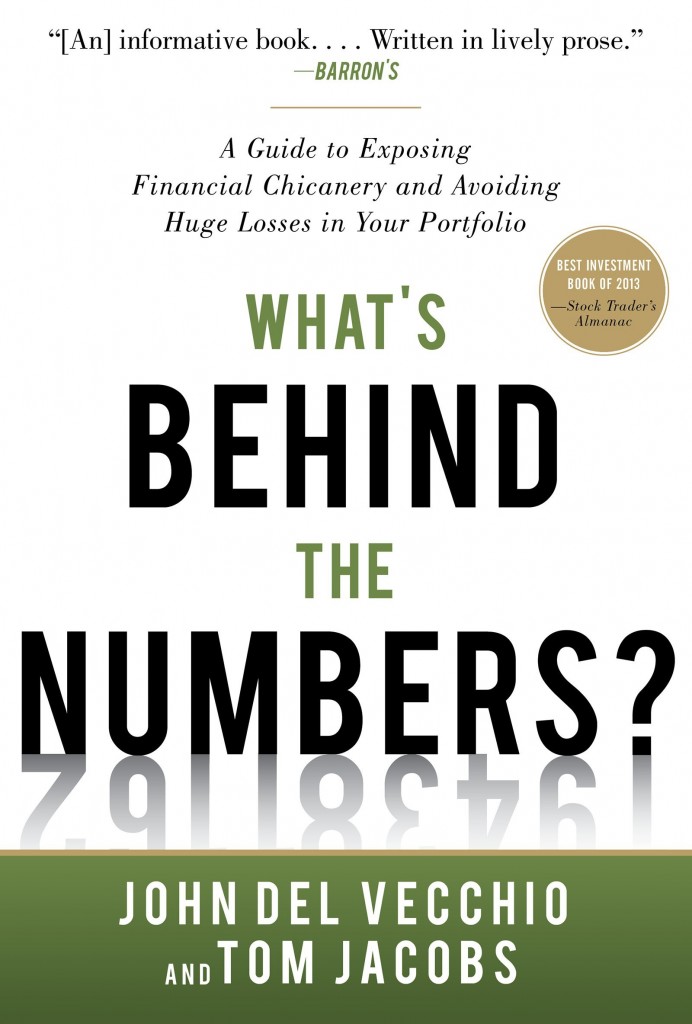
71zM0CNU4QL This is an ambitious book. ?It tries to draw together financial statement analysis, value investing, short-selling, technical analysis, market timing, and portfolio management into one slim book of 254 pages.

It spends the most time on financial statement analysis, going over revenue recognition, inventories, and all of the squishier areas of accounting that?most industrial companies face. ?It will not help you much with financial companies, they are far more complex, and deserve a book all their own.

I was surprised that the book did not suggest common summary measures of accounting quality, such as Normalized Operating Accruals. ?It did feature Cash Flow from Operations less Net Income, which is almost as good.

The book focuses on the short side — how do you make money from failure? ?The long side suggests maxing out on small cap value stocks, and idea which ?I like, but can get overfished at times.

Think of it this way: do you want to run a portfolio that is systematically short company size, long value, short liquidity, long quality, etc? ?I helped do that for 4.5 years at a hedge fund, and boy that ride was bumpy. ?The market can remain insane longer than you can remain solvent.

But, to the book’s credit, it understands position sizing for short positions, which is momentum following. ?Short more of things that fall. ?Do not add to shorts when the prices rise. ?This is a key insight of the book, and it is a reason why value managers often?don’t do well in a long-short context.

My last complaint is that the book does not explain even in broad terms how they balance the various?portfolio management ideas. ?If you buy this book, you are on your own. ?You do not ?have a full roadmap to guide you. ?If you were going to use this as a main strategy, you would have to fill in a lot of holes.

Now, I’m often critical of turn-the-crank books — follow my rules, and you will make money. ?But I am more critical of almost turn-the-crank books — follow my rules, and you still won’t know exactly what to do.

Is this a good book? ?Yes. ?Read it and you will learn a lot. ?Will it help you analyze stocks? ?Also yes. ?You can make a lot more money by avoiding stocks with a high probability of losing money. ?Will it tell you exactly what to do? ?No. ?That is a strength and a weakness — I’m not sure any book on investing that offers a formula can be exact, and be good. ?Investing is an art, not a science. ?Then again, science is an art, not a science, but that’s another topic — all the great discoveries come from not following the scientific method.

So if you want to learn, this is a good book. ?If you want a foolproof way to make money, sorry, this won’t do it for you, and the same for almost every other investment book.

Quibbles

There are far better books on all of the topics that they cover, and most of them have been reviewed at my blog. ?Far better to read books that specialize on a single topic, than one that is a hodgepodge.

Summary

This is a good book, but average investors should not buy it as a formula, because they can?t implement it. ?Average investors could benefit from the book, because it gives them a taste of a wide number of investing topics. ?Just be aware that you aren’t getting a full dose of anything. ?If you still want that, you can buy it here:?What’s Behind the Numbers?: A Guide to Exposing Financial Chicanery and Avoiding Huge Losses in Your Portfolio.

Full disclosure:?I borrowed this book via Interlibrary Loan. ?It is going back tomorrow, and I will not buy a copy to replace it.

If you enter Amazon through my site, and you buy anything, I get a small commission.? This is my main source of blog revenue.? I prefer this to a ?tip jar? because I want you to get something you want, rather than merely giving me a tip.? Book reviews take time, particularly with the reading, which most book reviewers don?t do in full, and I typically do. (When I don?t, I mention that I scanned the book.? Also, I never use the data that the PR flacks send out.)

Most people buying at Amazon do not enter via a referring website.? Thus Amazon builds an extra 1-3% into the prices to all buyers to compensate for the commissions given to the minority that come through referring sites.? Whether you buy at Amazon directly or enter via my site, your prices don?t change.

Industry Ranks May 2014

Industry Ranks May 2014

Industry Ranks 6_1521_image002

My main industry model is illustrated in the graphic. Green industries are cold. Red industries are hot. If you like to play momentum, look at the red zone, and ask the question, ?Where are trends under-discounted?? Price momentum tends to persist, but look for areas where it might be even better in the near term.

If you are a value player, look at the green zone, and ask where trends are over-discounted. Yes, things are bad, but are they all that bad? Perhaps the is room for mean reversion.

My candidates from both categories are in the column labeled ?Dig through.?

You might notice that I have no industries from the red zone. That is because the market is so high. I only want to play in cold industries. They won?t get so badly hit in a decline, and they might have some positive surprises.

If you use any of this, choose what you use off of your own trading style. If you trade frequently, stay in the red zone. Trading infrequently, play in the green zone ? don?t look for momentum, look for mean reversion. I generally play in the green zone because I hold stocks for 3 years on average.

Whatever you do, be consistent in your methods regarding momentum/mean-reversion, and only change methods if your current method is working well.

Huh? Why change if things are working well? I?m not saying to change if things are working well. I?m saying don?t change if things are working badly. Price momentum and mean-reversion are cyclical, and we tend to make changes at the worst possible moments, just before the pattern changes. Maximum pain drives changes for most people, which is why average investors don?t make much money.

Maximum pleasure when things are going right leaves investors fat, dumb, and happy ? no one thinks of changing then. This is why a disciplined approach that forces changes on a portfolio is useful, as I do 3-4 times a year. It forces me to be bloodless and sell stocks with less potential for those with more potential over the next 1-5 years.

I like some technology stocks here, some industrials, some retail?stocks, particularly those that are strongly capitalized.

I?m looking for undervalued industries. I?m not saying that there is always a bull market out there, and I will find it for you. But there are places that are relatively better, and I have done relatively well in finding them.

At present, I am trying to be defensive. I don?t have a lot of faith in the market as a whole, so I am biased toward the green zone, looking for mean-reversion, rather than momentum persisting. The red zone is pretty cyclical at present. I will be very happy hanging out in dull stocks for a while.

That said, some dull companies are fetching some pricey valuations these days, particularly those with above average dividends. This is an overbought area of the market, and it is just a matter of time before the flight to relative safety reverses.

The Red Zone has a Lot of Financials; be wary of those. I have been paring back my reinsurers, but I have been adding to P&C insurers. What I find fascinating about the red momentum zone now, is that it is loaded with cyclical companies.

In the green zone, I picked almost all of the industries. If the companies are sufficiently well-capitalized, and the valuation is low, it can still be an rewarding place to do due diligence.

Will cyclical companies continue to do well? Will the economy continue to limp along, or might it be better or worse?

But what would the model suggest?

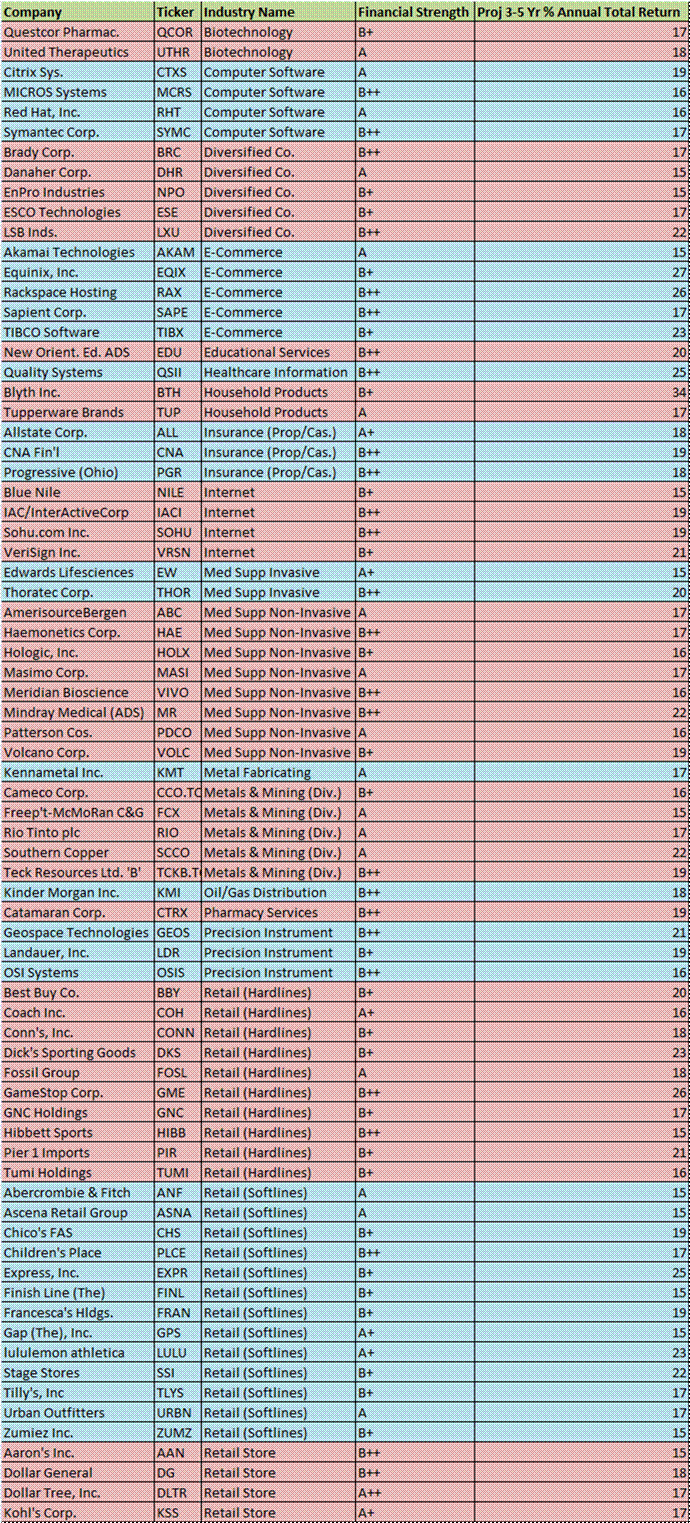
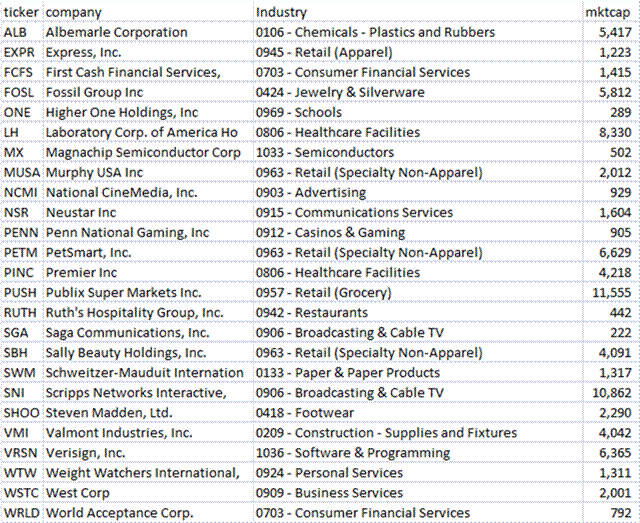
Ah, there I have something for you, and so long as Value Line does not object, I will provide that for you. I looked for companies in the industries listed, but in the top 5 of 9 balance sheet safety categories, and with returns estimated over 12%/year over the next 3-5 years. The latter category does the value/growth tradeoff automatically. I don?t care if returns come from mean reversion or growth.

But anyway, as a bonus here are the names that are candidates for purchase given this screen. Remember, this is a launching pad for due diligence, not hot names to buy.

I’ve tightened my criteria a little because the number of stocks passing last quarter’s screen was much higher, which was likely an artifact of earnings expectations rolling forward another year.

Anyway, enjoy the list of purchase candidates — I know that I will:

Industry Ranks 6_19997_image002

Full Disclosure: long SYMC

Book Review: The 52-Week Low Formula

Book Review: The 52-Week Low Formula

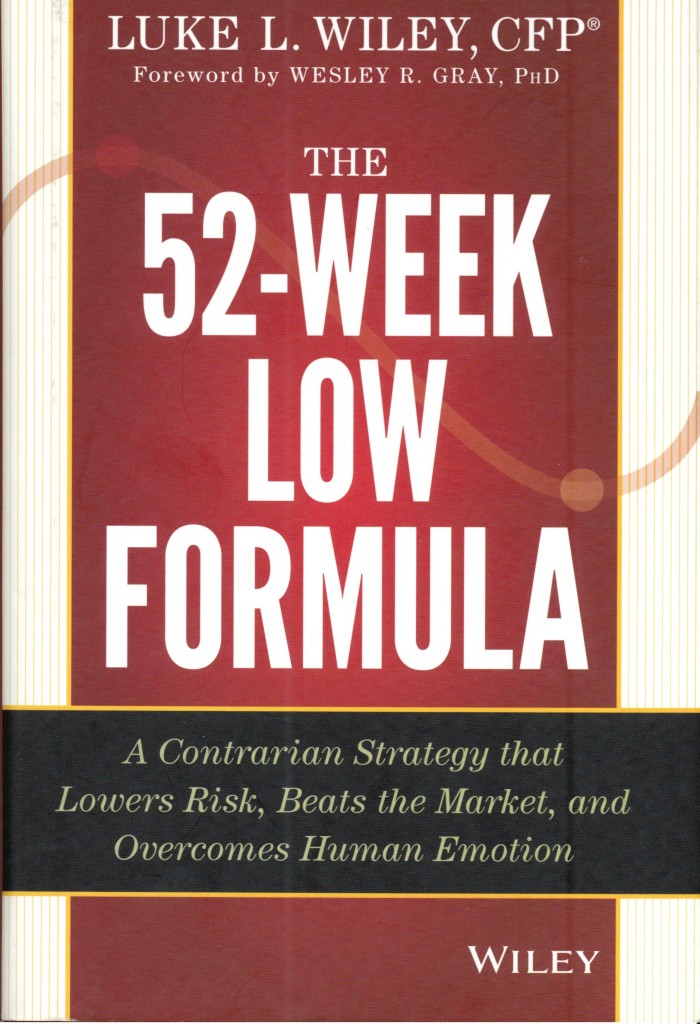
52wk I usually don’t like reviewing books that say, “Follow this formula, and you will make lotsa money. ?Thus it was with some hesitance that I requested this book. ?I did it partly off of Tweedy, Browne’s study, which is aptly titled, “What Has Worked in Investing.” ?For those reading at Amazon, Google “Tweedy Browne What has Worked” for the link. ?Stocks that hit new 52-week lows on average are ready to rebound. ?So why don’t people buy them?

Are you kidding? ?Look at that chart! ?Do you really want to catch a falling knife?! ?You want to throw good money after bad!? ?Why do you want to buy that dog, anyway…

Shhh. ?The competition is gone. ?There are no friends of failure. ?But made some companies get unfairly tarred as losers, when it is simply a good company that made a few mistakes.

That is the idea behind this book. ?Analyze companies from which?most market players ?have fled. ?Look for those with ?the following characteristics:

  1. They must have a durable competitive advantage.
  2. They must must a strong free cash flow yield.
  3. They must have a return on invested capital that exceeds the cost of that capital.
  4. They must not have too much debt relative to free cash flow.

I Had Troubles Getting to Solla Sollew

But here’s the big problem, and advantage, of the book. ?He does not give you the “secret sauce.” ?He gives you the principles. ?Indeed he can’t give a formula, because many of his criteria don’t admit an easy formula. ?You can’t calculate free cash flow from looking at GAAP accounting — you would need to know what portion of capital expenditure is to maintain existing assets, and that is nowhere disclosed. ?Typically, when you see free cash flow in screening software, all capital expenditure is deducted from cash flow from operations, producing too conservative of a figure.

Thus we can’t replicate points 2 & 4. ?What about 1 & 3? ?Companies do not comes with tags saying “Durable Competitive Advantage” and “No Durable Competitive Advantage.” ?That is a judgment call. ?You could use Morningstar’s Moat Ratings, or Gross Margins as a fraction of assets. ?The author does not give explicit guidance. ?As to point 3, the main problem is that we don’t know what a company’s cost of capital is. ?There are a lot of assumptions lying behind that, and they matter a great deal.

The easiest?of his five criteria to calculate is the price vs the 52-week low. ?Still, he doesn’t give us a threshold.

So What Good is This Book?!

Unless you are an expert, not much good, unless you simply want to play the 52-week low anomaly. ?That said, actionable strategy would be to review the 52-week lows, and analyze companies with low debt and high past profitability that seem to have a franchise that is not easily attacked. ?I think the theory is solid. ?That said, it does no give a lot of the details, not that most readers would understand it if they did.

This book is good, in that it is realistic. ?Though not explicit, it informs you that it is very difficult to choose superior stocks, and it it does not give you a cut-and-dried method.

So If You Can’t Do It Yourself, Then What Is This Book?!

Though the disclosure at the end says otherwise, this book is an advertisement for the author’s method of money management. ?In none of his five criteria does he get sharp. ?The general principles are correct, but you aren’t given the tools to use them. ?That means if you want to use them, you must go through the author.

Verification

They have a website –?52weeklow.com, but it is not laden with data as the book intimates, as of the day that I write this. ?That would be worth seeing.

Quibbles

On pages 74-75 he gives a strained view of margin of safety,?comparing free cash flow yields to the 10-year Treasury yield. ?Margin of safety is more of a balance sheet construct, asking how likely is is that a company will get into financial stress. ?What he is actually measuring here is valuation. ?What he is doing is not wrong, but it is mislabeled. ?Also remember, you can estimate free cash flow, but you never know for sure.

Also, as mentioned before, we have no idea of what his thresholds are and how he actually implements the strategy.

Thus after this article are two attempts to work out the strategy. ?What should not be surprising is that there are no companies on both lists.

Summary

This is a good book, but average investors should not buy it, because they can’t implement it.??If you still want that, you can buy it here:?The 52-Week Low Formula: A Contrarian Strategy that Lowers Risk, Beats the Market, and Overcomes Human Emotion.

Full disclosure: The PR flack asked me if I wanted the book, and I said “yes.”

If you enter Amazon through my site, and you buy anything, I get a small commission.? This is my main source of blog revenue.? I prefer this to a ?tip jar? because I want you to get something you want, rather than merely giving me a tip.? Book reviews take time, particularly with the reading, which most book reviewers don?t do in full, and I typically do. (When I don?t, I mention that I scanned the book.? Also, I never use the data that the PR flacks send out.)

Most people buying at Amazon do not enter via a referring website.? Thus Amazon builds an extra 1-3% into the prices to all buyers to compensate for the commissions given to the minority that come through referring sites.? Whether you buy at Amazon directly or enter via my site, your prices don?t change.

Application Attempt One

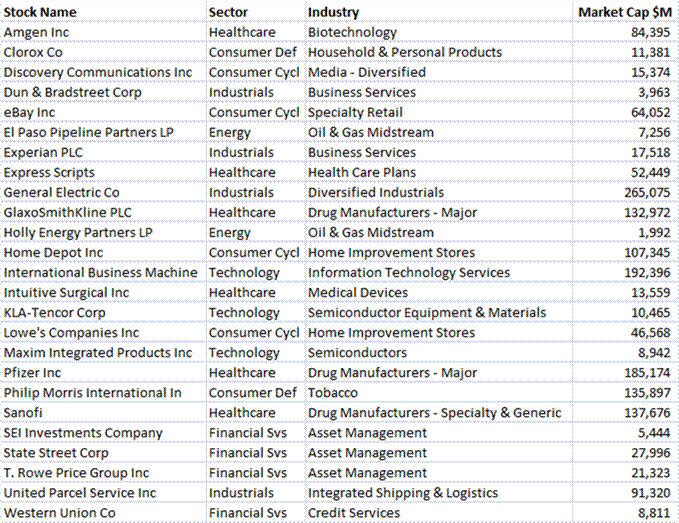
These were the companies selected — Morningstar Wide Moat, 5% Free Cash Flow Yield, Less than 20% above the 52-week low.

one

And here is the second try: Gross margins as a ratio of Assets over 13%, free cash flow yield over 5%, Long-term debt as a ratio of free cash flow greater than five,?less than 20% above the 52-week low.

two

Not one alike on the two lists. ?Tells you that his book would be very difficult to implement. ?*I* don’t know how I would implement it.

An Alternative to the Efficient Markets Hypothesis

An Alternative to the Efficient Markets Hypothesis

I read an article today, The Fallibility of the Efficient Market?Theory: A New Paradigm.?? Good article, made me look through a major article cited:?An Institutional Theory of Momentum and Reversal.

The former article explains in basic terms what the authors have illustrated. ?The latter article, provides all of the complex math. ?I get 50%+ of ?it, and I think it is right. ?This explains value, momentum, and mean-reversion, the largest anomalies that trouble the?Efficient Markets Hypothesis.

This article deserves more attention from quants and academics. ?The only thing that troubles me about it is that they assume a normal distribution for security returns.

Have a read, and for those that can understand the math, if you disagree with it, let me know.

Yet Another Letter from a Reader

Yet Another Letter from a Reader

I get a lot of interesting letters — here is another one:

First, let me say how much I appreciate your blog. I started my career in sellside research covering life insurers (after interning in insurance M&A). Your posts on insurance investing were invaluable in developing my understanding of the industry. My superiors did not have time to teach me the basics – I would have had a hard time getting started without your blog.?

?I’m now in equity research at a large mutual fund company, also covering insurers (and asset managers). However, I do not have an actuarial background. So I am very interested in why you think financial & mortgage insurers don’t have an actuarially sound business models.?

?And as a former life insurance analyst, I am curious what aspect of life insurance reserving you view as liberal – I’m guessing secondary guarantees on VAs??

?Finally, to digress, do you have any views on medical malpractice insurance? I’ve been looking at PRA, and find it pretty compelling at first glance: massive excess capital, consistently conservative and profitable underwriting, and a relatively reasonable valuation. 90% of policies are claims made. There are headwinds: Obamacare, the reserve releases from mid-2000s accident years rolling off, and a diversifying business model (although PRA has historically proven competent at M&A). My only concerns are management continuing to underwrite at too low a level (currently writing at 0.32x NPW / Equity; regulators would be fine with up to 1.0x), and potentially squandering that capital.?

In the interest of full disclosure, I own no insurance stocks personally for compliance reasons.

Thanks for writing. ?Let’s start with mortgage and financial insurance. ?It’s not that there isn’t a good way to calculate the risk (in most cases), it is that they do not choose to use those models. ?The regulators do not subscribe to contingent claims theory. ?They do not look at default as an option, even if it is not efficiently exercised. ?They should use those models, and assume efficient execution of default risk.

Even if they use approximations, the recent crisis should have forced reserves higher for mortgage credit, and other credit exposures.

Credit and mortgage insurers are bull market stocks. ?When I was a bond manager, I sold away my few financial insurer bonds from MBIA and Ambac, and avoided the mortgage insurers. ?The possibility of default was far higher than he market believed.

With respect to Life Insurers, it is secondary guarantees of all sorts, especially with variable products. ?Options that have a long duration are hard to price. ?Options?that have a long duration, and involve significant contingencies where insureds may make choice hurting the insurer are impossible to price.

On Medmal, I have always liked PRA, but it has never been cheap enough for me to buy it. ?Always thought they were the best of the pure plays. ?They have survived many other companies by their clever management. ?I would not begrudge them their conservatism, Medmal is volatile, and it pays to be conservative in volatile businesses.

The Rules, Part LVIII

The Rules, Part LVIII

Can contingent claims theory for bond defaults be done on a cash flow/liquidity basis?? KMV-type models seem to fail on severely distressed bonds that have time to breathe and repair.

We’re getting close to the end of this series, and I am scraping the bottom of the barrel. ?As with most aspects of life, the best things get done first. ?After that diminishing marginal returns kick in.

Here’s the issue. ?It’s possible to model credit risk as a put option that the bondholders have sold to the stockholders. ?As such, equity implied volatility helps inform us as to how likely default will be. ?But implied volatilities are only available for at most two years out, because they don’t commonly trade options longer than that.

Here’s the scenario that I posit: there is a company in lousy shape that looks like a certain bankruptcy candidate, except that there are no significant events requiring liquidity for 3-5 years. ?In a case like this, the exercise date of the option to default is so far out, that the company can probably find ways to avoid bankruptcy, but the math may make it look unavoidable. ?Remember, the equity has the option to default, but they also control the company until they do default. ?Being the equity is valuable, because you control the assets.

Bankruptcy means choking on cash flows out that can’t be made. ?Ordinarily, that happens because of interest payments that can’t be made, rather than repayment of principal. ?If interest payments can be made, typically principal payments can be refinanced, unless credit gets tight.

The raw math of the contingent claims models do not take account of the clever distressed company manager who finds a way to avoid bankruptcy, driving deals to avoid it. ?The more time he has, the more clever he can be.

This is a reason why I distrust simple mathematical models in investing. ?The world is more complex than the math will admit. ?So be careful applying math to markets. ?Think through what the assumptions and models mean, because they may not reflect how people actually work.


On Finding Neglected Companies

On Finding Neglected Companies

While at RealMoney, I wrote a short series on data-mining. ?Copies of the articles are here: (one, two). I enjoyed writing them, and the most pleasant surprise was the favorable email from readers and fellow columnists. As a follow up, on April 13th, 2005, I wrote an article on analyst coverage — and neglect. Today, I am writing the same article but as of today, with even more detail, and comparisons to prior analyses.

As it was, in my Finacorp years, I wrote a similar piece to this but it has been lost; I can?t find a copy of it, and Finacorp is in the ash-heap of financial firms. (Big heap, that.)

For a variety of reasons, sell-side analysts do not cover companies and sectors evenly. For one, they have biases that are related to how the sell-side analyst’s employer makes money. It is my contention that companies with less analyst coverage than would be expected offer an opportunity to profit for investors who are willing to sit down and analyze these lesser-analyzed companies and sectors.

I am a quantitative analyst, but I try to be intellectually honest about my models and not demand more from them than they can deliver. That’s why I have relatively few useful models, maybe a dozen or so, when there are hundreds of models used by quantitative analysts in the aggregate.


Why do I use so few? Many quantitative analysts re-analyze (torture) their data too many times, until they find a relationship that fits well. These same analysts then get surprised when the model doesn’t work when applied to the real markets, because of the calculated relationship being a statistical accident, or because of other forms of implementation shortfall — bid-ask spreads, market impact, commissions, etc.

This is one of the main reasons I tend not to trust most of the “advanced” quantitative research coming out of the sell side. Aside from torturing the data until it will confess to anything (re-analyzing), many sell-side quantitative analysts don’t appreciate the statistical limitations of the models they use. For instance, ordinary least squares regression is used properly less than 20% of the time in sell-side research, in my opinion.


Sell-side firms make money two ways.They can make via executing trades, so volume is a proxy for profitability.They can make money by helping companies raise capital, and they won?t hire firms that don?t cover them.Thus another proxy for profitability is market capitalization.


Thus trading volume and market capitalization are major factors influencing analyst coverage. Aside from that, I found that the sector a company belongs to has an effect on the number of analysts covering it.


I limited my inquiry to include companies that had a market capitalization of over $10 million, US companies only, and no ETFs.


I used ordinary least squares regression covering a data set of 4,604 companies. The regression explained 82% of the variation in analyst coverage. Each of the Volume and market cap variables used were significantly different from zero at probabilities of less than one in one million. As for the sector variables, they were statistically significant as a group, but not individually.Here’s a list of the variables:


Variable

?Coefficients

?Standard Error

?t-Statistic

?Logarithm of 3-month average volume

?0.57

0.04

?15.12

?Logarithm of Market Capitalization

?(2.22)

0.15

(14.69)

?Logarithm of Market Capitalization, squared

?0.36

0.01

?31.42

?Basic Materials

?(0.53)

0.53

?(1.01)

?Capital Goods

?0.39

0.54

?0.74

?Conglomerates

?(0.70)

1.95

?(0.36)

?Consumer Cyclical

?0.08

0.55

?0.14

?Consumer Non-Cyclical

?(1.40)

0.55

?(2.52)

?Energy

?2.56

0.53

?4.87

?Financial

?0.37

0.48

?0.78

?Health Care

?0.05

0.50

?0.11

?Services

?(0.30)

0.49

?(0.61)

?Technology

?0.82

0.49

?1.67

?Transportation

?2.92

0.66

?4.40

?Utilities

?(1.10)

0.60

?(1.82)


In short, the variables that I used contained data on market capitalization, volume and market sector.

An increasing market capitalization tends to attract more analysts. At a market cap of $522 million, market capitalization as a factor adds no net analysts. At the highest market cap in my study, Apple [AAPL] at $469 billion, the model indicates that 11 fewer analysts should cover the company. The smallest companies in my study would have 3.3 fewer analysts as compared with a company with a market cap of $522 million.


Market Cap

?Analyst additions

?10.00

?2.30

?30.00

?3.40

100.00

?4.61

300.00

?5.70

522.20

?6.26

?1,000.00

?6.91

?3,000.00

?8.01

10,000.00

?9.21

30,000.00

?10.31

100,000.00

?11.51

300,000.00

?12.61

469,400.30

?13.06


The intuitive reasoning behind this is that larger companies do more capital markets transactions. Capital markets transactions are highly profitable for investment banks, so they have analysts cover large companies in the hope that when a company floats more stock or debt, or engages in a merger or acquisition, the company will use that investment bank for the transaction.


Investment banks also make some money from trading. Access to sell-side research is sometimes limited to those who do enough commission volume with the investment bank. It’s not surprising that companies with high amounts of turnover in their shares have more analysts covering them. The following table gives a feel for how many additional analysts cover a company relative to its daily trading volume. A simple rule of thumb is that (on average) as trading volume quintuples, a firm gains an additional analyst, and when trading volume falls by 80%, it loses an analyst.


Daily Trading Volume (3 mo avg)

Analyst Additions

3 0.6
10 1.3
30 1.9
100 2.6
300 3.2
1,000 3.9
3,000 4.5
10,000 5.2
30,000 5.8
100,000 6.5
300,000 7.1
1,000,000 7.8
3,000,000 8.4
4,660,440 8.7


An additional bit of the intuition for why increased trading volume attracts more analysts is that volume is in one sense a measure of disagreement. Investors disagree about the value of a stock, so one buys what another sells. Sell-side analysts note this as well; stocks with high trading volumes relative to their market capitalizations are controversial stocks, and analysts often want to make their reputation by getting the analysis of a controversial stock right. Or they just might feel forced to cover the stock because it would look funny to omit a controversial company.

Analyst Neglect

The first two variables that I considered, market capitalization and volume, have intuitive stories behind them as to why the level of analysts ordinarily varies. But analyst coverage also varies by industry sector, and the reasons are less intuitive to me there.


Please note that my regression had no constant term, so the constant got embedded in the industry factors. Using the Transportation sector as a benchmark makes the analysis easier to explain. Here’s an example: On average, a Utilities company that has the same market cap and trading volume as a Transportation company would attract four fewer analysts.


Sector ?Addl Analysts ?Fewer than Transports
?Transportation ?2.92
?Energy ?2.56 ?(0.37)
?Technology ?0.82 ?(2.10)
?Capital Goods ?0.39 ?(2.53)
?Financial ?0.37 ?(2.55)
?Consumer Cyclical ?0.08 ?(2.84)
?Health Care ?0.05 ?(2.87)
?Services ?(0.30) ?(3.22)
?Basic Materials ?(0.53) ?(3.46)
?Conglomerates ?(0.70) ?(3.63)
?Utilities ?(1.10) ?(4.02)
?Consumer Non-Cyclical ?(1.40) ?(4.32)


Why is that? I can think of two reasons. First, the companies in the sectors at the top of my table are perceived to have better growth prospects than those at the bottom. Second, the sectors at the top of the table are more volatile than those toward the bottom (though basic materials would argue against that). As an aside, companies in the conglomerates sector get less coverage because they are hard for a specialist analyst to understand.


My summary reason is that “cooler” sectors attract more analysts than duller sectors. To the extent that this is the common factor behind the variation of analyst coverage across sectors, I would argue that sectors toward the bottom of the list are unfairly neglected by analysts and may offer better opportunities for individual investors to profit through analysis of undercovered companies in those sectors.

Malign Neglect

Now, my model did not explain 100% of the variation in analyst coverage. It explained 82%, which leaves 18% unexplained. Some of the unexplained variation is due to the fact that no model can be perfect. But the unexplained variation can be used to reveal the companies that my model predicted most poorly. Why is that useful? If my model approximates “the way the world should be,” then the degree of under- and over-coverage by analysts will reveal where too many or few analysts are looking. The following tables lists the largest company variations between reality and my model, split by market cap group.


Behemoth Stocks

?

Ticker Company Sector Excess analysts
BRK.A Berkshire Hathaway Inc. 07 – Financial (25.75)
GE General Electric Company 02 – Capital Goods (20.47)
XOM Exxon Mobil Corporation 06 – Energy (19.32)
CVX Chevron Corporation 06 – Energy (14.64)
PFE Pfizer Inc. 08 – Health Care (14.57)
MRK Merck & Co., Inc. 08 – Health Care (12.76)
GOOG Google Inc 10 – Technology (11.44)
JNJ Johnson & Johnson 08 – Health Care (11.39)
MSFT Microsoft Corporation 10 – Technology (10.39)
PM Philip Morris International In 05 – Consumer Non-Cyclical (10.21)

?

Too many

?

Ticker Company Sector Excess analysts
V Visa Inc 09 – Services ?2.58
DIS Walt Disney Company, The 09 – Services ?2.95
SLB Schlumberger Limited. 06 – Energy ?4.15
CSCO Cisco Systems, Inc. 10 – Technology ?5.22
QCOM QUALCOMM, Inc. 10 – Technology ?5.34
ORCL Oracle Corporation 10 – Technology ?5.98
FB Facebook Inc 10 – Technology ?8.28
AMZN Amazon.com, Inc. 09 – Services ?9.34
AAPL Apple Inc. 10 – Technology ?10.57
INTC Intel Corporation 10 – Technology ?11.85

?

Large Cap Stocks

?

Ticker Company Sector Excess analysts
SPG Simon Property Group Inc 09 – Services (16.15)
BF.B Brown-Forman Corporation 05 – Consumer Non-Cyclical (16.03)
LUK Leucadia National Corp. 07 – Financial (15.93)
L Loews Corporation 07 – Financial (15.90)
EQR Equity Residential 09 – Services (15.87)
ARCP American Realty Capital Proper 09 – Services (15.75)
IEP Icahn Enterprises LP 09 – Services (15.50)
LVNTA Liberty Interactive (Ventures 09 – Services (15.36)
ABBV AbbVie Inc 08 – Health Care (15.01)
GOM CL Ally Financial Inc 07 – Financial (14.87)

?

Too Many

?

Ticker Company Sector Excess analysts
UA Under Armour Inc 04 – Consumer Cyclical ?16.68
BRCM Broadcom Corporation 10 – Technology ?17.29
RRC Range Resources Corp. 06 – Energy ?17.33
SWN Southwestern Energy Company 06 – Energy ?17.70
RHT Red Hat Inc 10 – Technology ?18.08
NTAP NetApp Inc. 10 – Technology ?19.82
CTXS Citrix Systems, Inc. 10 – Technology ?19.84
COH Coach, Inc. 09 – Services ?20.87
VMW VMware, Inc. 10 – Technology ?21.60
CRM salesforce.com, inc. 10 – Technology ?22.64

?

Mid cap stocks

?

Ticker Company Sector Excess analysts
FNMA Federal National Mortgage Assc 07 – Financial (13.84)
UHAL AMERCO 11 – Transportation (12.23)
O Realty Income Corp 09 – Services (12.06)
CIM Chimera Investment Corporation 07 – Financial (11.49)
SLG SL Green Realty Corp 09 – Services (11.46)
NRF Northstar Realty Finance Corp. 09 – Services (11.34)
FMCC Federal Home Loan Mortgage Cor 07 – Financial (11.14)
EXR Extra Space Storage, Inc. 11 – Transportation (10.97)
KMR Kinder Morgan Management, LLC 06 – Energy (10.94)
CWH CommonWealth REIT 09 – Services (10.51)

?

Too Many

?

Ticker Company Sector Excess analysts
AEO American Eagle Outfitters 09 – Services ?17.00
DRI Darden Restaurants, Inc. 09 – Services ?17.40
RVBD Riverbed Technology, Inc. 10 – Technology ?17.50
CMA Comerica Incorporated 07 – Financial ?17.74
GPN Global Payments Inc 07 – Financial ?18.30
WLL Whiting Petroleum Corp 06 – Energy ?19.67
DO Diamond Offshore Drilling Inc 06 – Energy ?21.57
URBN Urban Outfitters, Inc. 09 – Services ?24.06
RDC Rowan Companies PLC 06 – Energy ?24.48
ANF Abercrombie & Fitch Co. 09 – Services ?26.02

?


Small cap stocks


Ticker Company Sector Excess analysts
BALT Baltic Trading Ltd 11 – Transportation ?(7.96)
ERA Era Group Inc 11 – Transportation ?(7.45)
PBT Permian Basin Royalty Trust 06 – Energy ?(7.42)
SDR SandRidge Mississippian Trust 06 – Energy ?(7.18)
PHOT Growlife Inc 02 – Capital Goods ?(6.79)
SBR Sabine Royalty Trust 06 – Energy ?(6.74)
CAK CAMAC Energy Inc 06 – Energy ?(6.64)
FITX Creative Edge Nutrition Inc 09 – Services ?(6.57)
BLTA Baltia Air Lines Inc 11 – Transportation ?(6.53)
VHC VirnetX Holding Corporation 10 – Technology ?(6.49)


Too many


Ticker Company Sector Excess analysts
WLT Walter Energy, Inc. 06 – Energy ?12.19
ANGI Angie’s List Inc 10 – Technology ?12.31
FRAN Francesca’s Holdings Corp 09 – Services ?12.58
ZUMZ Zumiez Inc. 09 – Services ?13.49
GDP Goodrich Petroleum Corp 06 – Energy ?15.02
DNDN Dendreon Corporation 08 – Health Care ?15.89
ACI Arch Coal Inc 06 – Energy ?16.04
HERO Hercules Offshore, Inc. 06 – Energy ?16.19
AREX Approach Resources Inc. 06 – Energy ?17.64
ARO Aeropostale Inc 09 – Services ?20.80


Microcap Stocks


Ticker Company Sector Excess analysts
SGLB Sigma Labs Inc 06 – Energy ?(6.18)
AEGY Alternative Energy Partners In 10 – Technology ?(5.97)
WPWR Well Power Inc 06 – Energy ?(5.83)
TTDZ Triton Distribution Systems In 10 – Technology ?(5.53)
SFRX Seafarer Exploration Corp 11 – Transportation ?(5.15)
PTRC Petro River Oil Corp 06 – Energy ?(4.99)
UTRM United Treatment CentersInc 08 – Health Care ?(4.82)
BIEL Bioelectronics Corp 08 – Health Care ?(4.80)
DEWM Dewmar International BMC Inc 01 – Basic Materials ?(4.74)
FEEC Far East Energy Corp 06 – Energy ?(4.61)


Too many


Ticker Company Sector Excess analysts
PRSS CafePress Inc 09 – Services ?3.99
SANW S&W Seed Company 05 – Consumer Non-Cyclical ?4.03
KIOR KiOR Inc 01 – Basic Materials ?4.06
PRXG Pernix Group Inc 02 – Capital Goods ?4.08
EYNON Entergy New Orleans, Inc. 12 – Utilities ?4.17
PARF Paradise, Inc. 05 – Consumer Non-Cyclical ?4.40
SUMR Summer Infant, Inc. 05 – Consumer Non-Cyclical ?4.52
LAND Gladstone Land Corp 05 – Consumer Non-Cyclical ?4.57
JRCC James River Coal Company 06 – Energy ?6.38
GNK Genco Shipping & Trading Limit 11 – Transportation ?7.11

My advice to readers is to consider buying companies that have fewer analysts studying them than the model would indicate.? This method is certainly not perfect but it does point out spots where Wall Street is not focusing its efforts, and might provide some opportunities.


Full disclosure: long BRK/B & CVX

On Intrinsic Value

On Intrinsic Value

In his annual report, though not his more well-known letter, Buffett talked about intrinsic value. ?It was on pages 107-108, and here it is:

Now let?s focus on a term that I mentioned earlier and that you will encounter in future annual reports.

Intrinsic value is an all-important concept that offers the only logical approach to evaluating the relative attractiveness of?investments and businesses. Intrinsic value can be defined simply: It is the discounted value of the cash that can be taken out of a?business during its remaining life.

The calculation of intrinsic value, though, is not so simple. As our definition suggests, intrinsic value is an estimate rather than a?precise figure, and it is additionally an estimate that must be changed if interest rates move or forecasts of future cash flows are?revised. Two people looking at the same set of facts, moreover ? and this would apply even to Charlie and me ? will almost inevitably?come up with at least slightly different intrinsic value figures. That is one reason we never give you our estimates of intrinsic value. ?What our annual reports do supply, though, are the facts that we ourselves use to calculate this value.

Meanwhile, we regularly report our per-share book value, an easily calculable number, though one of limited use. The?limitations do not arise from our holdings of marketable securities, which are carried on our books at their current prices. Rather the?inadequacies of book value have to do with the companies we control, whose values as stated on our books may be far different from?their intrinsic values.

The disparity can go in either direction. For example, in 1964 we could state with certitude that Berkshire?s per-share book?value was $19.46. However, that figure considerably overstated the company?s intrinsic value, since all of the company?s resources?were tied up in a sub-profitable textile business. Our textile assets had neither going-concern nor liquidation values equal to their?carrying values. Today, however, Berkshire?s situation is reversed: Now, our book value far understates Berkshire?s intrinsic value, a?point true because many of the businesses we control are worth much more than their carrying value.

Inadequate though they are in telling the story, we give you Berkshire?s book-value figures because they today serve as a rough,?albeit significantly understated, tracking measure for Berkshire?s intrinsic value. In other words, the percentage change in book value?in any given year is likely to be reasonably close to that year?s change in intrinsic value.

You can gain some insight into the differences between book value and intrinsic value by looking at one form of investment, a?college education. Think of the education?s cost as its ?book value.? If this cost is to be accurate, it should include the earnings that?were foregone by the student because he chose college rather than a job.?

For this exercise, we will ignore the important non-economic benefits of an education and focus strictly on its economic value.?First, we must estimate the earnings that the graduate will receive over his lifetime and subtract from that figure an estimate of what?he would have earned had he lacked his education. That gives us an excess earnings figure, which must then be discounted, at an appropriate interest rate, back to graduation day. The dollar result equals the intrinsic economic value of the education.

Some graduates will find that the book value of their education exceeds its intrinsic value, which means that whoever paid for?the education?didn’t?get his money?s worth. In other cases, the intrinsic value of an education will far exceed its book value, a?result?that proves capital was wisely deployed. In all cases, what is clear is that book value is meaningless as an indicator of intrinsic value.

There are two problems with intrinsic value:

  1. We don’t really know what future free cash flow will be, nor the willingness and ability of management to use it wisely.
  2. We really don’t know what the cost of capital is for a firm, particularly not the cost of equity.

With simple firms, we can try to do a sum-of-the-parts analysis off of comparable companies — but often the differences are significant. ?It’s not easy.

Buffett has drawn a line in the sand, and that line has held so far — he buys back shares when the price drops below 1.2x book value. ?At present, that is his proxy for what I suspect is his minimum view of what BRK is worth.

This offers an experimental way of attempting to estimate intrinsic value, that is, if you are the CEO or CFO. ?Set up a valuation metric off of book or sales, since they don’t move as much as earnings, and then offer to buy back shares at a multiple of the metric that you think represents intrinsic value.

If you don’t buy many shares, you might want to move the multiple up. ?If shares come flooding in, move the multiple down. Oops, did I forget to mention “be conservative initially?”

I think Buffett is setting an example to other management teams on how to run an intelligent buyback. ?The main principle is this: buy back shares during a panic, or during a malaise that does not reflect future prospects. ?Don’t buy back shares all of the time. ?Wait for bargains to buy back shares.

If you set the barrier on when you buy shares such that it happens a few times a year, and cash levels never get too low, you’ve probably set up a good buyback plan, and as a bonus, you have a decent conservative idea of what the intrinsic value is for your stock.

I think it would make a lot of sense for CEOs and CFOs to imitate Buffett, and make their buybacks contingent on a certain multiple of book value or sales. ?Adapt the level to demand, and be conservative — it is far better to not make so much money, than to give away give away value by overpaying for your stock. ?You can always buy back more stock later; you can’t un-buy stock.

The side benefit of an exercise like this to a corporation is that it will understand its cost of capital well, and will be all the more able to make intelligent decisions on mergers and acquisitions, stock buybacks and issuance.

Full Disclosure: Long BRK/B for clients and me

Theme: Overlay by Kaira