Category: Stocks

Watch Net Income Double in Two Years, Not
Watch Net Income Double in Two Years, Not

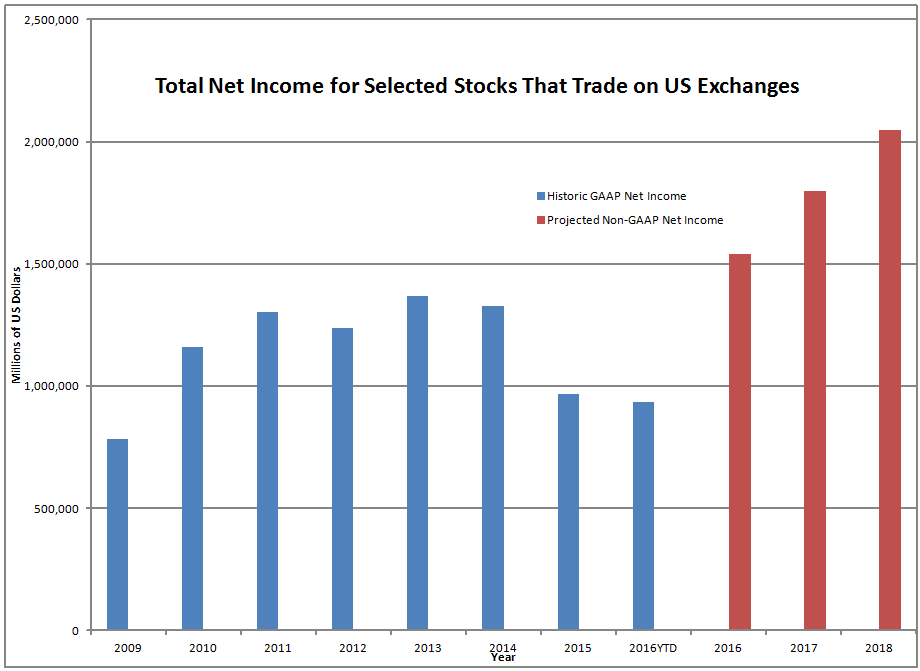
Data Source: Media General || Note: Do not cite or republish this graph without publishing the limitations paragraph below.

=====================

Before I start this evening, I want to state again that I welcome comments at this blog. It may not seem so from the last few months, but I have shaken the bugs out of the software that protects my blog, which was hypersensitive on comments. The only thing I ask of commenters is that you be polite and clean in your speech. Disagree with me as you like — hey, even I have doubts about my more extreme positions. 😉

Limitations

The graph above and the text explaining it could very easily be misused, so I am giving a detailed explanation of how I calculated the figures so that people looking at them can more easily critique them and perhaps show me where they are wrong. ?Please use the above figures with care.

I summed up the net income data for 2706 firms in the Media General database used in the AAII Stock Investor Pro screening software. ?Those firms had:

  • Seven years of historical earnings data (2009-2015)
  • Earnings estimates that go out to 2018, and
  • An estimate of the diluted common shares of each

In short, it is all of the firms trading on US exchanges (that Media General covers) that have seven years of earnings history, and significant analyst coverage extending out for two years. ?Please note that not all fiscal years are equivalent, and that the historic data is on fiscal years, aside from 2016YTD, which is a trailing twelve months figure. ?That means 2016YTD is largely from the first half of calendar 2016 and the last half of calendar 2015.

Note that companies that went out of existence between 2009 and today are not reflected in these figures. ?They represent only the companies that exist as publicly traded firms today. ?Also note that foreign firms trading on US exchanges are in these figures.

The projected Non-GAAP earnings are the product of average sell-side earnings estimates and the most recent estimate of fully diluted common shares. ?2016, 2017 & 2018 are the current, next year, and two years ahead estimates of adjusted earnings, which are?Non-GAAP.

Remember that sell-side estimates are designed (in theory) to eliminate transitory factors and provide an estimate of run rate earnings for the future. ?Whether that is true in practice is another matter, as we may see here.

There is one more piece of data that you need before you can interpret the above graph: because of foreign firms that are included, the total market capitalization underlying the graph is $28.8 Trillion.

Analysis

After my recent piece?Practically Understanding Non-GAAP Earnings Adjustments, I felt there was something more to say, because regularly I would see earnings estimates that were higher than historic earnings by a wide margin, which would make me say “How does it get from here to there?” ?The answer is simple. ?It doesn’t.

Why? ?We’re comparing apples and oranges. ?GAAP earnings deduct many expenses out that were incurred in prior periods, but deferred. ?GAAP earnings also have?unusual and extraordinary charges that are expected not to occur. ?Non-GAAP earnings exclude those (among other things, sometimes excluding interest and taxes). ?As such, they are considerably higher than GAAP earnings.

Take a look at this table of price-earnings ratios.

Year

2009

2010 2011 2012 2013 2014 2015 2016YTD 2016 2017

2018

P/E

36.61

24.84 22.13 23.26 21.01 21.70 29.69 30.68 18.68 16.02

14.06

Note: the same warning on the graph applies to this table.

Note that the current market capitalization is being applied against historic net income 2009-2016YTD. ?2016-2018 are on projected non-GAAP net income estimated by the sell-side. ?Obviously, in 2009 the market capitalization was much lower, and so the P/E then would have been higher. ?Survivorship bias will have some impact here, but I’m not sure which way it would go.

See how much lower the P/Es are for the sell-side estimates (these would be bottom-up, not top-down). ?Figures like this get cited by pundits who say the market isn’t that expensive.

Also, note how GAAP earnings have shrunk since 2014, and haven’t grown much since 2009. ?I know only the media compares actual to prior, which is an anachronism, but maybe we need to do that more.

Summary

That leaves us with a few sticky questions:

  • Which is a better measure for growth in value? ?GAAP or non-GAAP earnings? ?(I think the answer varies by industry, and how long of a period you are considering.)
  • Should we allow non-GAAP earnings to be published? (Yes, after all management is going to explain the non-GAAP adjustments orally as they explain why the quarter was good or bad.)
  • Does this mean that the market is overvalued? ?(Not necessarily. ?Rational businessmen are still buying some firms out, which partially validates current levels. Also, free cash flow is not affected by accounting rules, so questions of overvaluation should not rely on accounting methods. ?If it is overvalued on one, it should be overvalued on all, etc.)
  • Should we create a fifth main statement for GAAP accounting, that formalizes non-GAAP and gives it real rules? (Probably, but like most of GAAP, there will be some flexibility and industry-specific rules.)

As for me, this will give me a little help in making adjustments to earnings estimates as I try to think through valuation issues, and give me some rough idea as to whether the hockey stick that the sell side illustrates is worth considering or not, or to what degree.

Again, comments are welcome. ?Please note that my findings are tentative here.

Practically Understanding Non-GAAP Earnings Adjustments

Practically Understanding Non-GAAP Earnings Adjustments

Photo Credit: Constanza || Well, aren't many efforts at adjusting earnings patch jobs??
Photo Credit: Constanza || Well, aren’t many efforts at adjusting earnings patch jobs??

==================

Over the years, I’ve written a lot about earnings adjustments and non-GAAP earnings. ?There are several basic questions to answer:

1) Which matters more? ?GAAP earnings or non-GAAP earnings?

In the short-run, non-GAAP earnings matter more for two reasons: a) the non-GAAP earnings attempt in principle to eliminate special factors and estimate the change in run-rate earnings or free cash flow. ?If done properly, it is a very valuable exercise. ?If done wrong, it’s just an advanced form of chicanery, where companies attempt to keep the stock price higher than it deserves to be, before gravity catches up with them. ?Gravity will catch up regardless and eventually, because fooling Ben Graham’s weighing machine invites a rude payback with compound interest. ?Ask Enron.

b) the second reason is a weaker one, but the sell-side performs a service by estimating earnings, and they use non-GAAP earnings. ?It is a control mechanism that allows investors to measure the progress of companies in the short-run. ?Note that this does not encourage short-termism unless the non-GAAP adjustments are done wrong. ?It’s fine to talk about the long-run, but what progress are you making toward it? ?If the non-GAAP metric does not reflect the best efforts of the management team to create the long term value, then they need to adjust their non-GAAP earnings metric to reflect what maximizes long-run value creation. ?After that, educate the sell-side on why you are right, and let the buy-side quietly consider whether they can improve on it.

That said, GAAP earnings are more important for the long run. ?Even more important is the growth in book value plus accrued dividends. ?These measures take into account the one-time adjustments. ?The many one time adjustments. ?THE CONSTANT ONE TIME ADJUSTMENTS!! ?

(Ahem.)?Management is responsible over the long haul for all of the things that they never anticipated, because they are supposed to be prepared for them on average. ?It’s fine to complain about weather affecting sales or margins for one quarter, but to complain about it more than twice in a decade means you aren’t prepared as a management team. ?The same applies to writing down goodwill and other asset values. ?One surprise every now and then is fine, but if it becomes annual then it should be planned for… perhaps the recoverability estimates aren’t very good at all, and you need to write down ten years of a lack of expected profitability now, rather than eating the elephant of subpar decisions?one bite at a time.

2) What should we look for in?earnings surprises?

a) Be wary of companies that always beat estimates. ?Those that do are one of two things — stupendous, or manipulators. ?Earnings should be somewhat ragged, even for a growth company. ?I actually like my companies to miss estimates every now and then, because it proves genuineness.

b) Be wary of companies that beat positive estimates frequently, but never seem to have GAAP earnings or book value that grows. ?What that means is that the non-GAAP metric may not truly represent what is building value for the firm.

c) Be wary of companies that beat positive estimates frequently, and yet have to raise a lot of capital because the business isn’t throwing off a lot of cash that can be reinvested in the business. ?Non-GAAP metrics should be strongly related to free cash flow, which should reduce financing needs.

d) For companies with negative forecast earnings, watch the date closely for when earnings are supposed to go positive. ?If you see that date extended more than once, you might want to sell.

e) If a?stock trades at a low valuation, don’t make too much out of missing earnings if the book value grows at a decent rate.

3) What else should we know?

a) Earnings misses and beats are frequently overestimated in importance. ?Business has irregularities; get used to it, and don’t panic off of one or two bad numbers.

b) But repeated?misses probably should be sold, unless the valuation is so cheap that an activist would have an easy time with the stock.

c) If a management is good at managing capital, and honest, an earnings miss can be a great opportunity to buy. ?Remember that not all value is driven through short-term earnings. ?Clever use of free cash flow to do small acquisitions that can be grown organically can be underestimated. ?During times of crisis, a genuinely clever management team can occasionally do amazing things as conditions seem to be falling apart, by buying cheap assets from mis-financed sellers who need quick cash.

d) Stocks with high valuations should use excess cash to pay dividends; those at low valuations should buy back stock.

e) The height of the stock market tends to be determined by long-term estimates of unadjusted future earnings or free cash flow, rather than the current period expected earnings. ?As with everything in investing, don’t get too excited about anything. ?This is a business, and not primarily a game, though many things are game-like.

f) Situations where M&A are involved are always more complex, and require special handling. ?I can’t give a simple general answer there.

g) Actual GAAP earnings and non-GAAP earnings do not live on the same planet on average. ?At some point, I will put out a post showing how inflated non-GAAP earnings are on average versus GAAP earnings. ?I have the study design ready to go, and just have to run the calculations. ?If you look at past earnings, and compare them to forecast earnings, the naive will say, “Wow, what growth!” ?The experienced will say, “There are things in the non-GAAP earnings that will not factor into long-term growth in value.”

========================

That’s all for now. ?Your quality thoughts in response are always welcome, though I can’t answer every comment.

Estimating Future Stock Returns, June 2016 Update

Estimating Future Stock Returns, June 2016 Update

ecphilosopher-data-2016-q2

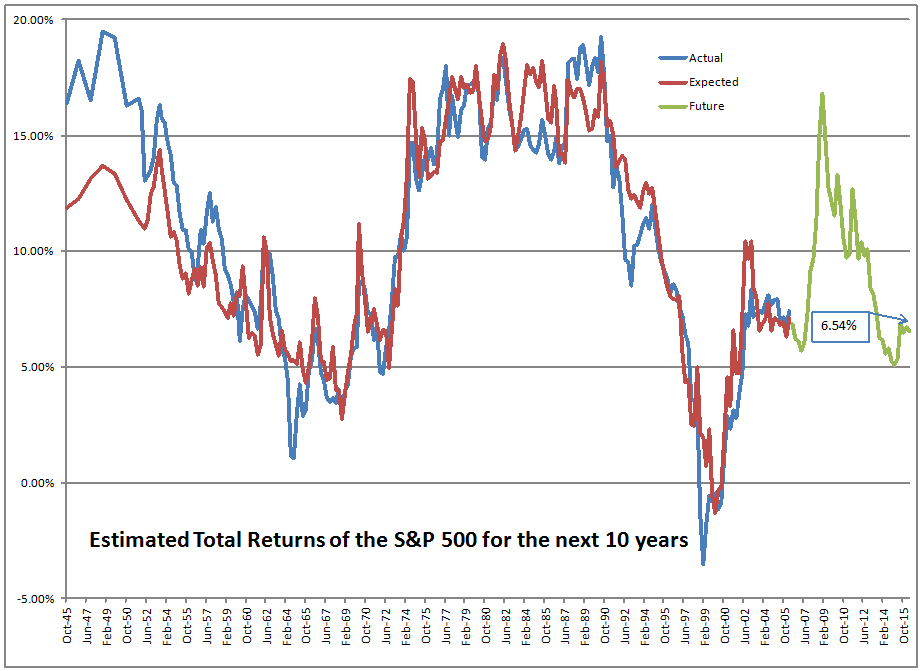
This is my quarterly update on how much the market is likely to return over the next 10 years. ?At the end of the last quarter, that figure was around 6.54%/year. ?For comparison purposes, that is at the 77th percentile of outcomes — high, but not nosebleed high, which to me, is when the market is priced to?return 3% or less. ?That’s when you run.

Adding in quarter to date movements, the current value should be near 6.3%/year (79th percentile).

With all of the hoopla over how high the market is, why is this measure not screaming run? ?This is because average investors, retail and institutional, are not as heavily invested in the equity markets as is typical toward the end of bull markets. ?There are many articles calling for caution — I have issued a few as well.

From an asset-liability management standpoint, bull markets get particularly precarious when caution is thrown to the wind, and people genuinely believe that there is no alternative to stocks — that you are missing out on “free money” if you are not invested in stocks.

We aren’t there now. ?So, much as I am not crazy about the present state of the credit cycle (debts rising, income falling), there is still the reasonable possibility of more gains in the stock markets.

===================================

For more on this series, see the first four articles in this search, which describe the model, and its past estimates.

Dead as a Severed Horse’s Head

Dead as a Severed Horse’s Head

Photo Credit: Swampier

=-=-=-=-=-=-=-=-=-=-=-=-=-=-=-=-=

Six years ago, I reviewed a book?The Club No One Wanted To Join. ?It was a poorly done book written by a bunch of people who were swindled by Bernie Madoff. ?Now, I?didn’t want to be unsympathetic — after all, they were cheated. ?But they missed many signals that tipped off others, and could have tipped off them to the fraud. ?Worse, they tried to argue that since many top-performing mutual funds had total returns similar to that of Madoff, there was no way anyone could have figured out that it was a scam. ?They neglected to note that Madoff’s returns were ultra-smooth, while the returns of the mutual funds were not. ?Big difference.

There’s one more thing: many of them gave in to the idea that they had found a hole in the system. ?Far from it being “The Club No One Wanted To Join,” rather, it was their own secret private club that they were smart enough to join when fate smiled on them, and they got their opportunity.

Tonight, I am talking about a different sort of scam that sucked in a different class of people. ?This scam was a corporation where the management took a?firm into bankruptcy that could easily pay its debts, at least in the short-run. ?The management likely conspired with the bondholders against its shareholders, seemingly in an effort to gain a greater reward from the bondholders who would own the firm post-bankruptcy than they could from operating the firm outside of bankruptcy. ?The name of this firm is Horsehead Holdings [ZINCQ].

For background, you can read this?article in the New York Times. ?For the ultimate result of the bankruptcy, you can read this article in the Wall Street Journal:?Zinc Producer Horsehead Cleared to Exit Bankruptcy.

I’m not writing about?this to give a blow-by-blow description of how the bondholders and management cheated shareholders out of their ownership interests, though I will touch on that at points. ?I am writing about this to respond to those who wrote to me in the midst of the bankruptcy trial to try to gain some coverage of what was going on.

Over 20 people wrote to me and almost 100?journalists/media in an attempt to create “viral” coverage of the trial, and if nothing else, bring public attention to the travesty that was the bankruptcy process. ?As it is, I wrote one paragraph on the matter, but I didn’t see anything from any major publication until after the trial completed. ?I did mention to a number of the writers that efforts to get coverage would not affect the outcome of the bankruptcy court; it is relatively insulated from public opinion, as it should be.

(As an aside: if you write such a letter to journalists, or me, try to stay on topic. ?It is not relevant to call the bondholders “greedy,” that they are a hedge fund, or talk about their prior dealings with Collateralized Debt Obligations that failed during the recent financial crisis.)

Aleph Blog is mostly about risk control. ?As I read the letters from the shareholders who were watching their ownership rights be destroyed, I noted a few things that might have enabled some of them to avoid much of the unfavorable outcome:

  • Buying a levered highly cyclical company.
  • Relying on the insights of bright investors who buy concentrated stakes ?in a few companies.
  • Not diversifying enough.

Let me take these in order:

Buying a levered highly cyclical company

If you look at the risk of owning a single company, there are two ways where a company can affect the degree to which a change in sales can raise the profits of the company. ?The first way is to choose a production method that has high fixed costs and low variable costs, which is typically true of cyclical companies. ?The second way is to borrow money. ?Both methods magnify returns, right or wrong.

Typically, you only do one at a time. ?Supermarkets are stable, so they often borrow more to lever up returns. ?Mining companies, among other industries that require heavy capital investment, are anything but stable booms and busts are common and follow product prices.

Horsehead Holdings had a high degree of leverage from both debt and being in a cyclical industry. ?It ran into a scenario where the price of its main product, zinc, fell hard. ?At the time before they filed for bankruptcy, management could legitimately say to themselves, “If the price of zinc remains this low we will shortly be insolvent, particularly if our new processing plant doesn’t work out.”

Now, the bankruptcy code is a rather flexible beastie. ?It allows for a management team to file before things are at their worst so that they can try to preserve a better outcome for the company. ?My suspicion is that management’s motives were mixed when they filed — they wanted the best deal they could get for themselves, but may have assumed that there wasn’t much life left to the equity anyway. ?Who could have predicted that the price of zinc would rally back so much, such that the company could have survived in its pre-bankruptcy state?

Now, has this ever happened to me? ?Not exactly, but there are other ways that managements can dispose of a company to the detriment of the stockholders. ?I lost money on C. Brewer Homes when management did a leveraged buyout when the stock price was unduly depressed. ?Enough stock was in the hands of arbs that the deal went through. ?Oh, and if you want another one, there was the loss on National Atlantic Holdings which I described in ugly detail in this article.

The main point is this: don’t assume that management will act in the interests of stockholders, particularly in a stressed situation. ?The leverage and cyclicality of Horsehead Holdings set up the possibility of that occurrence, and the fall in the price of zinc triggered it.

Relying on the insights of bright investors who buy concentrated stakes ?in a few companies

I respect both Mohnish Pabrai and Guy Spier. ?They are bright guys, and from what I can tell at a distance, ethical too. ?They were big holders of Horsehead Holdings, and I’m sure they had good reasoning behind their decisions. ?But, even excellent investment managers aren’t infallible. If you are just picking one of their ideas, that could be a rocket to the sky — or the ground, while their portfolio as a whole might do well.

Also, they will make their decisions with some lead time over you if the data shifts. ?Any investment advisor you mimic is not required to tell you when they change their mind, aside from required filings with the SEC… which are delayed, and sometimes don’t cover everything.

Has this happened to me? ?Yes it has. ?I have sometimes invested partly ?on who is invested in a company, though never to the point of not?doing my “due diligence.” ?But aside from some early failures 20+ years ago, it never hurt me much because I was never guilty of:

Not Diversifying Enough

A number of the people emailing me said they put more than half their savings into Horsehead Holdings. ?If you are going to engage in such risky behavior, you need to know more than everyone else investing in the stock. ?No exceptions. ?I agree with investing in a concentrated way, but?my view of that for average people is no positions larger than 5% of your capital. ?That is plenty concentrated enough.

I have one holding that is 13% of my assets — a private company that I know exceptionally well. ?My house is another 13%. ?After that, my next largest holding is 3% of my assets. ?I believe in the assets that I buy, but I concentrate enough by only owning individual stocks, and very little in the way of pooled investment vehicles.

With 75% of my assets in risk assets, I take enough risk. ?I don’t have to amplify that by taking disproportionate security-specific risk. ?(The stock portfolios that I provide for clients have 35 or so stocks in them… given that I tend to concentrate in a few industries, that takes reasonable rsk.)

Summary

Again, my sympathies to those who lost on Horsehead. ?I can’t do anything about those losses. ?At least you have the opportunity to sue the?management of the company. ?It certainly seems like the management team cheated the stockholders, though I can’t say for sure.

What I can help are future investors, and my counsel is this: Diversify! ?You are your own best defender, so don’t merely mimic bright investors; do your own due diligence. ?Be wary of investing in cyclical companies with high debt levels. ?Don’t implicitly trust that management teams will act in your interest. ?And finally, diversify, as it protects against failures in other areas.

PS — I looked through my notes of the past. ?I did look at Horsehead Holdings, and I passed on it. ?That said, I don’t know why… hopefully it was for a good reason, though I expect that I didn’t have room for another cyclical company, and not another one in base metals.

How High Are We?

How High Are We?

I’ve said this before, but I like it when research destroys a preconceived notion of mine. ?Today’s post stems from an exchange that I had with Jackdamn (what a name) on Stocktwits, talking about a chart created by?dshort.

S&P 500 Percent Off High Since March 9, 2009. Chart by Doug Short. $SPX $SPY $DIA

? Jack Damn (@jackdamn) Sep. 3 at 09:39 AM

I responded:

@jackdamn over a 7.5 year period, how frequently do you get 5-10%. 10-15%, 15-20%, 20%+ drawdowns? This graph looks tame to me. $$

? David Merkel (@AlephBlog) Sep. 5 at 02:52 PM

To which he responded: That’s a great question. ?And it is a great question, but I’m not going to answer it directly here… because I think I am answering a better question.

Let me take you through my thought process, because I went through four different ways of trying to answer the question before settling on the better question, and getting the answer.

How do you summarize an area of a price graph in order to make comparisons of different periods? ?How do you determine when the market has been near highs for a long time, or far away for a long time? ?How does the intensity/distance below the high matter? ?If you are looking at troughs, where does one begin and another end?

I started by trying to identify the troughs individually, and the difficulty was trying to establish that in a mechanical way that did not require interpretation. ?I stumbled around playing with minimum periods between troughs, recovery levels before a new trough could start, moving averages to establish when a new trough was genuinely significant. ?Sigh.

I tried a lot of different things, and I could create rules that mostly made the troughs look decent, but I could never get it to be fully mechanical or lack arbitrariness. ?Why this trough?and not that? ?The same criticisms can be applied to dshort’s graph as well.

I finally pulled out of my mental gymnastics when I concluded: couldn’t I just take the area under the maximum line in percentage terms and use that as a measure, say over a 200-day period? ?200 days is arbitrary, and so is the measure, but that is less than most of the measures that I considered, and at least this one corresponds to a relatively simple calculation.

So if you look at the red line in my graph above, you will note that it has dipped below 2.0?five times in the last 66 years, in 1954, 1959, 1964, 1995 and 2014. ?These observations followed periods where the markets moved to new highs rather smartly and without a lot of downside volatility. ?Then there were 3 times that the measure peaked?higher than 64, in 1975, 2003 and 2009. ?These times followed incredible market falls, and were great times to be putting money into the market.

Below you can see ?a table of values for how often the measure is below a given threshold. ?It’s only above 64 about 5% of the time, and below 2 about 3.5% of the time. ?My main thought is this measure is this: high values of the measure probably are a “buy signal.” ?Low values of the measure aren’t necessarily a “sell signal.”

That signals are asymmetric should not be surprising. ?The largest factor in most long-term market moves, the credit cycle, is also asymmetric. ?It’s like my continuing series, Goes Down Double Speed. ?Bull markets have shallower moves and longer duration, the same way that the bull phase of the credit cycle goes. ?Extend credit, extend credit, extend credit… loosen standards, loosen standards, loosen standards… tighten spreads, tighten spreads, tighten spreads, etc. ?Then in the bear phase it is DENY CREDIT!! TIGHTEN STANDARDS!! SHEPHERD LIQUIDITY!! SURVIVE!! ?Short and sharp. ?Painful. ?Prices are lower, and yields higher at the end.

To close this off, where is this indicator now? ?It’s around 8, which is near the 40th percentile… kind of a blah figure, not saying much of anything… which is good in its own way. ?The market meanders and hits a few new highs, sags a little, comes back, hits a few new highs, etc. ?Not many people believe in it, but we are inches off the highs. ?Odds are we go higher from here, but not aggressively higher.

One final note: we are in the fourth and final phase of the credit cycle now, so don’t get too aggressive. ?Debt is getting higher inside nonfinancial corporations. ?Be wary, and do your fundamental due diligence on balance sheets.

Percentile DFHI200MS
1% 1.33
5% 2.42
10% 3.21
20% 4.50
30% 5.73
40% 8.18
50% 11.67
60% 17.42
70% 27.47
80% 36.52
90% 49.83
95% 63.10
99% 83.08
The Cash Will Prove Itself

The Cash Will Prove Itself

Photo Credit: Renegade98 || What was it that Buffett said 'bout swimmin' naked?
Photo Credit: Renegade98 || What was it that Buffett said ’bout swimmin’ naked?

=-=-=-=-=-=-=-=-=-=-=-=-=-=-=-=-=-=-=-=-=-=

It?s only when the tide goes out that you learn who has been swimming naked.

— Warren Buffett, credit Old School Value

When I was 29, nearly half a life ago, Donald Trump was a struggling real estate developer. ?In 1990, I was still trying to develop my own views of the economy and finance. ?But one day heading home from work at AIG, I was listening to the business report on the radio, and I heard the announcer say that Donald Trump had said that he would be “the king of cash.” ?My tart comment was, “Yeah, right.”

At that point in time, I knew that a lot of different entities were in need of financing. ?Though the stock market had come back from the panic of 1987, many entities had overborrowed to buy commercial real estate. ?The major insurance companies of that period were deeply at fault in this as well, largely driven by the need to issue 5-year Guaranteed Investment Contracts [GICs] to rapidly growing stable value funds of defined contribution plans. ?Outside of some curmudgeons in commercial mortgage lending departments, few recognized that writing 5-year mortgages with low principal amortization rates against long-lived commercial properties was a recipe for disaster. ?This was especially true as lending yield spreads grew tighter and tighter.

(Aside: the real estate area of Provident Mutual avoided most of the troubles, as they sold their building that they built seven years earlier for twice what they paid to a larger competitor. ?They also focused their mortgage lending on small, ugly, economically necessary properties, and not large trophy properties. ?They were unsung heroes of the company, and their reward was elimination eight years later as a “cost saving move.” ?At a later point in time, I talked with the lending group at Stancorp, which had a similar philosophy, and expressed admiration for the commercial mortgage group at Provident Mutual… Stancorp saw the strength in the idea, and still follows it today as the subsidiary of a Japanese firm. ?But I digress…)

Many of the insurance companies making the marginal commercial mortgage loans had come to AIG seeking emergency financing. ?My boss at AIG got wind of the fact that I was looking elsewhere for work, and subtly regaled me of the tales of woe at many of the insurance companies with these lending issues, including one at which I had recently interviewed. ? ?(That was too coincidental for me not to note, particularly as a colleague in another division asked me how the search was going. ?All this from one stray comment to an actuary I met coming back from the interview…)

Back to the main topic: good investing and business rely on the concept of a margin of safety. ?There will be problems in any business plan. ?Who has enough wherewithal to overcome those challenges? ?Plans where everything has to go right in order to succeed will most likely fail.

With Trump back in 1990, the goal was admirable — become liquid in order to purchase properties that were now at bargain prices. ?As was said in the Wall Street Journal back in April of 1990, the article started:

In a two-hour interview, Mr. Trump explained that he is raising cash today so he can scoop up bargains in a year or two, after the real estate market shakes out. Such an approach worked for him a decade ago when he bet big that New York City’s economy would rebound, and developed the Trump Tower, Grand Hyatt and other projects.

“What I want to do is go and bargain hunt,” he said. “I want to be king of cash.”

That’s where?Trump said it first. ?After that he received many questions from reporters and creditors, because his businesses were heavily indebted, and?property values were deflated, including the properties that he owned. ?Who wouldn’t want to be the “king of cash” then? ?But to be in that position would mean having sold something when times were good, then sitting on the cash. ?Not only is that not in Trump’s nature, it is not in the nature of most to do that. ?During good times, the extra cash that Buffett keeps on hand looks stupid.

Trump did not get out of the mess by raising cash, but by working out a deal with his creditors in bankruptcy. ?Give Trump credit, he had convinced most of his creditors that they were better off continuing to finance him rather than foreclose, because the Trump name made the properties more valuable. ?Had the creditors called his bluff, Trump?would have lost a lot, possibly to the point where we wouldn’t be hearing much about him today.

Trump escaped, but most other debtors don’t get the same treatment Trump did. ?The only way to survive in a credit crunch is plan ahead by getting adequate long-term financing (equity and long-term debt), and keep a “war kitty” of cash on the side.

During 2002, I had the chance to test this as a bond manager. ?With the accounting disasters at mid-year, on July 27th, two of my best brokers called me and said, ?The market is offered without bid.? We?ve never seen it this bad.? What do you want to do??? I kept a supply of liquidity on hand for situations like this, so with the S&P falling, and the VIX over 50, I put out a series of lowball bids for BBB assets that our analysts liked.? By noon, I had used up all of my liquidity, but the market was turning.? On October 9th, the same thing happened, but this time I had a larger war chest, and made more bids, with largely the same result.

That’s tough to do, and my client pushed me on the “extra cash sitting around.” ?After all, times are good, there is business to be done, and we could use the additional interest to make the estimates next quarter.

To give another example, we have the visionary businessman Elon Musk facing a?cash crunch?at Tesla?and?SolarCity. ?Leave aside for a moment his efforts to merge the two firms when stockholders tend to prefer “pure play” firms to conglomerates — it’s interesting to look at how two “growth companies” are facing a challenge raising funds at a time when the stock market is near all time highs.

Both Tesla and Solar City are needy companies when it comes to financing. ?They need a lot of capital to grow their operations before the day comes when they are both profitable and cash flow from operations is positive. ?But, so did a lot of dot-com companies in 1998-2000, of which a small number exist to this day. ?Elon Musk is in a better position in that presently he can dilute?issue shares of Tesla to finance matters, as well as buy 80% of the Solar City bond issue. ?But it feels weird to have to finance something in less than a public way.

There are other calls on cash in the markets today — many companies are increasing dividends and buying back stock. ?Some are using debt to facilitate this. ?I look at the major oil companies and they all seem to be levering up, which is unusual given the recent trajectory of crude oil prices.

We are in the fourth phase of the credit cycle now — borrowing is growing, and profits aren’t. ?There’s no rule that says we have to go through a bear market in credit before that happens, but that is the ordinary?way that excesses get purged.

That is why I am telling you to pull back on risk, and review your portfolio for companies that need financing in the next three years or they will croak. ?If they don’t self finance, be wary. ?When things are bad only cash flow can validate an asset, not hopes of future growth.

With that, I close this article with a poem that I saw as a graduate student outside the door of the professor for whom I was a teaching assistant when I first came to UC-Davis. ?I did not know that is was out on the web until today. ?It deserves to be a classic:

Quoth The Banker, ?Watch Cash Flow?

Once upon a midnight dreary as I pondered weak and weary
Over many a quaint and curious volume of accounting lore,
Seeking gimmicks (without scruple) to squeeze through
Some new tax loophole,
Suddenly I heard a knock upon my door,
Only this, and nothing more.

Then I felt a queasy tingling and I heard the cash a-jingling
As a fearsome banker entered whom I?d often seen before.
His face was money-green and in his eyes there could be seen
Dollar-signs that seemed to glitter as he reckoned up the score.
?Cash flow,? the banker said, and nothing more.

I had always thought it fine to show a jet black bottom line.
But the banker sounded a resounding, ?No.
Your receivables are high, mounting upward toward the sky;
Write-offs loom.? What matters is cash flow.?
He repeated, ?Watch cash flow.?

Then I tried to tell the story of our lovely inventory
Which, though large, is full of most delightful stuff.
But the banker saw its growth, and with a might oath
He waved his arms and shouted, ?Stop!? Enough!
Pay the interest, and don?t give me any guff!?

Next I looked for noncash items which could add ad infinitum
To replace the ever-outward flow of cash,
But to keep my statement black I?d held depreciation back,
And my banker said that I?d done something rash.
He quivered, and his teeth began to gnash.

When I asked him for a loan, he responded, with a groan,
That the interest rate would be just prime plus eight,
And to guarantee my purity he?d insist on some security?
All my assets plus the scalp upon my pate.
Only this, a standard rate.

Though my bottom line is black, I am flat upon my back,
My cash flows out and customers pay slow.
The growth of my receivables is almost unbelievable:
The result is certain?unremitting woe!
And I hear the banker utter an ominous low mutter,
?Watch cash flow.?

Herbert S. Bailey, Jr.

Source: ?The January 13, 1975, issue of Publishers Weekly, Published by R. R. Bowker, a Xerox company.? Copyright 1975 by the Xerox Corporation. ?Credit also to?aridni.com.

Bumped Against My Upper Cash Limit

Bumped Against My Upper Cash Limit

Photo Credit: Wayne Stadler || Most of us have limited vision, myself included

=-=-=-=-=-=-=-=-=-=-=-=-=-=-=-=-=-=-=-=-=-=-=-=

In the time I have been managing money for myself and others in my stock strategy, I set a limit on the amount of cash in the strategy. ?I don’t let it go below 0%, and I don’t let it go over 20%.

I have bumped against the lower limit six or so?times in the last sixteen years. ?I bumped against it around five times in 2002, and once in 2008-9. ?All occurred near the bottom of the stock market. ?In 2002, I raised cash by selling off the stocks that had gotten hurt the least, and concentrating in sound stocks that had taken more punishment. ?In September 2002, when things were at their worst, I scraped together what spare cash I had, and invested it. ?I don’t often do that.

In 2008-9 I behaved similarly, though my household cash situation was tighter. ?Along with other stocks I thought were bulletproof, but had gotten killed, I bought a double position of RGA near the bottom, and then held it until last week, when it finally broke $100.

But, I had never run into a situation yet where I bumped into the 20% cash limit until yesterday. ?Enough of my stocks ran up such that I have been selling small bits of a number of companies for risk control purposes. ?The cash started to build up, and I didn’t have anything that I deeply wanted to own, so it kept building. ?As the limit got closer, I had one stock that I liked that would serve as at least a temporary place to invest — Tesoro [TSO]. ?Seems cheap, reasonably financed, and refining spreads are relatively low right now. ?I bought a position in Tesoro yesterday.

I could have done other things. ?I could have moved the position sizes of my portfolio up, but I would have had to increase the position sizes a lot to have some stocks hit the lower edge of the trading band,?but that would have been more bullish than I feel now. ?As it is, refiners have been lagging — I can live with more exposure there to augment Valero, Marathon Petroleum and PBF.

I also could have doubled a position size of an existing holding, but I didn’t have anything that I was that?impressed with. ?It takes a lot to make me double a position size.

As it is, my actions are that of following the rules that discipline my investing, but acting in such a way that reflects my moderate bearishness over the intermediate term. ?In the short run, things can go higher; the current odds even favor that, though at the end the market plays for small possible gains versus a larger possible loss.

The credit cycle is getting long in the tooth; though many criticize the rating agencies, their research (not their ratings) can serve as a relatively neutral guidepost to investors. ?Corporate debt is high and increasing, and profits are flat to shrinking… not the best setup for longs. ?(Read John Lonski at Moody’s.)

I will close this piece by saying that I am looking over my existing holdings and analyzing them for need for financing over the next three years, and selling those that seem weak… though what I will replace them with is a mystery to me.

Bumping up against my upper cash limit is bearish… and that is what I am working through now.

Full disclosure: long VLO MPC PBF and TSO

Book Review: Wiped Out

Book Review: Wiped Out

Wiped Out

Before I start this evening, thanks to Dividend Growth Investor for telling me about this book.

This is an obscure little book published in 1966. ?The title is direct, simple, and descriptive. ?A more flowery title could have been, “Losing Money in the Stock Market as an Art Form.” ?Why? ?Because he made every mistake possible in an era that favored stock investment, and managed to lose a nice-sized lump sum that could have been a real support to his family. ?Instead, he tried to recoup it by anonymously publishing ?this short book which goes from tragedy to tragedy with just enough successes to keep him hooked.

Whom God Would Destroy

There is a saying, “”Whom the gods would destroy, they first make mad.” ?My modification of it is, “Whom God would destroy, he first makes proud.” ?In this book, the author knows little about investing, but wishing to make more money in the midst of a boom, he entrusts a sizable nest egg for a young middle-class family to a broker, and lo and behold, the broker makes money in a rising market with a series of short-term investments, with very few losses.

Rather than be grateful, the author got greedy. ?Spurred by success, he became somewhat compulsive, and began reading everything he could on investing. ?To brokers, he became “the impossible client,” (my words, not those of the book) because now he could never be satisfied. ?Instead of being happy with a long-run impossible goal of 15%/year (double your money every five years), he wanted to double his money every 2-3 years. (26-41%/year)

As such, he moved his money from the broker that later he admitted he should have been satisfied with, and sought out brokers that would try to hit home runs. ?The baseball analogy is useful here, because home run hitters tend to strike out a lot. ?The analogy breaks down?here: a home run hitter can be useful to a team even if he has a .250 average and strikes out three times for every home run. ?Baseball is mostly a game of team compounding, where usually a number of batters have to do well in order to score. ?Investment is a game of individual compounding, where strikeouts matter a great deal, because losses of capital are very difficult to make up. ?Three 25% losses followed by a 100% gain is a 15% loss.

In the process of trying to win big, he ended up losing more and more. ?He concentrated his holdings. ?He bought speculative stocks, and not “blue chips.” ?He borrowed money to buy more stock (used margin). ?He bought “story stocks” that did not possess a margin of safety, which would maybe deliver high gains ?if the story unfolded as illustrated. ?He did not do homework, but listened to “hot tips” and invested off them. ?He let his judgment be clouded by his slight relationships with corporate insiders at the end. ?HE TRIED TO MAKE BIG MONEY QUICKLY, AND CUT EVERY CORNER TO DO SO. ?His expectations were desperately unrealistic, and as a result, he lost it all.

As he lost more and more, he fell into the psychological trap of wanting to get back what he lost, and being willing to lose it all in order to do so. ?I.e., if he lost so much already, it was worth losing what was left if there was a chance to prove he wasn’t a fool from his “investing.” ?As such, he lost it all… but there are three good things to say about the author:

  1. He had the humility to write the book, baring it all, and he writes well.
  2. He didn’t leave himself in debt at the end, but that was good providence for him, because if he had waited one more day, the margin clerk would have sold him out at a decided loss, and he would have owed the brokerage money.
  3. In the end, he knew why he had gone wrong, and he tells his readers that they need to: a) invest in quality companies, b) diversify, and c) limit speculation to no more than 20% of the portfolio.

His advice could have been better, but at least he got the aforementioned ideas?right. ?Margin of safety is the key. ?Doing significant due diligence if you are going to buy individual stocks is required.

Quibbles

This book will not teach you what to do; it teaches what not to do. ?It is best as a type of macabre financial entertainment.

Also, though you can still buy used copies of the book, if enough of you try to buy the used books out there, the price will rise pretty quickly. ?If you can, borrow it from interlibrary loan. ?It is an interesting historical curiosity of a book, and a cautionary tale for those who are tempted to greed. ?As the author closes the book:

“Cupidity is seldom circumspect.”

And thus, much as the greedy need to hear this advice, it is unlikely they will listen. ?Greed is compulsive.

Summary / Who Would Benefit from this Book

A good book, subject to the above limitations. ?It is best for entertainment, because it will teach you what not to do, rather than what to do.

Borrow it through interlibrary loan. ?If you feel you have to buy it, you can buy it here:?WIPED OUT. How I Lost a Fortune in the Stock Market While the Averages Were Making New Highs.

Full disclosure:?I bought it with my own money for three bucks.

If you enter Amazon through my site, and you buy anything, including books, I get a small commission. This is my main source of blog revenue. I prefer this to a ?tip jar? because I want you to get something you want, rather than merely giving me a tip. Book reviews take time, particularly with the reading, which most book reviewers don?t do in full, and I typically do. (When I don?t, I mention that I scanned the book. Also, I never use the data that the PR flacks send out.)

Most people buying at Amazon do not enter via a referring website. Thus Amazon builds an extra 1-3% into the prices to all buyers to compensate for the commissions given to the minority that come through referring sites. Whether you buy at Amazon directly or enter via my site, your prices don?t change.

Abusing Buffett’s Reputation for Profit

Abusing Buffett’s Reputation for Profit

Photo Credit: Fortune Live Media

-=-=-=-=-=-=

Yesterday, Berkshire Hathaway issued a press release:

WARNING ? On-Line Article Regarding Warren Buffett, BREXIT and Anderson Cooper is a Fraud

OMAHA, Neb.–(BUSINESS WIRE)–Berkshire Hathaway Inc. (NYSE: BRK.A; BRK.B) ?

It has come to Berkshire?s attention that there is an article on-line concerning Warren Buffett and BREXIT with respect to a conversation that Mr. Buffett allegedly had with Anderson Cooper. The article is headlined as follows ? ?Warren Buffett Warns ?BREXIT? Chaos is going to cost Millions of Americans Jobs.? For the record, Mr. Buffett has not spoken with Anderson Cooper for about five years and never about BREXIT.

The article among other fraudulent claims states that Mr. Buffett spoke with Mr. Cooper and indicated that Mr. Buffett was recommending something called ?The Global Cash Code.? Allegedly, per the on-line article, Mr. Buffett indicated that Sandra Barnes, the party who allegedly created ?The Global Cash Code,? has been teaching people how to successfully use ?The Global Cash Code.? Prior to learning of this fraudulent article, Mr. Buffett has never spoken with or even heard of Sandra Barnes.

Contacts

Berkshire Hathaway Inc.
Marc D. Hamburg, 402-346-1400

There is no end of those that want to cash in on Warren Buffett. ?But those that know Buffett know that he doesn’t give investment advice aside from what he has written publicly himself. ?But to the uninformed, the pitch mentioned looks real enough.

I was curious, so I went looking for it, and I found a version of it here. ?It came up number one on my Google search. ?It looks like a fake CNN site, which fits the shtick of using Anderson Cooper interviewing Buffett. ?I decided to do a WHOIS search on the domain name “com-politics.us” to see if there was anything interesting. ?There was.

The domain was registered on June 28th, 2016. ?Here’s the data I found at the WHOIS site:

Name:?Devin Karapoulos
Organization:?Devin Karapoulos
Address:?1348 high bluff cir
City:?Park City
State / Province:?UT
Postal Code:?84060
Country:?United States
Phone:?1-435-214-1857
Email:?dkarapoulos@gmail.com

Now, that might not be the main site — the Global Cash Code site has hidden its owner, so you can’t tell, but who knows? ?That said, I can’t find another one. ?Maybe Mr. Karapoulos knows something about this misuse of Mr. Buffett’s name, likeness, and reputation.

Full disclosure: my clients and I own shares of BRK/B

How to Turn $25K into $35B (sort of)

How to Turn $25K into $35B (sort of)

Photo Credit: Nick Ares

-=-=-=-=-=-=-=-=-=-=-=-=-=-=-=-=-

Would you like a 100?million-plus percent return on your money in a little more than four years? You would? Well, it can be done, but there are a couple of catches at the end that may prevent the enjoyment of the unearned riches.

Have a look at this article from Bloomberg.com: A $35 Billion Stock, an SEC Halt and Suspicions of Manipulation. ?Then meander, if you want, to the SEC EDGAR page for Neuromama.

If you read through the documents on Neuromama, it’s not different from what gets done with a penny stock to boost its value, and that is largely because it was a new penny stock when it was formed and started trading over-the-counter four years ago.

So how do you turn a sow’s ear into several billion silk purses? ?Simple:

  • In March 2011, start the?company for $3500. ?35MM shares at $0.001 each.
  • In 2012, sell?720,000 shares @ $0.03 each ($21,600) and go public. ?30x as expensive as the first valuation. ?Initial name is Trance Global.
  • In 2013, change the name to Neuromama, split the stock 750:1, and announce really big plans. ?Total shares: 3.1B+
  • Borrow $370,000?to develop a website, and do a few other things.
  • In late 2013,?acquire a Library of Entertainment Assets including variety shows, feature films, television pilots, etc. Acquire the Assets in exchange for 4,866,180 of new?common shares at a price of $20.55 (the closing price on September 3, 2013) for a total value of $100,000,000. ?The main owner cancels 80% of the?common shares (which belonged to him)?as an aspect of the deal.? (Note: no cash changes hands.) ?Total shares: ?630MM+
  • Never file another financial statement with the SEC. ?Issue occasional 8Ks, and engage in a running dialogue with the SEC over how the development stage company doesn’t earn any money and has negative tangible net worth.
  • Watch occasional minimal trading raise the price of the shares to $56+/sh. ?Market cap exceeds $35 Billion.
  • Watch the SEC halt trading.

In my opinion, buying the intangible assets and attributing a price of $20.55/share for the stock given in exchange?was the critical element of getting the market valuation so high. ?If you look at the graph at Bloomberg.com, and click the 5Y button, you will see that in late 2013 after the exchange was made, the stock price hovered in the $20s. ?(or, click on the image below for a static image of poorer quality abstracted from the Bloomberg website)

NERO_OTC US Stock Quote
Picture Credit: Bloomberg.com

Here is a?market cap of $35 billion for this stock with no business, no appreciable assets, no proprietary technology, no tangible net worth and no income — and can’t even do a few filings with the SEC. ?(It looks like they gave up talking in September 2014.)

So what is it worth? ?My best estimate is zero, to the nearest billion. 😉 ?This is still a cash-starved developmental stage business with no revenues after five or so years. ?It has?had the chance to bootstrap a business together, and there is nothing except the website. ?The price should drop to something near zero when trading resumes.

Even if trading had not been halted, the ability of the owners to realize the value would have been quite limited. ?All they would have had to do is sell a 100,000 shares, and the stock price would collapse, because there is no one out there with $5 million of real cash that wants to buy 0.015% of an empty company like Neuromama. ?The interesting question is “who has been trading the stock,” because it is strictly speculative. ?It is possible that related parties have slowly pushed the price up.

Anyway, this is a good reason to stay away from developmental stage companies — really, anything that doesn’t generate significant revenue. ?It is also a reason to watch the fundamentals of a company rather than the stock chart only, which in this case has run up hard since 2014, but on almost no volume. ?The market capitalization is an illusion if there is nothing that can produce the cash flow to justify it.

Theme: Overlay by Kaira