
What a difference a quarter makes! ?As I said one quarter ago:
Are you ready to earn 6%/year until 9/30/2026? ?The data from the Federal Reserve comes out with some delay. ?If I had it instantly at the close of the third quarter, I would have said 6.37% ? but with the run-up in prices since then, the returns decline to 6.01%/year.
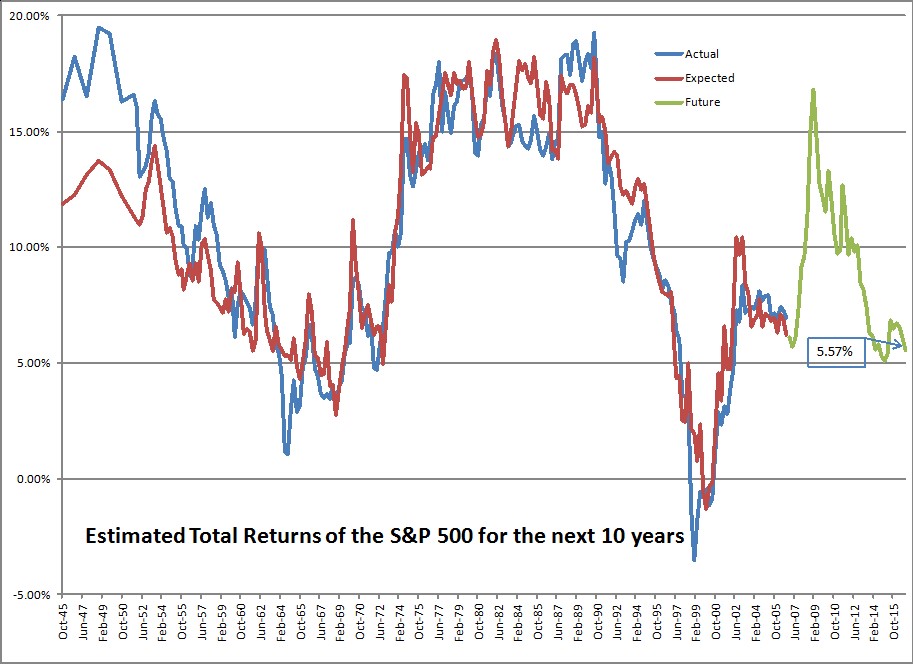
So now I say:
Are you ready to earn 5%/year until 12/31/2026? ?The data from the Federal Reserve comes out with some delay. ?If I had it instantly at the close of the fourth?quarter, I would have said 5.57% ? but with the run-up in prices since then, the returns decline to 5.02%/year.
A one percent drop is pretty significant. ?It stems from one main factor, though — investors are allocating a larger percentage of their total net worth to stocks. ?The amount in stocks moved from 38.00% to 38.75%, and is probably higher now. ?Remember that these figures come out with a 10-week delay.
Remember that the measure in question covers both public and private equities, and is market value to the extent that it can be, and “fair value” where it can’t. ?Bonds and most other assets tend to be a little easier to estimate.
So what does it mean for the ratio to move up from 38.00% to 38.75%? ?Well, it can mean that equities have appreciated, which they have. ?But corporations buy back stock, pay dividends, get acquired for cash which reduces the amount of stock outstanding, and places more cash in the hands of investors. ?More cash in the hands of investors means more buying power, and that gets used by many long-term institutional investors who have fixed mandates to follow. ?Gotta buy more if you hit the low end of your equity allocation.
And the opposite is true if new money gets put into businesses, whether through private equity, Public IPOs, etc. ?One of the reasons this ratio went so high in 1998-2001 was the high rate of business formation. ?People placed more money at risk as they thought they could strike it rich in the Dot-Com bubble. ?The same was true of the Go-Go era in the late 1960s.
Remember here, that average returns are around 9.5%/year historically. ?To be at 5.02% places us in the 88th percentile of valuations. ?Also note that I will hedge what I can if expected 10-year returns get down to 3%/year, which corresponds to a ratio of 42.4% in stocks, and the 95th percentile of valuations. ?(Note, all figures in this piece are nominal, not inflation-adjusted.) ?At that level, past 10-year returns in the equity markets have been less than 1%, and in the short-to-intermediate run, quite poor.)
You can also note that short-term and 10-year Treasury yields have risen, lowering the valuation advantage versus cash and bonds.
I have a few more small things to add. ?Here’s an article from the Wall Street Journal:?Individual Investors Wade In as Stocks Soar. ?The money shot:
The investors? positioning suggests burgeoning optimism, with TD Ameritrade clients increasing their net exposure to stocks in February, buying bank shares and popular stocks such as Amazon.com Inc. and sending the retail brokerage?s Investor Movement Index to a fresh high in data going back to 2010. The index tracks investors? exposure to stocks and bonds to gauge their sentiment.
?People went toe in the water, knee in the water and now many are probably above the waist for the first time,? said JJ Kinahan, chief market strategist at TD Ameritrade.
This is sad to say, but it is rare for a rally to end before the “dumb money” shows up in size. ?Running a small asset management shop like I do, at times like this I suggest to clients that they might want more bonds (with me that’s short and high quality now), but few do that. ?Asset allocation is the choice of my clients, not me. ?That said, most of my clients are long-term investors like me, for which I give them kudos.
Then there is this piece over at Bloomberg.com called:?Wall Street’s Buzz Over ‘Great Leader’ Trump Gives Shiller Dot-Com Deja Vu. ?I want to see the next data point in this analysis, which won’t be available by mid-June, but I do think a lot of the rally can be chalked up to willingness to take more risk.
I do think that most people and corporations think that they will have a more profitable time under Trump rather than Obama. ?That said, a lot of the advantage gets erased by a higher cost of debt capital, which is partly driven by the Fed, and partly by a potentially humongous deficit. ?As I have said before though, politicians are typically limited in what they can do. ?(And the few unlimited ones are typically destructive.)
Shiller’s position is driven at least partly by the weak CAPE model, and the rest by his interpretation of current events. ?I don’t make much out of policy uncertainty indices, which are too new. ?The VIX is low, but hey, it usually is when the market is near new highs. ?Bull markets run on complacency. ?Bear markets plunge on revealed credit risk threatening economic weakness.
One place I will agree with Shiller:
What Shiller will say now is that he?s refrained from adding to his own U.S. stock positions, emphasizing overseas markets instead.
That is what I am doing. ?Where I part ways with Shiller for now is that I am not pressing the panic button. ?Valuations are high, but not so high that I want to hedge or sell.
That’s all for now. ?This series of posts generates more questions than most, so feel free to ask away in the comments section, or send me an email. ?I will try to answer the best questions.
=========================
Late edit: changed bolded statement above from third to fourth quarter.
What goes into the model above?
Nick de Peyster
http://undervaluedstocks.info/
Hi David,
I am a long term investor, but I am sensing that the market could be getting far too high. I am mapping out a schedule for how I will dial back equity exposure based on how high the market gets. I noticed a few weeks ago that you said that you intended to hedge once we got to 2,600. In today’s post you mentioned hedging when estimated returns dropped from the current 5% to 3%. My back-of-the-envelope says that the S&P will be over 2,800 if expected returns drop to 3%. Is that your math too? If so, are you willing to ride the market higher than you previously thought?