Category: Asset Allocation

Happy New Year to my Readers

Happy New Year to my Readers

At the beginning of each calendar year, I sit down and see how my expenses have tracked over the past year.? I make a table and a pie chart to show my wife.? She is always amazed at how much goes to taxes, though the new amazement is what it takes to put children through college.? We spend some time discussing plans for the next year.? Since my wife is not money-oriented (not a big spender, and focused on teaching the children) this gives her a quick way to get reoriented in our financial situation.

After that, I look at investment income.? 2008 was an unusual year for me in this way: it was the first year in my working life that my net worth fell.? Though painful, at age 48, I’m grateful that I have had a good past.

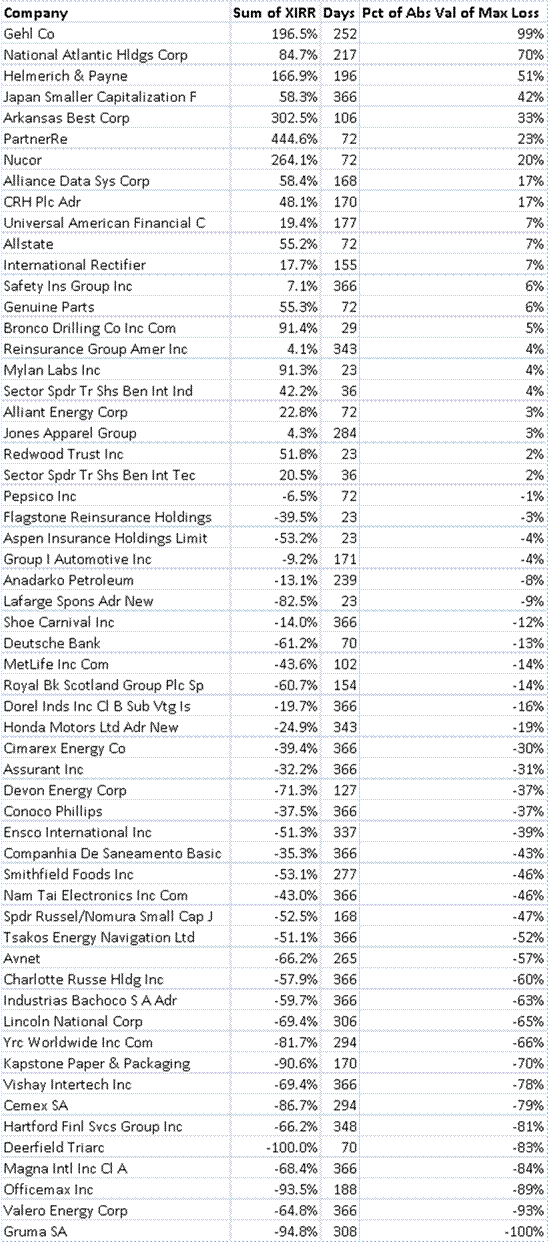
I then look at how individual stocks in the portfolio did.? Here’s a chart for 2008:

The chart is in order from the biggest gain to the biggest loss.? XIRR is the internal rate of return on funds during 2008, and days was the number of days I held a position during 2008.? Needless to say, this was my worst year ever, but I still did better than the S&P 500 by a middling single digit percentage.

That is important to me, because in 2009 I hope to gain my first external client. I have been banging my head against the wall, because I have a small bunch of investors that want to sign on, but they all don’t want to be my first client.? They want to see an institutional investor invest in my fund, then they will invest with me.? Frustrating.

Since strategy inception in 2000, I have beaten the S&P every year except 2007, where I missed by less than a percent.? And, given the performance of many well known value managers in 2008, beating the S&P ain’t bad.

Going back to the table above, I got whacked on names with bad balance sheets, life insurers, and names with too much cyclicality.? I did well on a number of names that I bought cheaply, and particularly on my October reshaping, where I focused on survivability.

I still think survivability is the watchword here.? I’ll be putting out my candidates list for the next reshaping soon, as well as my main industry model, but in an environment like this, raw cheapness doesn’t matter; a company must survive to realize the discount on its valuation.? Remember, the main rule of value investing is not “buy them cheap,” is not “lowest average cost wins,” but is “margin of safety.”

One more note: the present portfolio “long only” portfolio is 22% cash.? That is the highest level in eight years.? I have raised cash into the recent rally through my normal rebalancing discipline.? I will deploy cash as I get opportunity into strong names with strong balance sheets.

Asset Allocation

I also look at our asset allocation.? Excluding our house (no mortgage), it looks like this:

  • 30% Cash and TIPS
  • 20% International Stocks
  • 18% Large Cap US Stocks
  • 17% Small Cap US Stocks
  • 15% Private Equity

I have no debts, but I have eight liabilities, two of which are going to college, and six of which might do so.? That is my main financial challenge for the next fifteen years (the little one is almost seven, and what a cutie.)

Even though I am bearish, I am comfortable with the amount of risk that I am taking, partly because I may derive a business from it through my ability to pick stocks that do relatively well.? The private equity is illiquid, but in this environment even it is doing well — having clever businessmen as friends is a help.

Recent Changes

Here’s a list of my moves since the last time I wrote:

Outright Sale — Gruma SA

Swap — Bought Japan Smaller Capitalization Fund, sold SPDR Russell Nomura Small Cap Japan? (The CEF was trading at an extreme discount)

Rebalancing Sales

  • Assurant (3)
  • RGA
  • Valero Energy
  • CRH
  • Magna Automotive
  • Safety Insurance
  • Charlotte Russe
  • Shoe Carnival
  • Devon Energy
  • Japan Smaller Capitalization Fund

Rebalancing Buys

  • Assurant (2)
  • Charlotte Russe (2)
  • Magna Automotive
  • Shoe Carnival
  • Nam Tai Electronics

I also participated in the RGA exchange, where I traded my A shares for B shares when the discount was wide, and received RGA shares one-for-one when the exchange was complete.

Blog News

I have several book reviews coming, including one on Technical Analysis, and one on how wealthy people got that way.? I also have a panoply of other article ideas:

  • How the lure of free money corrupts politicians
  • Setting up mutual banks
  • The risk of no significant change (not yes we can, but, why do we need to change?)
  • Hidden correlations
  • The mercantilists lost
  • Analyzing TIPS
  • Momentum strategies
  • Buybacks
  • Confidence means keeping assets inflated
  • How securitization could aid resolution of our current crisis

It is a lot of fun writing this weblog.? I enjoy it a lot.? As I close this note, I would like to thank:

  • Those that read the blog
  • Those that comment here, and send me email (all of which I read, but I can’t answer all of it)
  • Seeking Alpha
  • Others that republish me
  • Those that buy products at Amazon through my site
  • Those that buy blogads at my site
  • Other bloggers that give me good ideas
  • And the firm that employs me, Finacorp, but bears no liability for my mutterings here.

2009 may prove to be a better year than 2008.? If that is not true, we will be rivaling the Great Depression.? That said, there are opportunities even in bad economic environments, and lts see if we can’t make the best of what we do get.? Here is to making the most of our opportunities in 2009.? May the LORD bless us all in our endeavors.

Full disclosure: long COP SBS DIIB.PK MGA IBA XEC VLO TNP JSC NTE VSH SAFT CHIC SCVL HIG RGA HMC ESV KPPC DVN ALL PRE CRH PEP GPC LNT NUE AIZ (yes, that is the complete current portfolio)

Public Pension Plans Doubling Down

Public Pension Plans Doubling Down

I am not a gambler, and I never will be.? I take the risks of a businessman as I invest, and not those of a speculator.? I found it interesting to to read this Wall Street Journal article where public defined benefit pension plans are not fleeing hedge funds.? This is an area where I half agree.? Because the yields of high yield bonds are so high, this is not a time to abandon aggressive strategies.? Rather, it is a time to embrace them, slowly and carefully.

I looked through the database of my writings in the CC at RealMoney, and I found these two comments that fit the moment well.


David Merkel
Avoid Esoteric Diversification
4/13/2006 4:00 PM EDT

This isn’t a burning hot issue at present, but I have been impressed with the increasing amount of money getting thrown at esoteric asset classes by pension plans and endowments, in an attempt to diversify and gain higher total returns. In the intermediate term, it is not sustainable. For now, party on, we are in overshoot mode.

By esoteric asset classes, I mean: commodities, timber, credit default, emerging markets, junk bonds, low-quality stocks, the toxic waste of asset- and mortgage-backed securities, hedge funds and private equity.

Many novel asset classes provide both higher returns and diversification when they are first used. As more and more players get comfortable with it, they buy in, lowering the required total return needed to attract investors, but pushing up returns to pre-existing holders as the price rises.

This can be self-reinforcing for quite a while, with a lot of money blindly flowing in, until some player games the system, selling securities that fail miserably. A panic ensues, and the asset class goes through a maturation process that learns to distinguish quality within the asset class.

With the rise in yields, high quality bonds have been giving holders a hard time in total return terms. But you don’t buy bonds for total returns; you buy them for income, and diversification; they tend to do well when risky assets break down.

I guess my short summary is this: with risky asset classes so highly correlated at present, if you want to diversify, go to high quality bonds, or cash. The theoretical diversification of risky assets based on correlation measures calculated over long time periods is no longer valid.

Position: none

and —


David Merkel
Alternatives to the Terror of Actuarial Funding Targets
9/27/2007 2:57 PM EDT

Jordan, my deep suspicion with respect to the pension plan sponsors is that they are looking at the gap between the yield they can get from investment grade bonds and the yield they need to fund the pension promises, and they realize that they are going to have to make a larger allocation to risky assets. After that, they look at the past track record on public equities, and conclude that they have been hurt by the lack of returns over the past seven years. Then they look at the returns in alternative investments, and say, “What great returns! Why have I been ignoring these? If David Swensen can do it, so can I!”

Well, David Swensen is a bright guy who went to the party early. Alternative investments were truly alternative when he arrived. Today they are mainstream, and some of them have gotten overfished. The plan sponsors can allocate all they like to alternatives, but they aren’t magic… they can do just as bad as public equity, and with far less liquidity.

If I were a plan sponsor today, I would begin trimming alternative areas that look crowded, like private equity, commercial real estate, and certain types of hedge funds while the door is still open. For some areas, like CDOs [Collateralized Debt Obligations] the door is already closed.

I would also lower my return expectations, and plan on contributing more. Heresy, I know. But alternatives are over-used, and no longer alternative. They won’t deliver the same high returns in the future that they did in the past.

Position: none

I am not unsympathetic here as public pension plans essentially say, “Well we have to earn enough to meet our actuarial funding targets, and at this point, bonds of the highest quality don’t help us.? Hedge funds promise high returns regardless of market movements, so we need to allocate money there.”

At this point in the cycle, I might have some sympathy, because enough arbitrage relationships are broken, offereing some opportunity.? At the same time, and ordinary investment in a basket of lower investment grade and high yield bonds offers a nice return for those willing to live with some default risk, which is over-discounted here, even with things as bad as they are.

In a bear market, once you have taken a severe amount of damage, the question is “what offers the best return from here?”? The answer might be unpopular, but it should be pursued.? Even as defined benefit managers pursued seeming diversification with bad payoffs as noted above, and should have sought long term guarantees, at a time like now, where guarantees are tremendously expensive, and yields are high? because of possible default, it is a time to take risk, and fund the best entities that may not make it.

These are ugly times, but we have to think like Ben Graham during the Great Depression.? What will survive?? Where can a little bit of additional capital spell the difference between death and survival?

This is a time to take risk.? Things could get worse from here, so don’t overcommit, but don’t fail to commit either.? Make some reasoned judgements about what is likely to do well ten years out, and invest for it.

This is a rough time.? I offer solace to those that are battling the markets; you are having a rough time of it.? The challenge here is whether the risk premium in fixed income assets offers enough compensation versus Treasury quality assets.? My answer is yes, realizing that this is a bumpy trade, and will require patience to receive the returns promised.

My Risk Questionnaire

My Risk Questionnaire

One of my readers asked to see my asset allocation questionnaire. Well, here it is:

Risk Questionnaire

How old are you?

When will you need the money at earliest?

When will you need the money at latest?

Most likely, when will you need the money?

Over the most likely horizon, what rate of return do you want to earn on your money, relative to money market rates and yields on high quality long bonds?

As a percentage of your assets, what is the most you could afford to lose over one year?

As a percentage of your assets, what is the most you could afford to lose over five years?

How closely do you want to watch your investments?? (Daily, Monthly, Quarterly, Annually, Never)

=-=-=-=-=-=-=–=-==-=-=-=-=-=–==-=-=-

When I was the investment actuary in the pension division of Provident Mutual, I would run into investment risk analyses that would make my head spin. My main gripes would revolve around the squishy questions that they would ask, many of which had nothing to do with long term investing.

Thus, my questionnaire. Feel free to use/modify it as you like. I have found that it is very good at sniffing out an investor’s real preferences. The last question also helps me understand the nature of the investor, and how much input/output he wants to have.

Risk tolerance is more a question of time horizon and loss averseness than anything else. Bravery and cowardice play a lesser role, if they even have a role.

What To Do?

What To Do?

Many people have asked me what to do in this market environment, and I have sat and thought about it.? My own personal portfolio is around 60% equities, 15% my home, and 25% cash.

I think probabilistically.? I don’t focus on just one scenario.? I try to balance across a wide number of scenarios, and ask what will do the best.? In a foggy situation like today, that answer is not easy.

I will give you an example.? 8.5 years ago, the leaders of my church came to me and said “Would you invest the money for our congregation’s building fund?”? My initial answer was “no.”? I don’t like investing money for friends, generally.? They came back again, and said, “Please?”? I felt ashamed, and said, “Okay, fill out this risk questionnaire.”? They gave me a series of answers that essentially said, “We don’t know when we need the money, but get a good return for us.”

Ugh.? In May of 2000 went back to Ben Graham’s 50/50 (stocks/bonds), and then adjusted it, taking 10% from the area of the market that I liked worst, and added it to the area I liked best.? I took growth stocks and sold them and bought long term corporate bonds.

Since then I have made further adjustments.? The current portfolio is:

  • 5% Energy stocks (VGENX)
  • 5% Gold stocks (VGPMX)
  • 25% International stocks (VINEX)
  • 25% TIPS (VIPSX)
  • 20% Intermediate Investment Grade Corporates (VFICX)
  • 20% High Yield (VWEHX)

Much as I like Vanguard, I am not endorsing any of their funds here; they are example for asset allocation.? I am very light on US stocks here, and intentionally so.? This portfolio has an anti-inflation bias, and will do better against a weaker dollar.? The corporate bonds, both investment grade and high yield, replace equity exposure.? Corporates are cheap relative to common stocks, and they have better protective characteristics as well.? Though I don’t have any closed-end corporate floating rate funds here, they could be interesting if their leverage was low enough, which isn’t common.? As for the international developed market stocks, a basket of different countries will likely do better than a simple US exposure, even if the dollar continues to fall.

TIPS have been a fatal attraction for me, and I hope to have a post? out in the near term explaining their value in this environment where inflation is negative for now.? My view is that the Fed will eventually monetize the debts they are incurring.? Also, as the dollar gets weaker, inflation will get imported back into the US.

What could go wrong here?? We could have a trade war, or the US government could take actions to protect the value of debt held by foreigners (not likely).? If the equity markets rally, investment grade corporates and high yield will not be far behind, but this portfolio would lag.

No portfolio is perfect.? This one certainly isn’t, but it is my attempt to position for what I view as a lousy economic environment that will eventually yield inflation.

Full disclosure: long VIPSX, and my church long what is listed above

Nonlinear Dynamics in Portfolio Management

Nonlinear Dynamics in Portfolio Management

There have been a lot of articles recently about the poor performance of hedge fund of funds, and hedge funds generally.? I’ve written before on this topic, so if you have a subscription to RealMoney, and want to peruse my earlier pieces on market structure, here they are (with their odd titles, I wanted something more consistent):

Many investment managers seem to not think globally about their businesses.? It becomes: “Follow my process.? Buy and sell securities that my process reveals.? Succeed.? Rake in more money to invest, if my marketing guy is competent.”

Market environments like this reveal the weaknesses inherent in balance sheets of all sorts.? Every investment enterprise, every company, and even you have a balance sheet.? During times of stress, those balance sheets get tested.? Many of them are found wanting, if one can read the writing on the wall. 😉

An investment manager thinking globally, using logic from a source like Co-opetition, or Michael Porter’s Five Forces considers not only his actions, and the actions of securities that he has bought or sold short, but considers in broad the actions of other managers, and companies that he does not own.? He also considers the affairs of his investors, and the stresses they are under.? What if they are under stress, and need to redeem funds at an inopportune time?? What if they pour in money in a frenzy during good times?

It is important, then, to think about how a manager should structure the cash flows of his fund.? How liquid/fungible are the assets?? As with a money market or stable value fund, how much can the book value (what investors can withdraw) differ from the market value (best estimate of what the securities are worth)?

With some open-end real estate funds, they limit redemptions to the amount of cash that can be realized at each withdrawal date, and investors stand in line for the portion of their money that they will receive.? Or, consider hedge funds with illiquid positions.? Many funds, including the famed Citadel, are restricting withdrawals in order to avoid fire sales (or forced buy-ins) of assets.

But there is more to the Co-opetition framework here.? Shouldn’t managers try to estimate if there are too many other managers following their strategies?? With all of the adulation over managing the endowments at Harvard and Yale, isn’t it possible that too many endowment managers got Swensen-envy, and decided to allocate to “alternative assets” at the worst possible time?? That ‘s a reason to be cautious on illiquid alternative asset classes.? You can’t undo the decision without significant costs.? Also, there is greater freedom to mess up, as happened with Calpers on real estate.

Another way to think about it, is that when too many managers pursue the same strategy, in absolute terms, it does not matter if you are the best manager of the strategy.? If too much money is being thrown at the strategy, it will underperform, and the best manager will be carried down with the worst.? The relative performance will be better, but there will still be a likely loss of assets in the “bust phase” of that market.

But in the present environment, we have had the challenge of many managers seeking returns off of every market anomaly that we collectively can imagine.? When a market anomaly gets saturated with enough assets, returns become market-like.? Risk becomes market-like as well, because the investors are subject to needs/fears for cash flow.? In the recent past most anomalies have been saturated.

That is one great reason why so many seemingly unrelated asset classes have become so correlated.? The investor base as a whole diversified, and all of the asset classes are subject to their greed and fear.

Now, there will always be new entrants with novel and profitable theories, but their success will attract imitators, and their returns will decline.? Aleph will give way to Beth, oops, Alpha will decline, and the new methods will correlate with the market as a whole (Beta).

As for hedge fund-of-funds, they suffer from the conceit I described yesterday.? They look at past uncorrelatedness, and presume that past is prologue.? Thus someone with a positive alpha, and uncorrelated returns can get a big allocation, like Mr. Madoff.

As investors, we need to think about the markets as a whole.? We can’t afford the luxury of ignoring the broader picture, as some stock pickers might.? Instead, we need to consider the macro and the micro factors, and when we can find them with any accuracy, the technical factors.

This is not easy to do, and I often fail.? But I would rather be approximately right than precisely wrong.? May it be so for you as well.

The Sterility of Stability

The Sterility of Stability

One of the great conceits in investments is trying to earn above average returns with low variability of returns.? Yet, when you consider the Madoff scandal, it is what can attract a lot of money from credulous investors.

One of the glories of a capitalistic economy is that markets are unstable, they adjust to point out what is no longer needed.? Often the adustments occur violently, because businessmen/consumers chase trends, which can lead to bubbles and bubblettes, until the cash flows of the assets cannot bear the interest flows on the debts that have been created to buy the assets.? Attempts to tame this, such as Alan Greenspan’s aggressive provisions of liquidity just build up more debt for an economywide bubble, followed by a depression.? We got the Great Moderation because of trust in the Greenspan Put.? The Fed would only take away the punchbowl for modest amounts of time, so speculation on debt instruments, real estate, financial institutions, etc., could go on to a much greater degree.? Boom phases would be long; bust phases short and low-impact.

There have been problems with lax regulation of bank underwriting, and investment bank leverage, but the key flaw was mismanagement of the money/credit supply.? Had the Fed held credit tighter during the ’90s and 2000s, we would not be here now.? The Fed could have kept the fed funds rate high, rewarding savings, perhaps leading to a lower cuurent account deficit as well.? Debt growth would have slowed, and securitization, which hates having an inverted or flat yield curve, would have slowed as well.? GDP growth would have been slower, but we would not be facing the crisis we have now.

Or consider housing, and how it became overbuilt because of lax loan underwriting, accommodative monetary policy, and a follow-the-leader mania.? Here’s an old CC post from the era:


David Merkel
Pensions, Energy and Housing
8/18/2005 3:32 PM EDT

1) For those with stable businesses that throw off a lot of earnings and cash flow, and want to dodge the tax man, here’s a possible way to do it, courtesy of the Wall Street Journal: start a defined benefit plan. Disadvantages: complex, relatively illiquid and expensive. Advantages: you can sock away a lot, and defer taxes until you begin taking your benefit, possibly (maybe likely) at lower tax rates.

(This message brought to you courtesy of one actuary who won’t benefit from the message itself… but hey, it helps the profession.)

2) Sea changes in the markets rarely take place in a single day or week. Tops, and changes in leadership tend to take place over months, and feel uncertain. Though Jim is pretty certain that it is time to shift out of energy, I am willing to hang on, and get my opportunities to average down if they come at all. My rebalance points are roughly 20% below current prices anyway, so I’d need a real pullback in order to add.

Though there may be temporary inventory gluts, the basic supply/demand story hasn’t changed, and energy stocks still discount oil prices in the 40s, not the 60s.

3) Contrary to what Jim Cramer wrote in his housing piece today, you can lose it all in housing. Granted, it would be unusual to see homeowners in multiple areas in the country lose their shirts all at the same time; that hasn’t happened since the Great Depression, and we all know that the Great Depression can’t recur, right?

Thing is, local hot real estate markets often revert; if the reversion is bad enough, it leads to foreclosures. Think of Houston in the mid-80s, and Southern California in the early 90s. For that matter, think of CBD real estate in the early 90s… not only did that threaten real estate owners, it did in a number of formerly venerable banks and insurance companies.

Real estate is not a one way street, any more than stocks are. We have never financed as much real estate with as little equity as today before. We have not used financing instruments that are as back-end loaded before. Finally, this speculation is being done on a basis where renting is far cheaper than owning, leaving little support for property prices if the incomes of leveraged homeowners can’t be maintained in a recession. (Oh, that’s right. No more recessions; the Fed has cured that.)

Look, I’m not pointing at any immediate demise of housing in the hot markets. I still think that any trouble is a 2006-7 issue. But this is not a stable situation; if you have a large mortgage relative to your income, make sure your employment situation is really stable. If you can make the payment, prices on the secondary market don’t matter. If you can’t… those prices matter a lot.

One more note: an average investor can sell all of his stocks in the next 20 minutes, with little effect on the market. This is true even in a bad market. In a bad real estate market, you can’t sell; buyers are gunshy — it is akin to what I went through as a corporate bond manager in 2002. There are months where there is no liquidity for some bonds at any reasonable price. So it is for houses in some neighborhoods when half a dozen “for sale” signs go up. No one can sell except at fire sale prices.

None

Well, that’s the macroeconomic problem with stability.? When it gets relied on, after a self-reinforcing boom, it goes away.? Trust in stability is dangerous in other contexts, though.? From another CC post:


David Merkel
Oil and Economic Strength (and a Rant on the Sharpe Ratio)
8/31/2005 3:13 PM EDT

I haven’t really talked about the issue of whether high oil prices portend economic strength or weakness for a good reason. No one knows. There are too many moving parts, and separating out the different effects is impossible; opinions here come down to more of one’s personality (optimist/pessimist) or investment positions (stocks/bonds/energy).

Even if someone did tests using Granger-causality, I’d still be suspicious of the result, whichever way it would point, because of the high probability of finding spurious correlations.

And, speaking of spurious correlations, since Charles Norton brought up the Sharpe ratio, I may as well say that it is a bankrupt concept as commonly used by investment consultants. First, variability is not risk. Losing money over your own personal time horizon is risk (which implies that risk varies for each investor). Second, there is not one type of risk, but many risks. Systematic risk may be measurable in hindsight, but never prospectively.

Third, any measure going off historical values is useless for forecasting purposes, because the values aren’t stable over time. When managers get measured in order for clients to make decisions, they are using the figures for forecasting purposes. It is no surprise that they don’t get good results from the exercise.

Why do figures like a Sharpe ratio gets used, then? Because consultants like simple answers that they can give to their clients, even if the answers yield no insight into the future. (It makes the math really simple, and allows a large number of strategies to be rapidly compared. It eliminates real work and thought.) Investment is a far more messy process than a few simple ratios can illustrate, and those that use these ratios get the results that they deserve.

Finally, an aside. Why am I so annoyed by this? Because of money lost by friends and clients who have been led along this path by investment consultants. There is a real cost to bad ideas.

Position: none

And this CC post as well:


David Merkel
Time Series Regression and Correlation (for wonks only)
7/12/2007 3:11 PM EDT

We’ve had a few discussions here recently involving correlation, so I thought I might post something on the topic. First, it is easy to abuse statistics of all sorts. Few on Wall Street really understand the limitations of the techniques; I have seen them abused many times, often to the tune of large losses.

When comparing multiple time series of any sort, the results can vary considerably if you run the calculation daily, weekly, monthly, quarterly, annually, etc. As you use fewer and fewer observations, the parameters calculated will change. The best estimate will be the one using all available observations, that is, assuming that the underlying processes that generated the time series will be the same in the future as in the past.

It gets worse when comparing the changes in time series. Here moving from daily to weekly to monthly (etc.) can make severe differences in the calculations, because two data series can be almost uncorrelated in the short-run, and very correlated in the long run. My “solution” is that you size your time interval to the time interval over which you make decisions. If daily, then daily, annually, then annually. Again, subject to the limitation that that the underlying processes that generated the changes in time series will be the same in the future as in the past.

But often, the results aren’t stable, because there is no real relationship between the time series being compared. High noise, low signal is a constant problem. Humility in financial statistics is required.

As an example, calculations of beta coefficients often vary significantly when the periodicity of the data changes. People think of beta as a constant, but I sure don’t.

For those who want more on this, there are my two articles, “Avoid the Dangers of Data-Mining,” Part 1 and Part 2.

Enough of this. Back to the roaring markets! Haven’t hit the trading collars yet!

Position: none, but intellectually short Modern Portfolio Theory [MPT]

My point is this: investors look for stable relationships that they can rely on.? Those relationships are precious few.? Sharpe ratios aren’t stable; correlation coefficients aren’t stable; return patterns aren’t stable.? They shouldn’t be stable.? They rely on a noisy economy? which is prone to booms and busts, and industries that are prone to booms and busts.? Seeking stable returns is a fool’s errand.? Warren Buffett has said something to the effect of, “I’d rather have a lumpy 15% return, than a smooth 12% return.”? Though we might mark down those percentages today, the idea is correct, so long as the investor’s time horizon is long enough to average out the lumpiness.

So, if we are going to be capitalists, let’s embrace the idea that conditions will be volatile, more volatile on a regular basis, but given the lower debt levels across the economy because of regular shakeouts, no depressions.? But this would imply:

  • Higher savings rates.
  • Greater scrutiny of balance sheets.
  • Aversion to debt, both personally, and in companies for investment.
  • Less overall financial complexity, and a smaller financial sector.
  • Lower P/Es at banks.
  • Even lower P/Es in non-regulated financials.? It’s a violent world.

For further reading:

A Reason to Sell Stocks Amid the Rally

A Reason to Sell Stocks Amid the Rally

After I wrote the piece on momentum, I thought, “Wait a minute.? Momentum and valuation are stronger together than separate — run the calculations and write a new piece.

That’s what led to this article.? I added valuation metrics to the momentum regressions for one month and one year returns and found they were of little value.

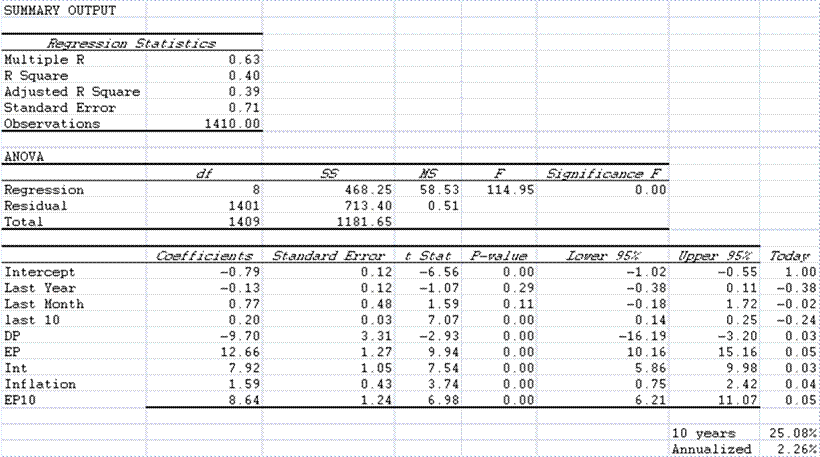
Ouch. Not what I expected, so I tried momentum and valuation variables to predict ten-year returns. The results for the regression were significant.

Some definitions:

  • Last year: total return over the last year for the S&P 500
  • Last month: total return over the last month for the S&P 500
  • Last 10: total return over the last 10 years for the S&P 500
  • DP: dividend yield
  • EP: earnings yield
  • Int: 10-year Treasury yield
  • Inflation: trailing 12-month inflation from the CPI
  • EP10: earnings yield using trailing 10-year earnings.

Trying to forecast ten years into the future, technical variables diminish and fundamental variables show their stuff.? As I have stated before, both current period and long term earnings matter in estimating fair value.? Though I am using Shiller’s data set, it shows that 10-year average earnings are not enough.

That is a big enough finding on its own, but I have something more: using this formula, stocks are expected to earn 2.26%/yr over the next ten years.? After a pathetic decade, do we have another to come?? I(Ask Japan, they have gotten zero over more than 20 years…)

Why might that low return be true?

  • Bad momentum begets bad momentum.
  • Government bond yields are low offering little competition to stocks.
  • Earnings yields still are not high.

Valuations are better than when I wrote the piece, Kiss the Equity Premium Goodbye, but the same problem still exists to a lesser extent.? Where are the projects with high returns on assets that can easily be invested in?? At present, we are not seeing them in bulk.

That is what helps laed me to consider that corporate bonds and bank loans may still be better investments at this point in the cycle — less downside and perhaps a competitive upside.

Book Review: The Only Guide to Alternative Investments You’ll Ever Need

Book Review: The Only Guide to Alternative Investments You’ll Ever Need

I’m taking a brief break from “all crisis, all the time” writing.? I’m backlogged on book reviews, and it is time to write some.

When I get a book on asset allocation, I suck in my gut and say, “Oh no, not another book that falls into the common traps of only relying on past history, and doesn’t consider structural factors….”? I was surprised this time, and I have a book on asset allocation that I can wholeheartedly endorse.

Messrs. Swedroe and Kizer have distinguished between asset classes in sophisticated ways.? With annuities they classify immediate annuities as good, variable annuities as bad, and equity indexed annuities as ugly.? I could not have said it better.

They identify real traps for the retail investor: avoiding the structured product that Wall Street tries to feed retail investors.? They always find new ways to cheat you, encouraging you to sell options that seem cheap, but are quite valuable.

They also describe areas of the asset markets that are less correlated with domestic stocks and bonds — Real Estate, TIPS, Stable Value (I would note the over a long period stable value and bonds do equally well), Commodities, International Stocks, and Immediate Annuities.

Assets that are hybrid between equity and debt tend not to offer much diversification to a balanced core portfolio, so junk bonds, convertible bonds, and preferred stock do not offer much of a diversification advantage.? Similarly, Private Equity is highly correlated with public equity returns over a intermediate-to-long time horizon.? (I would note that any of those assets classes may present relative valuation advantages at certain points in time, and that expert managers can add value, if you can find them.? As for now, high yield is attractive, and there is value in busted convertibles trading for their fixed income value only.)

Hedge funds are difficult to consider as an asset class.? Their is much variability across hedge fund types, and within each type of hedge fund.? There are a lot of difficulties with survivorship bias in analyzing the effectiveness of hedge funds as a group.

The book has several strengths:

  • How do the costs of an asset class affect performance? (e.g. Variable Annuities)
  • How do taxes affect performance? (e.g. covered calls)
  • How does complexity affect performance? (e.g. Structured products)
  • How do personal factors like age and risk averseness affect what products might work well?
  • How does inflation affect performance?

Now, this is only indirectly a book on asset allocation.? It is not going to give you a set of procedures to tell you how to analyze your personal situation, the relative attractiveness of various classes at present, and the macroeconomic environment, and calculate a reasonable asset allocation for yourself, your DB plan, or endowment.? But it will give you the necessary building blocks to see how each alternative asset class fits into an overall asset allocation.

If you want to, you can buy it here: The Only Guide to Alternative Investments You’ll Ever Need: The Good, the Flawed, the Bad, and the Ugly

PS — Remember, I don’t have a tip jar, but I do do book reviews.? If you enter Amazon through a link on my site and buy things from them, I get a small commission, and you don’t pay anything extra.? Such a deal if you wanted to get it anyway…

What is a Depression?

What is a Depression?

Before I try to explain what a Depression is, let me explain what a bubble is.? A bubble is a self-reinforcing boom in the price of an asset class, typically caused by cheap financing,? with the term of liabilities usually shorter than the lifespan of the asset class.

But, before I go any further, consider what I wrote in this vintage CC post:


David Merkel
Bubbling Over
1/21/05 4:38 PM?ET
In light of Jim Altucher’s and Cody Willard’s pieces on bubbles, I would like to offer up my own definition of a bubble, for what it is worth.A bubble is a large increase in investment in a new industry that eventually produces a negative internal rate of return for the sector as a whole by the time the new industry hits maturity. By investment I mean the creation of new companies, and new capital-raising by established companies in a new industry.This is a hard calculation to run, with the following problems:

1) Lack of data on private transactions.
2) Lack of divisional data in corporations with multiple divisions.
3) Lack of data on the soft investment done by stakeholders who accept equity in lieu of wages, supplies, rents, etc.
4) Lack of data on corporations as they get dissolved or merged into other operations.
5) Survivorship bias.
6) Benefits to complementary industries can get blurred in a conglomerate. I.e., melding “media content” with “media delivery systems.” Assuming there is any synergy, how does it get divided?

This makes it difficult to come to an answer on “bubbles,” unless the boundaries are well-defined. With the South Sea Bubble, The Great Crash, and the Nikkei in the 90s, we can get a reasonably sharp answer — bubbles. But with industries like railroads, canals, electronics, the Internet it’s harder to come to an answer because it isn’t easy to get the data together. It is also difficult to separate out the benefits between related industries. Even if there has been a bubble, there is still likely to be profitable industries left over after the bubble has popped, but they will be smaller than what the aggregate investment in the industry would have justified.

To give a small example of this, Priceline is a profitable business. But it is worth considerably less today than all the capital that was pumped into it from the public equity markets, not even counting the private capital they employed. This would fit my bubble description well.

Personally, I lean toward the ideas embedded in Manias, Panics, and Crashes by Charles Kindleberger, and Devil take the Hindmost by Edward Chancellor. From that, I would argue that if you see a lot of capital chasing an industry at a price that makes it compelling to start businesses, there is a good probability of it being a bubble. Also, the behavior of people during speculative periods can be another clue.

It leaves me for now on the side that though the Internet boom created some valuable businesses, but in aggregate, the Internet era was a bubble. Most of the benefits seem to have gone to users of the internet, rather than the creators of the internet, which is similar to what happened with the railroads and canals. Users benefited, but builders/operators did not always benefit.

none

Bubbles are primarily financing phenomena.? The financing is cheap, and often reprices or requires refinancing before the lifespan of the asset.? What’s the life span of an asset?? Usually quite long:

  • Stocks: forever
  • Preferred stocks: maturity date, if there is one.
  • Bonds: maturity date, unless there is an extension provision.
  • Private equity: forever — one must look to the underlying business, rather than when the sponsor thinks he can make an exit.
  • Real Estate: practically forever, with maintenance.
  • Commodities: storage life — look to the underlying, because you can’t tell what financing will be like at the expiry of futures.

Financing terms are typically not locked in for a long amount of time, and if they are, they are more expensive than financing short via short maturity or floating rate debt.? The temptation is to choose short-dated financing, in order to make more profits due to the cheap rates, and momentum in asset prices.

But was this always so?? Let’s go back through history:

2003-2006: Housing bubble, Investment Bank bubble, Hedge fund bubble.? There was a tendency for more homeowners to finance short.? Investment banks rely on short dated “repo” finance.? Hedge funds typically finance short through their brokers.

1998-2000: Tech/Internet bubble.? Where’s the financing?? Vendor terms were typically short.? Those who took equity in place of rent, wages, goods or services typically did so without long dated financing to make up for the loss of cash flow.? Also, equity capital was very easy to obtain for speculative ventures.

1998: Emerging Asia/Russia/LTCM.? LTCM financed through brokers, which is short-dated.? Emerging markets usually can’t float a lot of long term debt, particularly not in their own currencies.? Debts in US Dollars, or other hard currencies are as bad as floating rate debt,? because in a crisis, it is costly to source hard currencies.

1994: Residential mortgages/Mexico: Mexico financed using Cetes (t-bills paying interest in dollars).? Mortgages?? As the Fed funds rates screamed higher, leveraged players were forced to bolt.? Self-reinforcing negative cycle ensues.

I could add in the early 80s, 1984, 1987, and 1989, where rising short rates cratered LDC debt, Continental Illinois, the bond and stock markets, and banks and commerical real estate, respectively. That’s how the Fed bursts bubbles by raising short rates.? Consider this piece from the CC:


David Merkel
Gradualism
1/31/2006 1:38 PM EST

One more note: I believe gradualism is almost required in Fed tightening cycles in the present environment — a lot more lending, financing, and derivatives trading gears off of short rates like three-month LIBOR, which correlates tightly with fed funds. To move the rate rapidly invites dislocating the markets, which the FOMC has shown itself capable of in the past. For example:

  • 2000 — Nasdaq
  • 1997-98 — Asia/Russia/LTCM, though that was a small move for the Fed
  • 1994 — Mortgages/Mexico
  • 1989 — Banks/Commercial Real Estate
  • 1987 — Stock Market
  • 1984 — Continental Illinois
  • Early ’80s — LDC debt crisis
  • So it moves in baby steps, wondering if the next straw will break some camel’s back where lending has been going on terms that were too favorable. The odds of this 1/4% move creating such a nonlinear change is small, but not zero.

    But on the bright side, the odds of a 50 basis point tightening at any point in the next year are even smaller. The markets can’t afford it.

    Position: None

    Bubbles end when the costs of financing are too high to continue to prop up the inflated value of the assets.? Then a negative self-reinforcing cycle ensues, in which many things are tried in order to reflate the assets, but none succeed, because financing terms change.? Yield spreads widen dramatically, and often financing cannot be obtained at all.? If a bubble is a type of “boom phase,” then its demise is a type of bust phase.

    Often a bubble becomes a dominant part of economic activity for an economy, so the “bust phase” may involve the Central bank loosening rates to aid the economy as a whole.? As I have explained before, the Fed loosening monetary policy only stimulates parts of the economy that can absorb more debt.? Those parts with high yield spreads because of the bust do not get any benefit.

    But what if there are few or no areas of the economy that can absorb more debt, including the financial sector?? That is a depression.? At such a point, conventional monetary policy of lowering the central rate (in the US, the Fed funds rate) will do nothing.? It is like providing electrical shocks to a dead person, or trying to wake someone who is in a coma. In short: A depression is the negative self-reinforcing cycle that follows a economy-wide bubble.

    Because of the importance of residential and commercial real estate to the economy as a whole, and our financial system in particular, the busts there are so big, that the second-order effects on the financial system eliminate financing for almost everyone.

    How does this end?

    It ends when we get total debt as a fraction of GDP down to 150% or so.? World War II did not end the Great Depression, and most of the things that Hoover and FDR did made the Depression longer and worse.? It ended because enough debts were paid off or forgiven.? At that point, normal lending could resume.

    We face a challenge as great, or greater than that at the Great Depression, because the level of debt is higher, and our government has a much higher debt load as a fraction of GDP than back in 1929.? It is harder today for the Federal government to absorb private sector debts, because we are closer to the 150% of GDP ratio of government debts relative to GDP, which is where foreigners typically stop financing governments. (We are at 80-90% of GDP now.)

    We also have hidden liabilities through entitlement programs that are not reflected in the overall debt levels.? If I reflected those, the Debt to GDP ratio would be somewhere in the 6-7x GDP area. (With Government Debt to GDP in the 4x region.)

    We are in uncharted waters, held together only because the US Dollar is the global reserve currency, and there is nothing that can replace it for now.? In the short run, as carry trades collapse, there is additional demand for Yen and US Dollar obligations, particularly T-bills.

    But eventually this will pass, and foreign creditors will find something that is a better store of value than US Dollars.? The proper investment actions here depend on what Government policy will be.? Will they inflate away? the problem?? Raise taxes dramatically?? Default internally?? Externally?? Both?

    I don’t see a good way out, and that may mean that a good asset allocation contains both inflation sensitive and deflation sensitive assets.? One asset that has a little of both would be long-dated TIPS — with deflation, you get your money back, and inflation drives additional accretion of the bond’s principal.? But maybe gold and long nominal T-bonds is better.? Hard for me to say.? We are in uncharted waters, and most strategies do badly there.

    Last note: if you invest in stocks, emphasize the ability to self-finance.? Don’t buy companies that will need to raise capital for the next three years.

    Sell Stocks, Buy Corporate Bonds

    Sell Stocks, Buy Corporate Bonds

    I have lots of models, but I am only one person, so some of my models sit idle becuase I don’t have time to update them.? Well, today, as I was reading Barron’s, I ran across the “Current Yield” column, and read this:

    THE STOCK MARKET IS PRICED FOR a recession, but the bond market is priced for a depression. So says Rob Arnott, the brainiac who heads Research Affiliates, an institutional advisory.

    That’s not hyperbole. Corporate bonds rated Baa or triple-B, the low end of investment grade by Moody’s and Standard & Poor’s designations, offer the biggest yield premium since the early 1930s, notes RBC Capital Markets.

    That’s a problem for pulling the economy out of the credit crisis, but an opportunity for investors. Indeed, investment-grade corporates with near-record premiums arguably offer better return potential than common stocks, especially relative to their risks. “I haven’t seen this many markets offering double-digit opportunities since 1989-90 or ever so briefly in 2002,” says Arnott.

    Part of it reflects the sheer weight of numbers. Corporates rated Baa yield about 550 basis points (5.5 percentage points) more than comparable Treasuries, nearly half again the spread in the 2002 post-WorldCom-Enron debacle and twice the average of post-war recessions.

    You have to go back to the early 1930s, when Baa corporates yielded 700 basis points over Treasuries, to find a comparable situation. And notwithstanding all the hyperventilation in the media that this is worst financial crisis since the Great Depression, there’s never been such a full-court response to the threat of debt deflation — the $700 billion TARP, the bailout of Fannie Mae and Freddie Mac, the likelihood of trillion-dollar deficits and a doubling in the Federal Reserve’s balance sheet in just over two months.

    I know things are bad in the corporate bond market, but I didn’t think it was that bad.? This made me ask, “Hmm… what about my stocks versus bonds model?”? That article is one of my better ones; a lot of time and effort got poured into that.? So, I sat down and re-engineered the model, since, embarrassingly, the original model was lost.

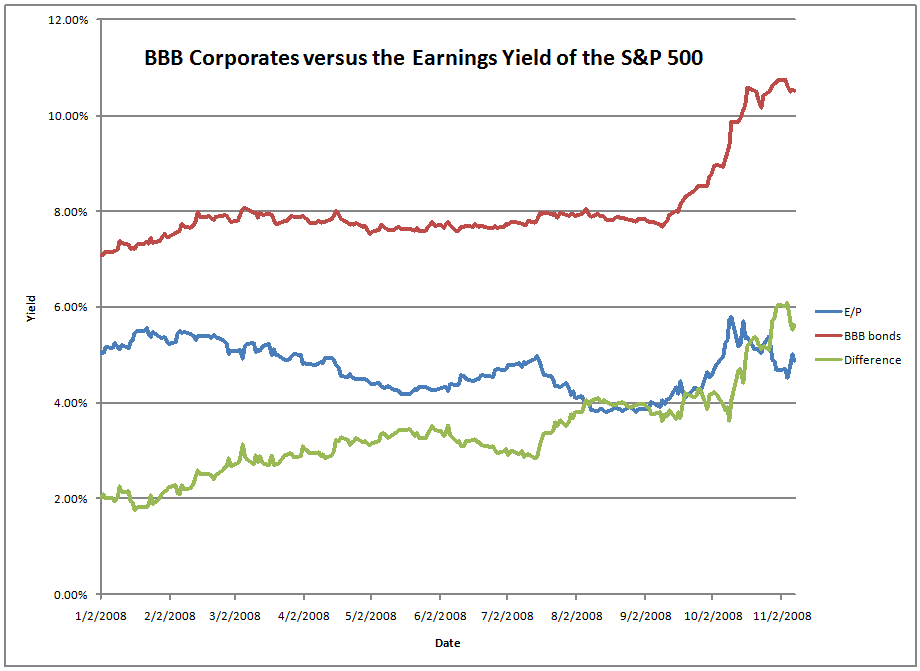
    The key question is whether the yield on BBB corporates is more than 3.9% higher than the earnings yield on the S&P 500.? The answer is yes, and that means we should sell stocks and buy corporate bonds.? But, here is the embarrassing thing for me.? The first recent signal to sell stocks and buy bonds came in mid-August, but since I didn’t track the model regularly, I missed that.? Since the original model worked off monthly data, even selling in early September would have preserved a lot of value.? It is not as if corporate bonds have done well since August, but they have done much better than the S&P 500.

    Here’s a graph summarizing 2008 via my model:

    When the green line goes over 3.9%, it is time to buy corporate bonds. That is not a frequent occurrence; this model gives of signals only a few times per decade. Check out my original piece for more details.

    So, with that, I offer my conclusions:

    • It is still time to allocate money to corporate bonds versus equities.? Where I have flexibility with my own money, I am allocating money away from Equity and to BBB investment grade and high yield corporates.
    • Though there are a lot of reasons to worry, corporate yield spreads discount a lot of trouble.
    • The model indicates a fair value of the S&P 500 at around 700.? Uh, I’m not predicting that, but if we hang around at yield levels like this for long, yes, the equity market will adjust to the competition.? More likely is the equity market treads water while corporates rally.
    • A caveat I toss out is that all areas of the credit markets where the government is not meddling are disproportionately hurt, because investors are fleeing toward guaranteed areas.? Thus, corporates are hurting.
    • College endowments and other investors that hate to buy conventional assets should consider corporates now.? It is my bet that a portfolio of low investment grade and junk grade corporates will outperform a 60/40 portfolio of Stocks and T-Notes.
    • If you have the freedom to sell protection on a broad basket of corporates, this might be a good time to do it, when everyone else is scared to death.? Time to insure corporate credit, perhaps.
    • One more caveat before I am done.? The rule has only been tested on data since 1953.? It is not depression-proof.??? I hope to gather the data from that era and validate the formula, but that will be difficult.

    So, be careful out there, and remember that corporate bonds typically do better than stocks in a prolonged bear market for credit.? Yield levels like the present typically bode well for corporate bonds versus stocks.

    Theme: Overlay by Kaira