Category: Bonds

Retirement ? A Luxury Good

Retirement ? A Luxury Good

Photo Credit: 401kcalculator.org

Recently I was approached by Moneytips to ask my opinions about retirement. They sent me a long survey of which I picked a number of questions to answer. You can get the benefits of the efforts of those writing on this topic today in a free e-book, which is located here: http://www.moneytips.com/retiree-next-door-ebook.??The eBook will be available free of charge?through September 30th. ?I have a few quotes in the eBook.

Before I move onto the answers, I would like to share with you an overview regarding retirement, and why current and future generations are unlikely to enjoy it to the degree that the generations prior to the Baby Boomers did.

The first thing to remember is that retirement is a modern concept. That the world existed without retirement for over 5000 years may mean that it is not a necessary institution. For a detailed comment on this, please consult my article, “The Retirement Tripod: Ancient and Modern.” Here’s a quick summary:

In the old days, when people got old, they worked a reduced pace. They relied on their children to help them. Finally, they relied on savings.

Savings is the difficult concept. How does one save, such that what is set aside retains its value, or even grows in value?

If you go backwards 150 years or further in time, there weren’t that many ways to save. You could set aside precious metals, at the risk of them being stolen. You could also invest in land, farm animals, and tools, each of which would be the degree of maintenance and protection in order to retain their value. To the extent that businesses existed, they were highly personal and difficult to realize value from in a sale. Most businesses and farms were passed on to their children, or dissolved at the death of the proprietor.

In the modern world we have more options for when we get old ? at least, it seems like we have more options. In retirement, we have three ways to support ourselves: we have government security programs, corporate security programs, and personal savings.

Quoting from an earlier article of mine, Many Will Not Retire; What About You?:

Think of this a different way, and ignore markets for a moment.? How do we take care of those that do not work in society?? Resources must be diverted from those that do work, directly or indirectly, or, we don?t take care of some that do not work.

Back to?markets: Social Security derives its ways of supporting those that no longer work from the wages of those that do work.? That?s one reason to watch the ratio of workers to retired.? When that ratio gets too low, the system won?t work, no matter what.? The same applies to Medicare.? With a population where growth is slowing, the ratio will get lower. If the working population is shrinking, there is no way that benefits for those retiring will be maintained.

Pensions tap a different sort of funding.? They tap the profit and debt servicing streams of corporations and other entities.? Indirectly, they sometimes tap the taxpayer, because of the Pension Benefit Guaranty Corporation, which guarantees defined benefit pensions up to a limit.? There is no explicit taxpayer backstop, but in this era of bailouts, who can tell what will be guaranteed by the government in a crisis?

That said, not many people today have access to Defined-Benefit pensions. Those are typically the province of government workers and well-funded corporations. That leaves savings as the major way that most people fund retirement aside from Social Security.

One of the reasons why the present generations are less secure than prior generations with respect retirement is that the forebears who originally set up defined-benefit pensions and Social Security system set up in such a way that they gave benefits that were too generous to early participants, defrauding those who would come later. Though the baby boomers are not blameless here, it is their parents that are the most blameworthy. If I could go back in time and set things right, I would’ve set the defined-benefit pension funding rules to set aside considerably more assets so that funding levels would’ve been adequate, and not subject to termination as the labor force aged.

I also would’ve required the US government to set benefits at a level equal to that contributed by each generation, and given no subsidy to the generations at the beginning of the system. Truth, I would eliminate the Social Security system and Medicare if I could. I think it is a bad idea to have collective support programs. There are many reasons for that, but a leading reason is that it removes the incentive to marry and have children. Another reason is that it politicizes generational affairs, which will become obvious to the average US citizen over the next 10 to 15 years.

Back to Savings

As for personal savings today we have more options than our great-great-great-grandparents did 150 years ago. We can still buy land and we can still store precious metals ? both of those have a great ability to retain value. But, we can buy shares in businesses and we can buy the debt claims of others. We can also build businesses which we can sell to other people in order to fund our retirement.

But investing is tricky. With respect to lending, default is a significant risk. Also, at the end of the term of lending, what will the money be worth? We have to be aware of the risks of inflation and deflation.

In evaluating businesses more generally, it is difficult to determine what is a fair price to pay. In a time of technological change, what businesses will survive? Will the business managers be clever enough to make the right changes such that the business thrives?

You have an advantage that your parents did not have, though. You can invest in the average business and debt of public companies in the US, and around the world through index funds. This is not foolproof; in fact, this is a pretty new idea that has not been tested out. But at least this offers the capability of opening a fraction of the productive assets in our world, diversified in such a way that it would be difficult that you end up with nothing, unless the governments of the world steal from the custodians of the assets.

With that, I leave you to read my answers to some of the questions that were posed to me regarding retirement:

What is a safe withdrawal rate?

A safe withdrawal rate is the lesser of the yield on the 10 year treasury +1%, or 7%. The long-term increase in value of assets is roughly proportional to something a little higher than where the US government can borrow for 10 years. That’s the reason for the formula. Capping it at 7% is there because if rates get really high, people feel uncomfortable taking so much from their assets when their present value is diminished.

How should you handle a significant financial windfall?

If you have debt, and that debt is at interest rates higher than the 10 year treasury yield +2%, you should use the windfall to reduce your debt. If the windfall is still greater than that, treat it as an endowment fund, invest it wisely, and only take money out via the safe withdrawal rate formula.

What are some ways to learn to embrace frugality?

This is a question of the heart. You have to master your desires to have goods and services today that are discretionary in nature. Life is not about happiness in the short term but happiness and long-term. Embrace the concept of deferred gratification that your great-grandparents did and recognize that work and savings provide for a secure and happy future.

How can the average worker start earning passive income?

Passive income is a shibboleth. People look at that as a substitute for investing, because they can’t control investment returns, and they think they can control income.

Income comes from debt or a business. If from debt, it is subject to prepayment or default; it is not certain. Also, income that comes from debt is typically fixed. That income may be sufficient today, but it may not be so if inflation rises. Also your capital is tied up until the debt matures. When the debt matures, reinvestment opportunities may be better or worse than they were when you started.

If income comes from a business, it is subject to all the randomness of that business; it is not certain. It is subject to all of the same problems that an investment in the stock market is subject to, except that you have to oversee the business.

There is no such thing as a truly passive income. Get used to the fact that you will be investing and working to earn an income.

What can those workers who are not employed by a large company or the public sector do to maximize their retirement savings?

You can start an IRA. Until the rules change, you can create healthcare savings account, not use it, and let it accrue tax-free until you’re 59 1/2. Oh, you get an immediate income deduction for that too.

If you are a little more enterprising, you can start your own business. If your business succeeds, there are a lot of ways to put together a pension, deferring more income than an individual can. By the time you get there, the rules will have changed, so I won’t tell you how to do it today; at the time, get a good pension consultant.

Why is calculating how much you’ll need for retirement an important exercise?

You have to understand that retirement is a new concept. In the ancient world, retirement meant continued work at a slower pace on your farm, living off of savings (what little was storable then ? gold, silver, etc.), and help from your children whom you helped previously as you raised them.

Today’s society is far more personal, far less family centered, and far more reliant on corporate and governmental structures. Few of us produce most of the goods and services that we need. We rely on the division of labor to do this.? Older people will still rely on younger people to deliver goods and services, as the older people hand over their accumulated assets in exchange for that.

Practically, modern retirement is an exercise in compromise. You will have to trade off:

  • How long you will work
  • At what you will work
  • What corporate and governmental income plans you participate in
  • How much income with safety your assets can deliver, with an allowance for inflation
  • How much you will help your children
  • How much your children will help you

As such, calculating a simple figure how much your assets should be may be useful, but that one variable is not enough to help you figure out how you should conduct your retirement.

Why don’t more people consult investment professionals? What keeps them from doing so?

There are two reasons: first, most people don’t have enough income or assets for investment professionals to have value to them. Second, people don’t understand what investment professionals can do for them, which is:

  • They can keep you from panicking or getting greedy
  • They can find ways to reduce your tax burdens
  • They can diversify your assets so that you are less subject to large drawdowns in the value of your assets

Other than maximizing your annual contribution, what other things can you do to get the most out of your IRA and 401(k)?

Diversify your investments into safe and risky buckets. The safe bucket should contain high quality bonds. The risky bucket should contain stocks, tilted toward value investing, and smaller stocks. New contributions should mostly feed investments that have been doing less well, because investments tend to mean-revert.

Stocks are clearly risky and investors have emotional reactions to that. How can investors rationally manage their stock investments so that they are less likely to regret their decisions?

When I was a young investor, I had to learn not to panic. I also had to learn not to get greedy. That means tuning out the news, and focusing on the long run. That may mean not looking at your financial statements so frequently.

As for me as a financial professional, I look at the assets that I manage for my clients and me every day, but I have rules that limit trading. I do almost all trading once per quarter, at mid-quarter, when the market tends to be sleepy, and not a lot of news is coming out. When I trade, I am making business decisions that reflect my long-term estimates of business prospects.

Closing

And if that is not enough for you, please consult my piece The Retirement Bubble. ?You can retire if you put enough away for it, but it is an awful lot of money given that present investments yield so little.

Redacted Version of the September 2014 FOMC Statement

Redacted Version of the September 2014 FOMC Statement

Photo Credit: DonkeyHotey
July 2014 September 2014 Comments
Information received since the Federal Open Market Committee met in June indicates that growth in economic activity rebounded in the second quarter. Information received since the Federal Open Market Committee met in July suggests that economic activity is expanding at a moderate pace. This is another overestimate by the FOMC.
Labor market conditions improved, with the unemployment rate declining further. However, a range of labor market indicators suggests that there remains significant underutilization of labor resources. On balance, labor market conditions improved somewhat further; however, the unemployment rate is little changed and a range of labor market indicators suggests that there remains significant underutilization of labor resources. More people working some amount of time, but many discouraged workers, part-time workers, lower paid positions, etc.
Household spending appears to be rising moderately and business fixed investment is advancing, while the recovery in the housing sector remains slow. Household spending appears to be rising moderately and business fixed investment is advancing, while the recovery in the housing sector remains slow. No change


Fiscal policy is restraining economic growth, although the extent of restraint is diminishing. Fiscal policy is restraining economic growth, although the extent of restraint is diminishing. No change.? Funny that they don?t call their tapering a ?restraint.?
Inflation has moved somewhat closer to the Committee’s longer-run objective. Longer-term inflation expectations have remained stable. Inflation has been running below the Committee’s longer-run objective. Longer-term inflation expectations have remained stable. TIPS are showing slightly lower inflation expectations since the last meeting. 5y forward 5y inflation implied from TIPS is near 2.52%, down 0.08% from July.
Consistent with its statutory mandate, the Committee seeks to foster maximum employment and price stability. Consistent with its statutory mandate, the Committee seeks to foster maximum employment and price stability. No change. Any time they mention the ?statutory mandate,? it is to excuse bad policy.
The Committee expects that, with appropriate policy accommodation, economic activity will expand at a moderate pace, with labor market indicators and inflation moving toward levels the Committee judges consistent with its dual mandate. The Committee expects that, with appropriate policy accommodation, economic activity will expand at a moderate pace, with labor market indicators and inflation moving toward levels the Committee judges consistent with its dual mandate. No change.? They can?t truly affect the labor markets in any effective way.
The Committee sees the risks to the outlook for economic activity and the labor market as nearly balanced and judges that the likelihood of inflation running persistently below 2 percent has diminished somewhat. The Committee sees the risks to the outlook for economic activity and the labor market as nearly balanced and judges that the likelihood of inflation running persistently below 2 percent has diminished somewhat since early this year. CPI is at 1.7% now, yoy.? They shade up their view down on inflation?s amount and persistence.
The Committee currently judges that there is sufficient underlying strength in the broader economy to support ongoing improvement in labor market conditions. The Committee currently judges that there is sufficient underlying strength in the broader economy to support ongoing improvement in labor market conditions. No change.
In light of the cumulative progress toward maximum employment and the improvement in the outlook for labor market conditions since the inception of the current asset purchase program, the Committee decided to make a further measured reduction in the pace of its asset purchases. Beginning in August, the Committee will add to its holdings of agency mortgage-backed securities at a pace of $10 billion per month rather than $15 billion per month, and will add to its holdings of longer-term Treasury securities at a pace of $15 billion per month rather than $20 billion per month. In light of the cumulative progress toward maximum employment and the improvement in the outlook for labor market conditions since the inception of the current asset purchase program, the Committee decided to make a further measured reduction in the pace of its asset purchases. Beginning in October, the Committee will add to its holdings of agency mortgage-backed securities at a pace of $5 billion per month rather than $10 billion per month, and will add to its holdings of longer-term Treasury securities at a pace of $10 billion per month rather than $15 billion per month. Reduces the purchase rate by $5 billion each on Treasuries and MBS.? No big deal.


The Committee is maintaining its existing policy of reinvesting principal payments from its holdings of agency debt and agency mortgage-backed securities in agency mortgage-backed securities and of rolling over maturing Treasury securities at auction. The Committee is maintaining its existing policy of reinvesting principal payments from its holdings of agency debt and agency mortgage-backed securities in agency mortgage-backed securities and of rolling over maturing Treasury securities at auction. No change
The Committee’s sizable and still-increasing holdings of longer-term securities should maintain downward pressure on longer-term interest rates, support mortgage markets, and help to make broader financial conditions more accommodative, which in turn should promote a stronger economic recovery and help to ensure that inflation, over time, is at the rate most consistent with the Committee’s dual mandate. The Committee’s sizable and still-increasing holdings of longer-term securities should maintain downward pressure on longer-term interest rates, support mortgage markets, and help to make broader financial conditions more accommodative, which in turn should promote a stronger economic recovery and help to ensure that inflation, over time, is at the rate most consistent with the Committee’s dual mandate. No change.? But it has almost no impact on interest rates on the long end, which are rallying into a weakening global economy.
The Committee will closely monitor incoming information on economic and financial developments in coming months and will continue its purchases of Treasury and agency mortgage-backed securities, and employ its other policy tools as appropriate, until the outlook for the labor market has improved substantially in a context of price stability. The Committee will closely monitor incoming information on economic and financial developments in coming months and will continue its purchases of Treasury and agency mortgage-backed securities, and employ its other policy tools as appropriate, until the outlook for the labor market has improved substantially in a context of price stability. No change. Useless paragraph.
If incoming information broadly supports the Committee’s expectation of ongoing improvement in labor market conditions and inflation moving back toward its longer-run objective, the Committee will likely reduce the pace of asset purchases in further measured steps at future meetings. If incoming information broadly supports the Committee’s expectation of ongoing improvement in labor market conditions and inflation moving back toward its longer-run objective, the Committee will end its current program of asset purchases at its next meeting. Finally the end of QE is in sight.? For now.
However, asset purchases are not on a preset course, and the Committee’s decisions about their pace will remain contingent on the Committee’s outlook for the labor market and inflation as well as its assessment of the likely efficacy and costs of such purchases. However, asset purchases are not on a preset course, and the Committee’s decisions about their pace will remain contingent on the Committee’s outlook for the labor market and inflation as well as its assessment of the likely efficacy and costs of such purchases. No change.
To support continued progress toward maximum employment and price stability, the Committee today reaffirmed its view that a highly accommodative stance of monetary policy remains appropriate. To support continued progress toward maximum employment and price stability, the Committee today reaffirmed its view that a highly accommodative stance of monetary policy remains appropriate. No change.
In determining how long to maintain the current 0 to 1/4 percent target range for the federal funds rate, the Committee will assess progress–both realized and expected–toward its objectives of maximum employment and 2 percent inflation. This assessment will take into account a wide range of information, including measures of labor market conditions, indicators of inflation pressures and inflation expectations, and readings on financial developments. In determining how long to maintain the current 0 to 1/4 percent target range for the federal funds rate, the Committee will assess progress–both realized and expected–toward its objectives of maximum employment and 2 percent inflation. This assessment will take into account a wide range of information, including measures of labor market conditions, indicators of inflation pressures and inflation expectations, and readings on financial developments. No change.? Monetary policy is like jazz; we make it up as we go.? Also note that progress can be expected progress ? presumably that means looking at the change in forward expectations for inflation, etc.
The Committee continues to anticipate, based on its assessment of these factors, that it likely will be appropriate to maintain the current target range for the federal funds rate for a considerable time after the asset purchase program ends, especially if projected inflation continues to run below the Committee’s 2 percent longer-run goal, and provided that longer-term inflation expectations remain well anchored. The Committee continues to anticipate, based on its assessment of these factors, that it likely will be appropriate to maintain the current target range for the federal funds rate for a considerable time after the asset purchase program ends, especially if projected inflation continues to run below the Committee’s 2 percent longer-run goal, and provided that longer-term inflation expectations remain well anchored. No change.? Its standards for raising Fed funds are arbitrary.
When the Committee decides to begin to remove policy accommodation, it will take a balanced approach consistent with its longer-run goals of maximum employment and inflation of 2 percent. When the Committee decides to begin to remove policy accommodation, it will take a balanced approach consistent with its longer-run goals of maximum employment and inflation of 2 percent. No change.
The Committee currently anticipates that, even after employment and inflation are near mandate-consistent levels, economic conditions may, for some time, warrant keeping the target federal funds rate below levels the Committee views as normal in the longer run. The Committee currently anticipates that, even after employment and inflation are near mandate-consistent levels, economic conditions may, for some time, warrant keeping the target federal funds rate below levels the Committee views as normal in the longer run. No change.
Voting for the FOMC monetary policy action were: Janet L. Yellen, Chair; William C. Dudley, Vice Chairman; Lael Brainard; Stanley Fischer; Richard W. Fisher; Narayana Kocherlakota; Loretta J. Mester; Jerome H. Powell; and Daniel K. Tarullo. Voting for the FOMC monetary policy action were: Janet L. Yellen, Chair; William C. Dudley, Vice Chairman; Lael Brainard; Stanley Fischer; Narayana Kocherlakota; Loretta J. Mester; Jerome H. Powell; and Daniel K. Tarullo. Fisher and Plosser dissent.? Finally some with a little courage.
Voting against was Charles I. Plosser who objected to the guidance indicating that it likely will be appropriate to maintain the current target range for the federal funds rate for “a considerable time after the asset purchase program ends,” because such language is time dependent and does not reflect the considerable economic progress that has been made toward the Committee’s goals. Voting against the action were Richard W. Fisher and Charles I. Plosser. President Fisher believed that the continued strengthening of the real economy, improved outlook for labor utilization and for general price stability, and continued signs of financial market excess, will likely warrant an earlier reduction in monetary accommodation than is suggested by the Committee’s stated forward guidance. President Plosser objected to the guidance indicating that it likely will be appropriate to maintain the current target range for the federal funds rate for “a considerable time after the asset purchase program ends,” because such language is time dependent and does not reflect the considerable economic progress that has been made toward the Committee’s goals. Thank you, Messrs. Plosser and Fisher.? But what happens when the economy weakens?

?

Comments

  • Pretty much a nothing-burger. Few significant changes, if any.
  • Despite lower unemployment levels, labor market conditions are still pretty punk. Much of the unemployment rate improvement comes more from discouraged workers, and part-time workers.? Wage growth is weak also.
  • Small $10 B/month taper. Equities rise and long bonds fall.? Commodity prices are flat.? The FOMC says that any future change to policy is contingent on almost everything.
  • Don?t know they keep an optimistic view of GDP growth, especially amid falling monetary velocity.
  • The FOMC needs to chop the ?dead wood? out of its statement. Brief communication is clear communication.? If a sentence doesn?t change often, remove it.
  • In the past I have said, ?When [holding down longer-term rates on the highest-quality debt] doesn?t work, what will they do? I have to imagine that they are wondering whether QE works at all, given the recent rise and fall in long rates.? The Fed is playing with forces bigger than themselves, and it isn?t dawning on them yet.
  • The key variables on Fed Policy are capacity utilization, labor market indicators, inflation trends, and inflation expectations. As a result, the FOMC ain?t moving rates up, absent improvement in labor market indicators, much higher inflation, or a US Dollar crisis.
Making Systematic Risk Disappear, Not

Making Systematic Risk Disappear, Not

Photo Credit: B Gilmour

Yesterday I was at a conference for Registered Investment Advisors. There were about 11 of us in the room, and a variety of different parties pitched us on their services. Some of the pitches were harder, most were softer.

Two of the presentations I felt were deceptive, though I don’t believe the presenters intended to be deceptive. The idea was, you need to provide alternative investments to your clients, because clients can’t earn what they need to in stocks and bonds. Private equity investments and real estate outperform stocks, and we have new durable income vehicles that outperform bonds. What’s more, we can remove a lot of volatility from the portfolio.

Imagine for a moment that you’re investing in two private companies that after you buy them, you will have to own them for 10 years. The money is committed, and you have no way to get liquidity from the companies until the 10 years are up. One of the companies will leverage up a little bit, and invest in stocks. The other company will leverage up a great deal, and invest in bonds; it will behave like a shadow bank.

Now imagine on your brokerage statement, that your broker does not have to mark the positions to market. ?After all, the corporations are not publicly traded and so the companies are valued at the amount of your investment until they dissolve and pay out their proceeds at the end of 10 years.

Does this method of investing limit volatility? It looks like it does, but it really doesn’t. Your investments are subject to all of the vicissitudes of the stock and bond markets, and then some, because the private companies took on some leverage. Though the values may be constant on the accounting statements, the volatility of the investing will be delivered in full at the end of the 10 years.

That’s the way some of these alternatives work, except they get applied not to public stocks and bonds, but private companies, real estate, mortgages, etc. ?They are subject to the same economic forces as the public stocks and bonds, and once you strip out the effect of the additional leverage they perform about the same.

The story was told that this is the way that the wealthy got wealthy, by investing in private corporations, and investing in real estate. This is true as far as it goes except that the wealthy concentrated their investments in a few real estate projects and a few corporations that they themselves actively managed. Those offering alternative products investing in private equity and real estate are investing far more broadly in order to reduce risk. Even if the investments do well, you won’t get wealthy off them, though you might do well.

What is also not mentioned is that many more people who try to become wealthy by concentrating their investments fail. If this were easy, everyone would be doing it. The volatility is not eliminated; far from it, the volatility is amplified, and for those wealthy that succeed, that was the road to wealth for them.

As with public equity and bond investments, you will find that there are talented managers who can outperform the rest. Many of the talented managers in private investments limit the amount they manage, and money from new investors is not welcome. ?The best managers of alternative investments are not open to the public, and not to these private investment middlemen as the conference.

The same logic applies to hedge funds. There are many different types of hedge funds, and performance data for them is dirty. Some managers are good, some are bad, and on average they’re about as good as markets they invest in. As for some of the data abnormalities, the good ones get into the databases before they’re actually taking money from outside clients which overstates the returns to clients. The bad ones exit the databases early, so the returns on their failure do not get reported.

Though some notable managers will do well, average managers will not outperform investments in public stocks and bonds. This is another case where the actual underlying investments matter more than the legal form that the investments take. Private and public investments exist in the same economy and get roughly the same returns. This should be no surprise.

The upshot of what I’m trying to say is that if you are not investing in alternatives, don’t feel bad because you’re not missing anything on average. Just beware slick marketing pitches designed to make you feel inferior because you’re not one of the “cool kids” investing in illiquid private securities. ?After the next bear market, many “cool kids” will find that they lost a lot of money along with everyone else, if their alternatives mature in the bear market.

A Final Note — Fixed Income or Banking Income?

I also believe that income investors in?some of these new approaches will be the most disappointed in the next bear market. When I was a portfolio manager managing mortgage bonds, we had a rule: don’t buy mortgages on operating properties like hotels, marinas, casinos, theaters, etc. When you do that, you cease to be a lender, because the underlying cash flows of the property are not stable enough to support a loan. If you do such a loan, you have a smaller loan that is real, and the rest is an equity investment. ?In a bear market, that “equity investment” could prove worthless.

People will find out this same thing with durable income products, they will prove far more risky than ordinary fixed income investments in the next bear market because they are running a levered lending business. And in the few cases where the business is not levered, the riskiness of the investments is higher than what?would commonly expect.

And thus my counsel is focus on the return of your money, rather than the return on your money. Play it safe with your fixed-income investments.

Goes Down Double-Speed (Update 2)

Goes Down Double-Speed (Update 2)

2791702123_3a088ec05d_z
Photo Credit: hounddiggity

This is the third time I have written this article during this bull market. ?Here are the other two times, with dates:

The first time, we had doubled since the bottom. ?Second time, up 2.5x. ?Now it is a triple since the bottom. ?That doesn’t happen often, and this rally is getting increasingly unusual by historic standards. ?That said, remember that every time a record gets broken, it shows that the prior maximum was not a limit. ?If you think about that, after a bit you know that idea is obvious, but that isn’t the way that many people practically think about extreme statistics.

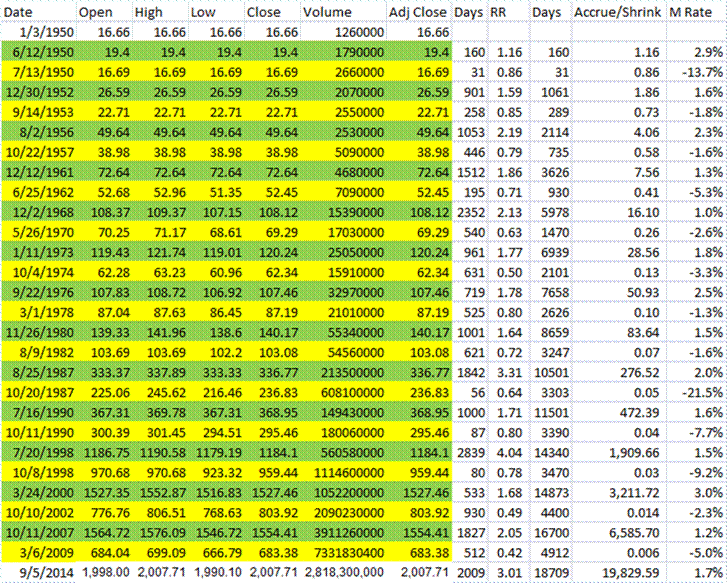
Let’s look at my table, which is the same as the last two times I published, except for the last line:

spx_31294_image002

Since the second?piece, the gains have come slowly and steadily, though faster than between the first and second pieces. ?As I said last time,

In long recoveries, gains first come quickly, then slowly, then near the end they often come quickly again.? Things are coming quickly again now, but who can tell how long it might persist.”

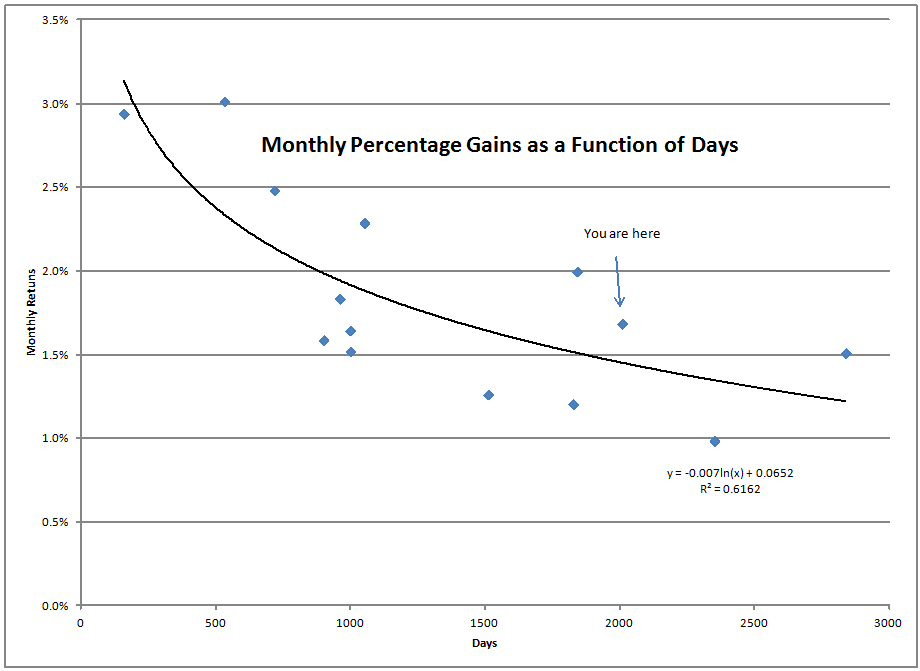
Indeed, and after the first piece, the market did nothing for about 16 months, after which the market started climbing again at a rate of about 1.5% per month for the last 27 months. ?Though not as intense as the rally in the mid-’80s, this is now the third longest rally since 1950, and the third largest. ?It is also the third most intense for rallies lasting 1000 calendar days or more. ?This is a special rally.


spx_8180_image001

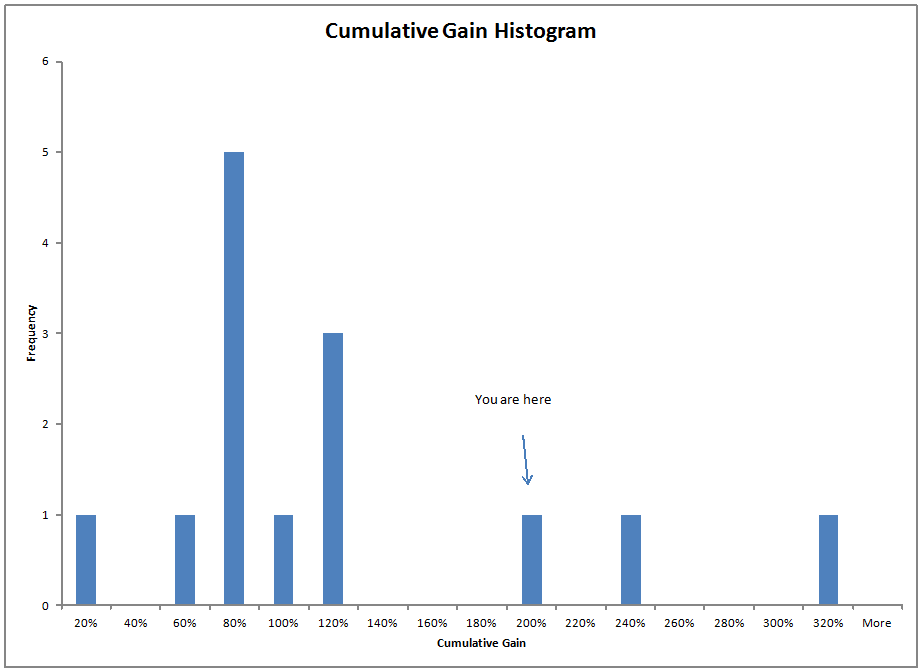
And now look at the cumulative gain:

spx_24509_image001


Does this special rally give us any clues to the future? ?Sadly, no. ?Or maybe, too much. ?Let me spill my thoughts, and you can take them for what they are worth, because I encouraged caution the last two times, and that hasn’t been the winning idea so far.

  1. To top the rally of the ’90s for total size, we would have to see 2700 on the S&P 500.
  2. It is highly unlikely that this rally will top the intensity of that of the ’50s or ’80s. ?Gains from here, if any, are likely to be below the 1.7%/month average so far.
  3. For this rally to set a length record, it would have to last until 12/14/16 (what a date).
  4. Record high profit margins should constrain further growth in the?S&P 500, but that hasn’t worked so far. ?As it is, there are very good reasons for profit margins to be high, because unskilled and semi-skilled labor in the capitalist world is not scarce.
  5. Rallies tend to persist longer when they go at gradual clips of between 1-2%/month. ?Still, all of them eventually die.
  6. At present the market is priced to give 5.5%/year returns over the next 10 years. ?That figure is roughly the 85th percentile of valuations. ?Things are high now, but they have been higher, as in the dot-com bubble. ?We are presently higher than the peak in 2007.
  7. On the negative side, it doesn’t look like the market is pricing in any war risk.
  8. On the positive side, I’m having a hard time finding too many industries that have over-borrowed. ?Governments and US students show moderate?credit risk, as do some industries in the finance and energy sectors.
  9. Finally, the most unusual aspect of this era is how little competition bonds are giving to stocks. ?In my opinion, that idea is getting relied on too heavily for a relative value trade. ?Instead, what we may find is that if bond yields rise, stocks, particularly dividend paying stocks, will get hit. ?By relying on a relative yield judgment for stocks, it places them both subject to the same risks.

I still think that we are on borrowed time, but maybe you need to regard me as a stopped digital clock with a date field, which isn’t even right twice per day. ?Historically, if the rally persists, stock prices should only appreciate at a 8-9% annual rate with the bull this old.

That’s all for now. ?I’m not hedging my equity portfolio yet, but maybe my mind changes near 2300 on the S&P 500, should we get there.

PS — the title comes from the fact that markets move down twice as fast as they go up, so be ready for when the cycle turns. ?The first article in the series focused on that.

The Art of Extracting Large Commissions From Investors

The Art of Extracting Large Commissions From Investors

Photo Credit: dolphinsdock

The dirty truth is that some investments in this life are sold, and not bought. ?The prime reason for this is that many people are not willing to learn enough to save and invest on their own. ?Instead, they rely on others to corral them and say, “You ought to be saving and investing. ?Hey, I’ve got just the thing for you!”

That thing could be:

  • Life Insurance
  • Annuities
  • Front-end loaded mutual funds
  • Illiquid securities like Private REITs, LPs, some Structured Notes
  • Etc.

Perhaps the minimal effort necessary to avoid this is to seek out a fee-only financial planner, and ask him to set up a plan for you. ?Problem solved, unless…

Unless the amount you have is so small that when look at the size of the financial planner’s fee, you say, “That doesn’t work for me.”

But if you won’t do it yourself, and you can’t find something affordable, then the only one that will help you (in his own way) is a commissioned salesman.

Now, to generate any significant commission off of a financial product, there have to be two factors in place: 1) the product must be long duration, and 2) it must be illiquid. ?By illiquid, I mean that either you can’t easily trade it, or there is some surrender charge that gets taken out if the contract is cashed out early.

The long duration of the contract allows the issuer of the contract the ability to take a portion of its gross margins over life of the contract, and pay a large one-time commission to the salesman. ?The issuer takes no loss as it pays the commission, because they spread the acquisition cost over the life of the contract. ?The issuer can do it because it has set up ways of recovering the acquisition cost in almost all circumstances.

Now in some cases, the statements that the investor will get will?explicitly reveal the commission, but that is rare. ?Nonetheless, to the extent that it is required, the first statement will?reveal how much the contractholder would lose if he tries to cash out early. ?(I think this happens most of the time now, but it would not surprise me to find some contract where that does not apply.)

Now the product may or may not be what the person buying it needed, but that’s what he?gets for not taking control of his?own finances. ?I don’t begrudge the salesman his commission, but I do want to encourage readers to put their own best interests first and either:

  • Learn enough so that you can take care of your own finances, or
  • Hire a fee-only planner to build a financial plan for you.

That will immunize you from financial salesmen, unless you eventually become rich enough to use life insurance, trusts, and other instruments to limit your taxation in life and death.

Now, I left out one thing — there are still brokers out there that make their money through lots of smallish commissions by trading a brokerage account of yours aggressively, or try to sell you some of the above products. ?Avoid them, and?let your fee-only planner set up a portfolio of low cost ETFs for you. ?It’s not sexy, but it will do better than aggressive trading. ?After all, you don’t make money while you trade; you make it while you wait.

If you don’t have a fee only planner and still want to index — use half SPY and half AGG, and add funds periodically to keep the positions equal sized. ?It will never be the best portfolio, but over time it will do better than the average account.

One final note before I go: with insurance, if you want to keep your costs down, keep your products simple — use term insurance for protection, and simple deferred annuities for saving (though I would buy a bond ETF rather than insurance in most cases). ?Commissions go up with product complexity, and so do expenses. ?Simple products are easy to compare, so that you know that you are getting the best deal. ?Unless you are wealthy, and are trying to achieve tax savings via the complexity, opt for simple insurance products that will cover basic needs. ?(Also avoid product riders — they are really expensive, even though the additional premiums are low, the likely benefits paid are lower still.)

Peddling the Credit Cycle

Peddling the Credit Cycle

9142514184_9c85b423ae_z Starting again with another letter from a reader, but I will just post his questions in response to this article:

1)?How much emphasis do you put on the credit cycle? I guess given your background rather a great deal, although as a fundamentals guy, I imagine you don?t try and make macro calls.

2) ?What sources do you look at to make estimates of the credit cycle? Do you look at individual issues, personal models, or are there people like Grant?s you follow?

3) Do you expect the next credit meltdown to come from within the US (as your article suggests is possible) or externally?

4)?How do you position yourself to avoid loss / gain from a credit cycle turn? Do you put more?emphasis?on?avoiding loss or looking for profitable speculation (shorts or quality)

1) I put a lot of emphasis on the credit cycle. ?I think it is the governing cycle in the overall economic cycle. ?When some sector of the economy finds itself under credit stress, it has a large impact on stocks in that sector and related areas.

The problem is magnified when that sector is banks, S&Ls and other lending enterprises. ?When that happens, all of the lending-dependent areas of the economy tend to slump, especially those that have had the greatest percentage increase in debt.

There’s a saying among bond managers to avoid the area with the greatest increase in debt. ?That would have kept you out of autos in the early 2000s, Telecoms after that, and Banks/Finance heading into the Financial Crisis. ?Some suggest that it is telling us to avoid the junior energy names now — those taking on a lot of debt to do fracking… but that’s too small to be a significant crisis. ?Question to readers: where do you see debt rising? ?I would add the US Government, other governments, and student loans, but where else?

2) I just read. ?I look for elements of bad underwriting: loosening credit standards, poor collateral, financial entities focused on growth at all costs. ?I try to look at credit spread relationships relative to risks undertaken. ?I try to find risks that are under- and over-priced. ?If I can’t find any underpriced risks, that tells me that we are in trouble… but it doesn’t tell me when the trouble will hit.

I also try to think through what the Fed is doing, and think what might be harmed in the next tightening cycle. ?This is only a guess, but I suspect that emerging markets will get hit again, just not immediately once the FOMC starts tightening. ?It may take six months before the pain is felt. ?Think of nations that have to float short-term debt to keep things going, particularly if it is dollar-denominated.

I would read Grant’s… I love his writing, but it costs too much for me. ?I would rather sit down with my software and try to ferret out what industries are financing with too much debt (putting it on my project list…).

3) At present, I think that an emerging markets crisis is closer than a US-centered crisis. ?Maybe the EU,?Japan, or China will have a crisis first… the debt levels have certainly been increasing in each of those places. ?I think the US is the “least dirty shirt,” but I don’t hold that view strongly, and am willing to be challenged on that.

That last piece on the US was written about the point of the start of the last “bitty panic,” as I called it. ?For a full-fledged crisis in US corporates, we need the current high issuance of??corporates to mature for 2-3 years, such that the cash is gone, but the debts remain, which will be hard amid high profit margins. ?Unless profit margins fall, a crisis in US corporates will be remote.

4) My goal is not to make money off of the bear phase of the credit cycle, but to lose less. ?I do this because this is very hard to time, and I am not good with Tactical Asset Allocation or shorting. ?There are a lot of people that wait a long time for the cycle to turn, and lose quite a bit in the process.

Thus, I tend to shift to higher quality companies that can easily survive the credit cycle. ?I also avoid industries that have recently taken on a lot of debt. ?I also raise cash to a small degree — on stock portfolios, no more than 20%. ?On bond portfolios, stay short- to intermediate-term, and high to medium high quality.

In short, that’s how I view the situation, and what I would do. ?I am always open to suggestions, particularly in a confusing environment like this. ?If you’re not puzzled about the current environment, you’re not thinking hard enough. 😉

Till next time.

The Victors Write the History Books, Even in Finance

The Victors Write the History Books, Even in Finance

319538081_654369b7a2_z


?It ain?t what you don?t know that hurts you, it?s what you know that ain?t so.?

(Attributed to Mark Twain, Will Rogers,?Satchel Paige, Charles Farrar Browne,?Josh Billings,?and a number of others)

A lot of what passes for investment knowledge is history-dependent, and may not serve us well in the future. ?Further, a certain amount of it is misinterpreted, or, those writing about it, even really bright people, don’t understand the hidden assumptions that they are making. ?I’m going to clarify this by commenting on three graphs that I have seen recently — two that I think deceive, and one that I think is accurate. ?Let’s start with one of the two, which come from this article at AAII, interviewing Jeremy Siegel:

9298-figure-1


Leaving aside the difficulties with the data from 1802-1871, there is an implicit assumption of buying and holding that undergirds these statistics. ?Though the lines look really smooth now in hindsight, for those investing at the time they were often scared to death in bear markets, selling out at the worst possible time, and in bull markets, getting greedy at the worst possible time.

Now one might say to me, “But David, forget what happened to individuals. ?As a group, people must made returns like this, because every buyer has a seller — even if some panicked or got greedy, someone had to take the other side of the trade and benefit.” ?True enough, though I am suggesting that average people can’t live with that much volatility. ?Even if you cut 1929-32 in half by being 50/50 Stocks/Treasury Notes, how many people could live with a 40% downdraft without selling out?

But there is another problem: when does cash enter and exit the stock market? ?Hint: it doesn’t happen via secondary trading.

Cash Enters the Stock Market

  • An Initial Public Offering [IPO], secondary IPO, or rights offering leads people to give money to a corporation in exchange for new shares.
  • Employees forgo pay to receive company stock.
  • Shares get issued to suppliers in lieu of cash (common with scammy promoted stocks)
  • Warrants get exercised, and new shares are issued for the price of cash plus warrants.

Cash Exits the Stock Market

  • Cash dividends get paid, and not reinvested in new shares
  • Stock gets bought back for cash
  • Companies get bought out either entirely or partially for cash.

I’m sure there are other ways that cash enters and exits the stock market, but you get the idea. ?It means that cash is exchanged with the company for shares, and vice versa, not the trading that goes on every day. ?Now, here’s the critical question: when do these things happen? ?Is it random?

Well, no. ?Like any other thing in investing, n one is out to do you a favor. ?New stock tends to be offered at a time when valuations are high, and companies tend to be taken private when valuations are low. ?Thus back in the tech bubble, 1998-2000, a lot of cash got soaked up into companies with dubious valuations and business models. ?With a few exceptions, most lost over 90%+. ?Now consider October 2002. ?How many companies IPO’ed then? ?Very few, but?I remember one, Safety Insurance, that came public at the worst possible moment because it had?no other choice. ?Why else would the IPO price be below liquidation value? ?Great opportunity for those who had liquidity at a bad time.

The upshot is that because stock is issued at times that do not favor new investors, and stock is retired at times that do not favor existing investors, the dollar-weighted?returns for stocks in the above graph are overestimated by 1-2%/year. ?Stocks still beat bonds, but not by as much as one would think.

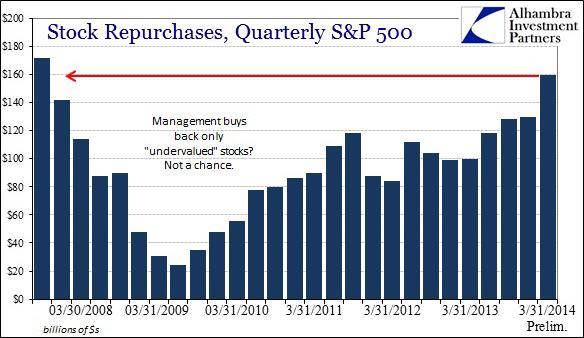
But here’s a counterexample, taken from Alhambra Investment Partners’ blog:

LR-140815-Fig-1

Note that buybacks don’t follow that pattern. ?Corporate managements often exist to justify themselves, and so a great number of them do not behave like value investors when they buy back stock. ?Part of this is that capital seems cheap during the boom phase of the market, and so they lever the company up, issuing debt to buy back stock at high prices. ?It increases earnings in the short-run, but when the bear market comes, the debt hangs ?around, and intensifies the fall in the stock price.

This is why I favor companies that shut off their buybacks at a certain valuation level. ?If they have to dispose of excess cash to avoid takeovers, pay out special dividends… leave the reinvestment issues to shareholders. ?If they buy back stock at levels that are too high, it does not increase the intrinsic value of the firm, though it might keep the price higher for a little while.

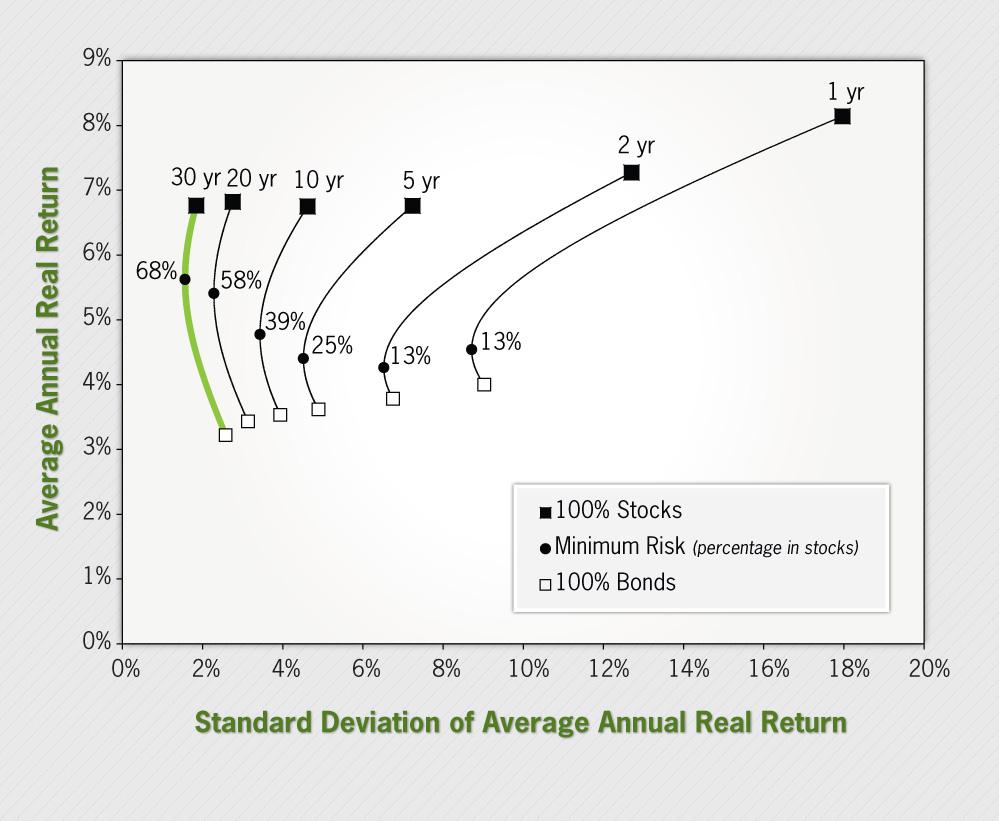
Here’s the other graph??from?this article at AAII, interviewing Jeremy Siegel:

9298-figure-2


What this graph is trying to say is that if you just buy and hold on long enough, results get really, really certain, and investing a lot in stocks reduces your risks, it does not raise your risks.

I’m here to tell you that is an amplification of the past, and maybe not even the best amplification of the past. ?This is where the victors write the history books. ?Your nation is blessed if:

  • You haven’t had war on your home soil.
  • There are no plagues or famines
  • Socialism is kept in check; expropriation is not a risk (note the many countries grabbing pension assets today)
  • Hyperinflation is avoided (we can handle the ordinary inflation)

Any of those, if bad enough, can really dent a portfolio. ?We can have fancy statistics, and draw smooth curves, but that only says that the future?will be like the past, only more so. 😉 ?I try to avoid the idea that?mankind will avoid the worst outcomes out of self-interest. ?There have been enough cases in history where that has not proven true, and envy and revenge dominate over shared prosperity.

I’ve already made the comment on how many can’t bear with short-run volatility. ?There is another factor: when you look at the above graph, it represents the average valuation level, yield curve shape, etc. ?If you are applying this model to today, where credit spreads are low, cash earns nothing, the yield curve is wide, equity valuations are medium-high, you would have to adjust the expected returns to reflect what the likely outcomes are, and the graph would not look as favorable. ?Volatility looks low today, but realized volatility is likely to be higher, and will not likely follow a normal distribution.

Closing

My main point here is to beware of history sneaking in and telling you that stocks are magic. ?Don’t get me wrong, they are very good, but:

  • they?rely on a healthy nation standing behind them
  • their past results are overstated on a dollar-weighted basis, and
  • their past results come from a prosperous time which may not repeat to the same degree in the future
  • you may not have the internal fortitude to buy and hold during hard times.


On Research Sources and Trading Rules

On Research Sources and Trading Rules

6876694340_01a10c613b_z


On a letter from a reader:

In your Industry Ranks August 2014 post you mentioned that you use Value Line analytic tools.

If it is not a secret, what other third-party research and analysis do you use, especially for company analysis (MorningStar, Zacks…)?

Do you rely/subscribed on Interactive Brokers “IBIS Research Essentials?” If yes, do you find it valuable?

In addition, if you do not mind, you said that you make adjustments to your portfolio once in a quarter. Does it mean that you do not look at market quotes during the day at all and, hence, you are not subscribed to IB real-time data (NYSE, Nasdaq, US Bond quotes?)

I would greatly appreciate your answers.

Thank you very much!

I don’t like to spend money on aids for research. ?I can only think of two things that I pay for and actively use:

I do pay for quotes at Interactive Brokers, but because I don’t trade much, I don’t pay for the expensive packages. ?I have not subscribed to?Interactive Brokers “IBIS Research Essentials.”

But many of the best things in life are free. ?My local library offers free Morningstar and Value Line online… I don’t have to leave my home to use it, an it is open all the time. ?If I go two blocks to my library, there is a wealth of business data and books that I can draw upon.

That said, the Web offers a lot of free resources, and I make use of:

  • Yahoo Finance, which I think I have been using since 1996 — pretty close to its inception. ?There is no better place on the web to get business news tagged for each corporation. ?It has gotten better since removing some feeds that have questionable value. ?There’s a great range of information to be had in a wide number of areas.
  • FRED, which just keeps getting better… more data series, more ways to use them… and I have been using them since it was a “bulletin board” (remember those?) back in 1991 or so.
  • Bloomberg.com is excellent in the general and business news areas.
  • Beyond that, Reuters, Marketwatch, the New York Times, and the Financial Times (especially FT Alphaville) have excellent business news coverage. ?With the last two, NYT & FT, you have to decide if you want to pay for it, and I don’t pay for them.
  • When I do my stock research, I generally go to the SEC website and read the documents. ?Then I go to Yahoo Finance and the company’s own website for color.
  • For bonds, bond funds and ETFs, I go to the provider websites, Morningstar, and the Wall Street Journal’s Market Data section. ?I can visit FINRA Trace if I need to see how individual?bonds have been trading.
  • Finally there is a lot of wisdom in many bloggers out there, and I strongly recommend you get to know them. ?Some of the best are expertly curated each day at Abnormal Returns?by Tadas Viskanta.

Now as to your question as to whether I look at prices of assets in my portfolio: in general, I check them 3-5 times a day, usually at a point where I will be switching tasks. ?I sort my stocks two ways at that time:

  1. By absolute percentage change descending — all of the largest movers are at the top of the screen, and I can look for patterns and trends, which may make me check Yahoo Finance for news. ?But that doesn’t make me trade, unless it ends up revealing something that I think will get a lot better or worse, and the market hasn’t figured that out yet. ?(That doesn’t happen often.)
  2. By size of positions — if a position has gotten too large, I trim some back. ?If it has gotten too small, I stop and research why the price has fallen. ?If I am convinced that the stock offers significant returns, and low downside risk, I add a little to the position. ?(See?Portfolio Rule Seven?for more details.) ?In a rare number of cases, about once every two years, I will “double weight” the position that has fallen. ?So far, all of those have worked over the last 14 years. ?But if I realize that the company is unlikely to return anything comparable to the other stocks in my portfolio, I sell it.

Portfolio Rule Seven?trades maybe amount to 3-12 small trades per quarter. ?More trades come when the market is trending, fewer when it is choppy. ?Portfolio Rule Eight?is where I do the big trades once per quarter, comparing each stock in my portfolio against a group of potential replacements. ?I usually sell 2-4 companies, and then buy a similar number of replacements. ?That has my portfolio turn over at a 30%/year rate. ?More details available in the article?Portfolio Rule Eight.

In general, it is wise for both amateur and pro investors to trade by rule. ?Take as much emotion out of the process as possible, and avoid greed and panic. ?It is genuinely rare that decisions have to be made quickly, so take your time, do your analysis, and try to find assets with good long-term prospects.

The Shadows of the Bond Market?s Past, Part II

The Shadows of the Bond Market?s Past, Part II

This is the continuation of?The Shadows of the Bond Market?s Past, Part I. ?If you haven’t read part I, you will need to read it. ?Before I start, there is one more thing I want to add regarding 1994-5:?the FOMC used signals from the bond markets to give themselves estimates of expected inflation. ?Because of that, the FOMC overdid policy, because the dominant seller of Treasuries was not focusing on the economy, but on hedging mortgage bonds. ?Had the FOMC paid more attention to what the real economy was doing, they would not have tightened so much or so fast. ?Financial markets are only weakly?representative of what the real economy is doing; there’s too much noise.

All that said, in 1991 the Fed also overshot policy on the other side in order to let bank balance sheets heal, so let it not be said that the Fed only responds to signals in the real economy. ?(No one should wonder who went through the financial crisis that the Fed has an expansive view of its mandate in practice.)

October 2001

2001 changed America. ?September 11th led to a greater loosening of credit by the FOMC in order to counteract spreading unease in the credit markets. ?Credit spreads were widening quickly as many lenders were unwilling to take risk at a time where times were so unsettled. ?The group that I led?took more risk, and the story is told here. ?The stock market?had been falling most of 2001 when 9/11 came. ?When the markets reopened, it fell hard, and rallied into early 2002, before falling harder amid all of the scandals and weak economy, finally bottoming in October 2002.

The rapid move down in the Fed funds rate was not accompanied by a move down in long bond yields, creating a very steep curve. ?There were conversations among analysts that the banks were healthy, though many industrial firms, like automobiles were not. ?Perhaps the Fed was trying to use housing to pull the economy out of the ditch. ?Industries that were already over-levered could not absorb more credit from the Fed. ?Unemployment was rising, and inflation was falling.

There was no bad result to this time of loosening — another surprise would lurk until mid-2004, when finally the loosening would go away. ?By that time, the stock market would be much higher, about as high as it was in October 2001, and credit spreads tighter.

July 2004

At the end of June 2004, the FOMC did its first hike of what would be 17 1/4% rises in the Fed funds rate which would be monotony interspersed with hyper-interpretation of FOMC statement language adjustments, mixed with the wonder of a little kid in the back seat, saying, “Daddy, when will we get there?” ?The FOMC had good reason to act. ?Inflation was rising, unemployment was falling, and they had just left the policy rate down at 1% for 12 straight months. ?In the midst of that in June-August 2003, there was a another small panic in the mortgage bond market, but this time, the FOMC stuck to its guns and did not?raise rates, as they did for something larger in 1994.

With the rise in the Fed funds rate to 1 1/4%, the rate was as high as it was when the recession bottomed in November 2002. ?That’s quite a long period of low rates. ?During that period, the stock market rallied vigorously, credit spreads tightened, and housing prices rallied. ?Long bonds stayed largely flat across the whole period, but still volatile.

There were several surprises in store for the FOMC and investors as ?the tightening cycle went on:

  1. The stock market continued to rally.
  2. So did housing.
  3. So did long bonds, at least for a time.
  4. Every now and then there were little panics, like the credit convexity panic in May 2005, from a funky long-short CDO bet.
  5. Credit complexity multiplied. ?All manner of arbitrage schemes flourished. ?Novel structures for making money off of credit, like CPDOs emerge. ?(The wisdom of finance bloggers as skeptics grows.)
  6. By the end, the yield curve invests the hard way, with long bonds falling a touch through the cycle.
  7. Private leverage continued to build, and aggressively, particularly in financials.
  8. Lending standards deteriorated.

We know how this one ended, but at the end of the tightening cycle, it seemed like another success. ?Only a few nut jobs were dissatisfied, thinking that the banks and homeowners were over-levered. ?In hindsight, FOMC policy should have moved faster and stopped at a lower level, maybe then we would have had less leverage to work through.

June 2010

15 months after the bottom of the crisis, the stock market has rallied dramatically, with a recent small fall, but housing continues to fall in value. ?There’s more leverage behind houses, so when the prices do finally fall, it gains momentum as people throw in the towel, knowing they have lost it all, and in some cases, more. ?For the past year, long bond yields have gone up and down, making a round-trip, but a lot higher than during late 2008. ?Credit spreads are still high, but not as high as during late 2008.

Inflation is low and volatile, unemployment is off the peak of a few months earlier, but is still high. ?Real GDP is growing at a decent clip, but fitfully, and it is still not up to pre-crisis levels. ?Aside from the PPACA [Obamacare], congress hasn’t done much of anything, and the Fed tries to fill the void by expanding its balance sheet through QE1, which ended in June 2010. Things feel pretty punk altogether.

The FOMC can’t cut the Fed funds?rate anymore, so it relies on language in its FOMC Statement to tell economic actors that Fed funds will be “exceptionally low” for an “extended period.” ?Four months from then, the QE2 would sail, making the balance sheet of the Fed bigger, but probably doing little good for the economy.

The results of this period aren’t fully known yet because we still living in the same essential macro environment, with a few exceptions, which I will take up in the final section.

August 2014

Inflation remains low, but may finally be rising. ?Unemployment has fallen, much of it due to discouraged workers, but there is much underemployment. ?Housing has finally gotten traction in the last two years, but there are many cross-currents. ?The financial crisis eliminated move-up buyers by destroying their equity. ?Stocks have continued on a tear, and corporate credit spreads are very tight, tighter than any of the other periods where the yield curve was shaped as it is now. ?The long bond has had a few scares, but has confounded market participants by hanging around in a range of 2.5%- 4.0% over the last two years.

There are rumblings from the FOMC that the Fed funds rate may rise sometime in 2015, after 72+ months hanging out at 0%. ?QE may end in?a few more months, leaving the balance sheet of the Fed at 5 times its pre-crisis size. ?Change may be upon us.

This yield curve shape tends to happen over my survey period at a time when change is about to happen (4 of 7 times — 1971, 1977, 1993 and 2004), and one where the?FOMC will raise rates aggressively (3 of 7 times — 1977, 1993 and 2004) after fed funds have been left too low for too long. ?2 out of 7 times, this yield curve shape appears near the end of a loosening cycle (1991 and 2001). ?1 out of 7 times it appears before a deep recession, as in 1971. 1 out of 7 times it appears in the midst of an uncertain recovery — 2010. 3?out 7 times, inflation will rise significantly, such as in 1971, 1977 and 2004.

My tentative conclusion is this… the fed funds rate has been too low for too long, and we will see a rapid rise in rates, unless the weak economy chokes it off because it can’t tolerate any significant rate increases. ?One final note before I close: when the tightening starts, watch the long end of the yield curve. ?I did this 2004-7, and it helped me understand what would happen better than most observers. ?If the yield of the long bond moves down, or even stays even, the FOMC probably won’t persist in raising rates much, as the economy is too weak. ?If the long bond runs higher, it might be a doozy of a tightening cycle.

And , for those that speculate, look for places that can’t tolerate or would ?love higher short rates. ?Same for moves in the long bond either way, or wider credit spreads — they can’t get that much tighter.

This is an unusual environment, and as I like to say, “Unusual typically begets unusual, it does not beget normal.” ?What I don’t know is how unusual and where. ?Those getting those answers right will do better than most. ?But if you can’t figure it out, don’t take much risk.

The Shadows of the Bond Market’s Past, Part I

The Shadows of the Bond Market’s Past, Part I

Simulated Constant Maturity Treasury Yields 8-1-14_24541_image001


Source: FRED

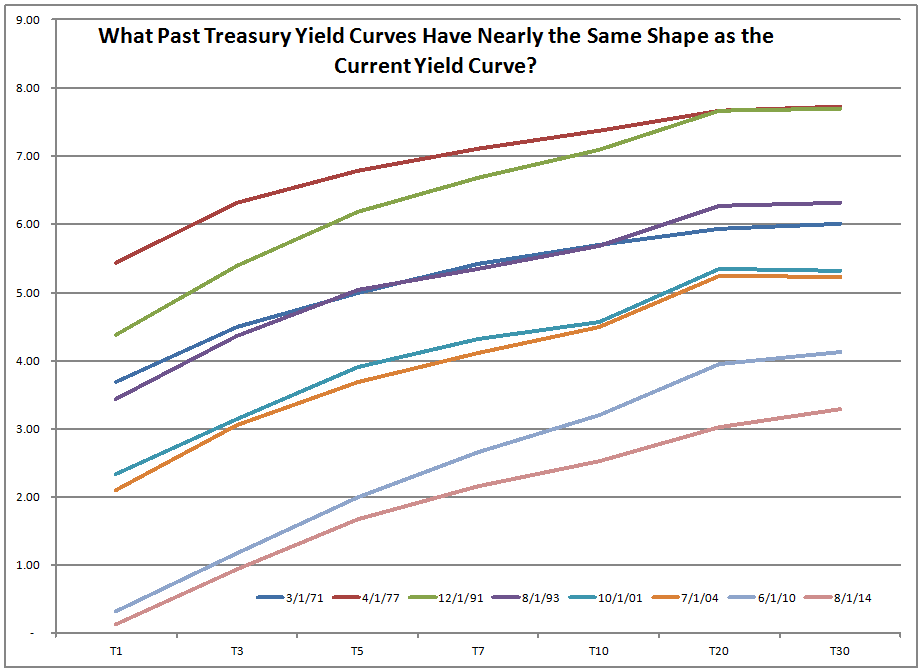
Above is the chart, and here is the data for tonight’s piece:

Date T1 T3 T5 T7 T10 T20 T30 AAA BAA Spd Note
3/1/71 3.69 4.50 5.00 5.42 5.70 5.94 6.01* 7.21 8.46 1.25 High
4/1/77 5.44 6.31 6.79 7.11 7.37 7.67 7.73 8.04 9.07 1.03 Med
12/1/91 4.38 5.39 6.19 6.69 7.09 7.66 7.70 8.31 9.26 0.95 Med
8/1/93 3.44 4.36 5.03 5.35 5.68 6.27 6.32 6.85 7.60 0.75 Med
10/1/01 2.33 3.14 3.91 4.31 4.57 5.34 5.32 7.03 7.91 0.88 Med
7/1/04 2.10 3.05 3.69 4.11 4.50 5.24 5.23 5.82 6.62 0.80 Med
6/1/10 0.32 1.17 2.00 2.66 3.20 3.95 4.13 4.88 6.23 1.35 High
8/1/14 0.13 0.94 1.67 2.16 2.52 3.03 3.29 4.18 4.75 0.57 Low

Source: FRED ? ||| ? ? * = Simulated data value ?||| ?Note: T1 means the yield on a one-year Treasury Note, T30, 30-year Treasury Bond, etc.

Above you see the seven yield curves most like the current yield curve, since 1953. ?The table also shows yields for Aaa and Baa bonds (25-30 years in length), and the spread between them.

Tonight’s exercise is to describe the historical environments for these time periods, throw in some color from other markets,?describe what happened afterward, and see if there might be any lessons for us today. ?Let’s go!

March 1971

Fed funds hits a local low point as the FOMC loosens policy under Burns to boost the economy, to fight rising unemployment, so that Richard Nixon could be reassured re-election. ?The S&P 500 was near an all-time high. ?Corporate yield spreads ?were high; maybe the corporate bond market was skeptical.

1971?was a tough year, with the Vietnam War being unpopular.?Inflation was rising, Nixon severed the final link that the US Dollar had to Gold, an Imposed wage and price controls. ?There were two moon landings in 1971 — the US Government was in some ways trying to do too much with too little.

Monetary policy remained loose for most of 1972, tightening late in the years, with the result coming in 1973-4: a severe recession accompanied by high inflation, and a severe bear market. ?I remember the economic news of that era, even though I was a teenager watching Louis Rukeyser on Friday nights with my Mom.

April 1977

Once again, Fed funds is very near its local low point for that cycle, and inflation is rising. ?After the 1975-6 recovery, the stock market is muddling along. ?The post-election period is the only period of time in the Carter presidency where the economy feels decent. ?The corporate bond market is getting close to finishing its spread narrowing after the 1973-4?recession.

The “energy crisis” and the Cold War were in full swing in April 1977. ?Economically, there was no malaise at the time, but in 3 short years, the Fed funds rate would rise from 4.73% to 17.61% in April 1980, as Paul Volcker slammed on the brakes in an effort to contain rising inflation. ?A lotta things weren’t secured and flew through the metaphorical windshield, including the bond market, real GDP,?unemployment, and Carter’s re-election chances. ?Oddly, the stock market did not fall but muddled, with a lot of short-term volatility.

December 1991

This yield curve is the second most like today’s yield curve. ?It comes very near the end of the loosening that the FOMC was doing in order to rescue the banks from all of the bad commercial real estate lending they had done in the late 1980s. ?A wide yield curve would give surviving banks the ability to make profits and heal themselves (sound familiar?). ?Supposedly at the beginning of that process in late 1990, Alan Greenspan said something to the effect of “We’re going to give the banks a lay-up!” ?Thus Fed funds went from 7.3% to 4.4%?in the 12 months prior to December 1991, before settling out at 3% 12 months later. ?Inflation and unemployment were relatively flat.

1991 was a triumphant year in the US, with the Soviet Union falling, Gulf War I ending in a victory (though with an uncertain future), 30-year bond yields hitting new lows, and the stock market hitting new all time highs. ?Corporate bonds were doing well also, with tightening spreads.

What would the future bring? ?The next section will tell you.

August 1993

This yield curve is the most like today’s yield curve. ?Fed funds are in the 13th month out of 19 where they have been held there amid a strengthening economy. ?The housing market is?doing well, and mortgage refinancing has been high for the last three years, creating a situation where those investing in mortgages securities have a limited set of coupon rates that they can buy if they want to put money to work in size.

An aside before I go on — 1989 through 1993 was the era of clever mortgage bond managers, as CMOs sliced and diced bundles of mortgage payments so that managers could make exotic bets on moves in interest and prepayment rates. ?Prior to 1994, it seemed the more risk you took, the better returns were. ?The models that most used were crude, but they thought they had sophisticated models. ?The 1990s were an era where prepayment occurred at lower and lower thresholds of interest rate savings.

As short rates stayed low, long bonds rallied for two reasons: mortgage bond managers would hedge their portfolios by buying Treasuries as prepayments occurred. ?They did that to try to maintain a constant degree of interest rate sensitivity to overall moves in interest rates. ?Second, when you hold down short rates long enough, and you give the impression that they will stay there (extended period language was used — though no FOMC Statements were made prior to 1994), bond managers start to speculate by buying longer securities in an effort to clip extra income. ?(This is the era that this story (number 2 in this article) took place in, which is part of how the era affected me.)

At the time, nothing felt too unusual. ?The economy was growing, inflation was tame, unemployment was flat. ?But six months later came the comeuppance in the bond market, which had some knock-on effects to the economy, but primarily was just a bond market issue. ? The FOMC hiked the Fed funds rate in February 1994 by one?quarter percent, together with a novel statement issued by Chairman Greenspan. ?The bond market was caught by surprise, and as rates rose, prepayments fell. ?To maintain a neutral market posture, mortgage bond managers sold long Treasury and mortgage bonds, forcing long rates still higher. ?In the midst of this the FOMC began raising the fed funds rate higher and higher as they feared economic growth would lead to inflation, with rising long rates a possible sign of higher expected inflation. ?The FOMC raises Fed fund by 1/2%.

In April, thinking they see continued rises in inflation expectation, they do an inter-meeting surprise 1/4% raise of Fed funds, followed by another 1/2% in May. ?It is at this pint that Vice Chairman McDonough tentatively realizes?[page 27] that the mortgage market has?now tightly coupled the response of the long end of the bond market to the short end the bond market, and thus, Fed policy. ?This was never mentioned again in the FOMC Transcripts, though it was the dominant factor moving the bond markets. ?The Fed was so focused on the real economy, that they did not realize their actions were mostly affecting the financial economy.

FOMC policy continued: Nothing in July, 1/2% rise in August, nothing in September, 3/4% rise in November, nothing in December, and 1/2% rise in February 1995, ending the tightening. In late December 1994 and January of 1995, the US Treasury and the Fed participated in a rescue of the Mexican peso, which was mostly caused by bad Mexican economic policy, but higher rates in the US diminished demand for the cetes, short-term US Dollar-denominated Mexican government?notes.

The stock market muddled during this period, and the real economy kept growing, inflation in check, and unemployment unaffected. ?Corporate spreads tightened; I remember that it was difficult to get good yields for my Guaranteed Investment Contract [GIC] business back then.

But the bond markets left their own impacts: many seemingly clever mortgage bond managers blew up, as did the finances of Orange County, whose Treasurer was a mortgage bond speculator. ?Certain interest rate derivatives blew up, such as the ones at Procter & Gamble. ?Several life insurers lost a bundle in the floating rate GIC market; the company I served was not one of them. ?We even made extra money that year.

The main point of August 1993 is this: holding short rates low for an extended period builds up imbalances in some part of the financial sector — in this case, it was residential mortgages. ?There are costs to providing too much liquidity, but the FOMC is not an institution with foresight, and I don’t think they learn, either.

This has already gotten too long, so I will close up here, and do part II tomorrow. ?Thanks for reading.

Theme: Overlay by Kaira