Category: General

The Possibility of the Tail Wagging the Dog

Photo Credit: miketransreal || Truly when the small seems big, and the big seems small, reality may intrude and reverse matters

Today I tweeted:

What I am about to say is speculative. For the last nine years, I have thought that the move away from LIBOR could be a case of “The cure is worse than the disease.” If you are going to have an index for short-term lending it can be created in a few ways:

  • Off of surveys, like LIBOR.
  • Off of transactions, like SOFR [Secured Overnight Financing Rate], or the on-the-run Treasury yield
  • Off of a liability yield, like a cost of funds index

One of the virtues of a non-transactional benchmark is that you won’t have to deal with the problem where the market generating the index is smaller than the market using the index. When that is the case, you can have those in the market using the index attempting to hedge in the smaller market generating the index, leading to distortions, volatility, etc. Though the small market was created to control the large market, when hedging starts, the large market will dominate the small one, and maybe games will get played in the small market to influence the large market.

As I wrote nine years ago in The Rules, Part XXXII:

Dynamic hedging only has the potential of working on deep markets.

Arbitrage pricing can reveal proper prices in smaller less liquid markets if there are larger, more liquid markets to compare against. The process cannot work in reverse, except by accident.

The SOFR market is a lot smaller than all the floating rate financing that goes on, which is transitioning from LIBOR to SOFR. My fear is that as the conversion from LIBOR to SOFR grows, and SOFR-based new issuance expands, that hedging by taking the opposite side of a SOFR trade will come to dominate that market, leading to volatility, and the taint that comes from the appearance of playing games.

Again, I am not certain here, but I think we may regret the transition from LIBOR to SOFR.

Why I Like the Debt Ceiling

Picture Credit: WyldKyss || The greatest mistake of economics is thinking we can influence the economy to make it do more over the long haul than it otherwise would do.

I am not a liberal; I am not a conservative. I wish the Balanced Budget Amendment had been passed in the1970s, such that we would not be making such grandiose as a result of legislative/bureaucratic tinkering. I think the government should not try to solve economic issues, and should focus on Issues of justice. The US government has never done well managing the economy. Set some basic boundaries to define fraud, and then let the economy run.

But in the present environment, i like anything that hinders the US Government from borrowing more. Most government spending reduces real GDP. You want infrastructure? Build it locally. Tax the area needing it, and see if they really want to pay the price. Don’t do it at the Federal level, where no one understands what is in any omnibus spending bill. It is all a waste, where those in Congress engage in a form of fraud telling their constituents what they got for them. If they really needed it, their state, county, or city should have done it. Projects should be done at the lowest level of government possible.

Think of the situation regarding ports. We have spent 10x+ more money on ports on the east of the US rather than the west, and far more freight comes to the west. If these decisions were not federalized, we would not make such stupid choices.

Bring back the sequester. Bring back anything that restrains the idiocy of the Congress and the last four Presidents. The high level of debt makes the economy unstable. You want more and more crises? Keep adding to the debt. The US and the World grew faster in real terms when the rule was balanced budgets and restrictive monetary policy. As such, I appreciate any measure that restrains the ability of the US government to borrow more.

Estimating Future Stock Returns, June 2021 Update

Image Credit: All images courtesy of Aleph Blog || Lookout below!

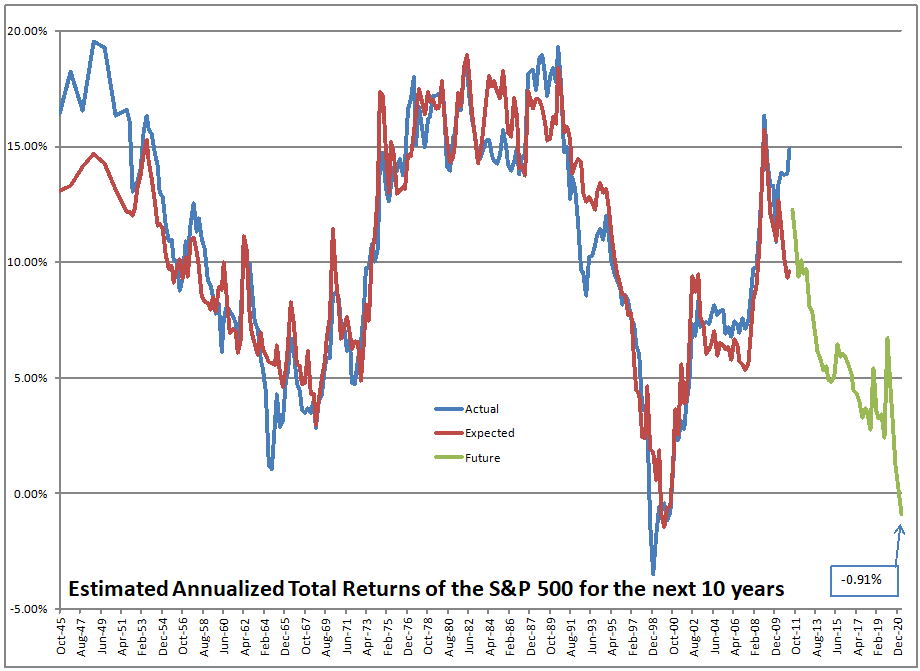
I’ll keep this brief, as I’ve said it so many times before. This market is on borrowed time. The only comparable period for this market is from the fourth quarter of 1999 to the third quarter of 2000 — the dot-com bubble, which was another period of speculation fueled by loose monetary policy. Here’s a picture of what price returns were like from that era over the next ten years (but with a 2% dividend yield).

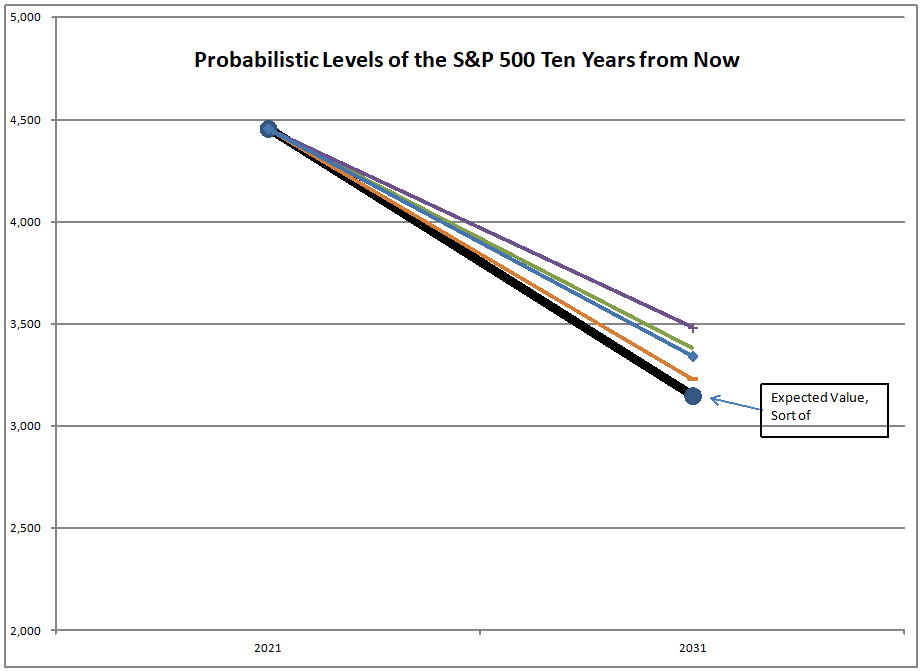
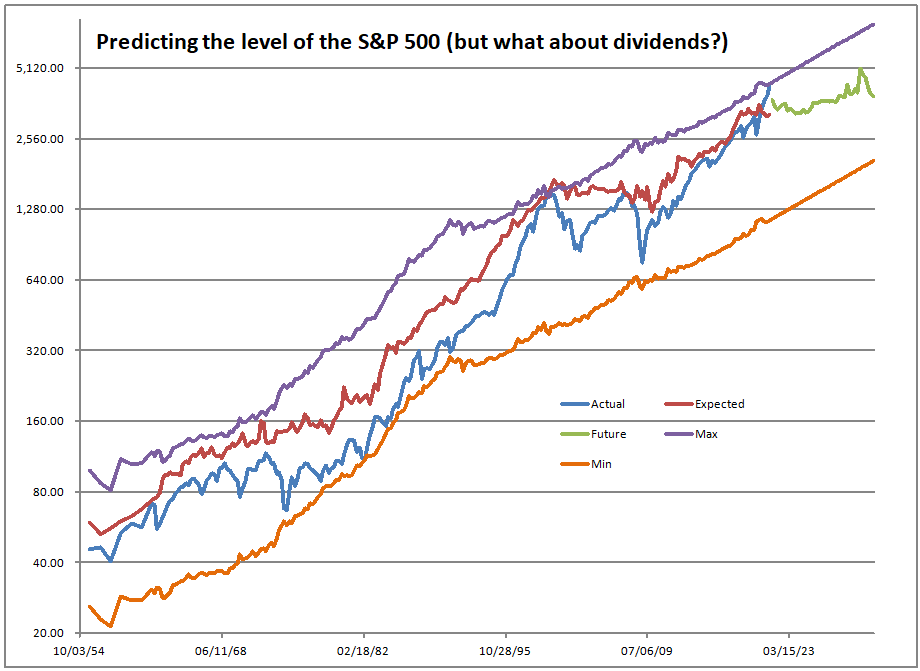
And we are touching the sky at present. Though at the end of the quarter, the S&P 500 was priced to return -0.91%/year over the next ten years, at present that value is -1.41%/year. None of these figures are adjusted for inflation. At the recent high of 4,536.95 on September 2nd, the expected return was -1.73%/year for the next ten years. This graph shows how we are touching the sky:

The actual line is touching the maximum line. The future line gives an idea of how valuations could normalize over ten years.

The Dow 36,000 crowd will get their day in the sun, maybe even this year, or it might not happen until 2035. But even if it hits the level, it’s unlikely that it will stay above that level for most of the rest of the next 10 years.

I’ll close with a quote from something I wrote recently:

Though interest rates are low, they are not negative. 10-year investment grade bonds are competitive against domestic stocks at this point. Even if you are losing against inflation, you are losing less against inflation than the market as a whole. Same for cash. I don�t think that there is no alternative. Here are the alternatives:

  • Investment grade bonds (market duration)
  • Cash
  • Value stocks
  • Cyclical stocks
  • Foreign stocks
  • Emerging market stocks and bonds

So consider the alternatives, and consider hedging. I can�t nuance this anymore, as we are in uncharted waters. We are touching the sky.

And I think even as the market falls, value should do well, as it did in 2000-2001. This piece from Bob Arnott at Research Affiliates makes a good case for it.

So play it safe; it’s a messy speculative world out there. It wouldn’t take much for it to turn ugly.

Book Review: Safe Haven

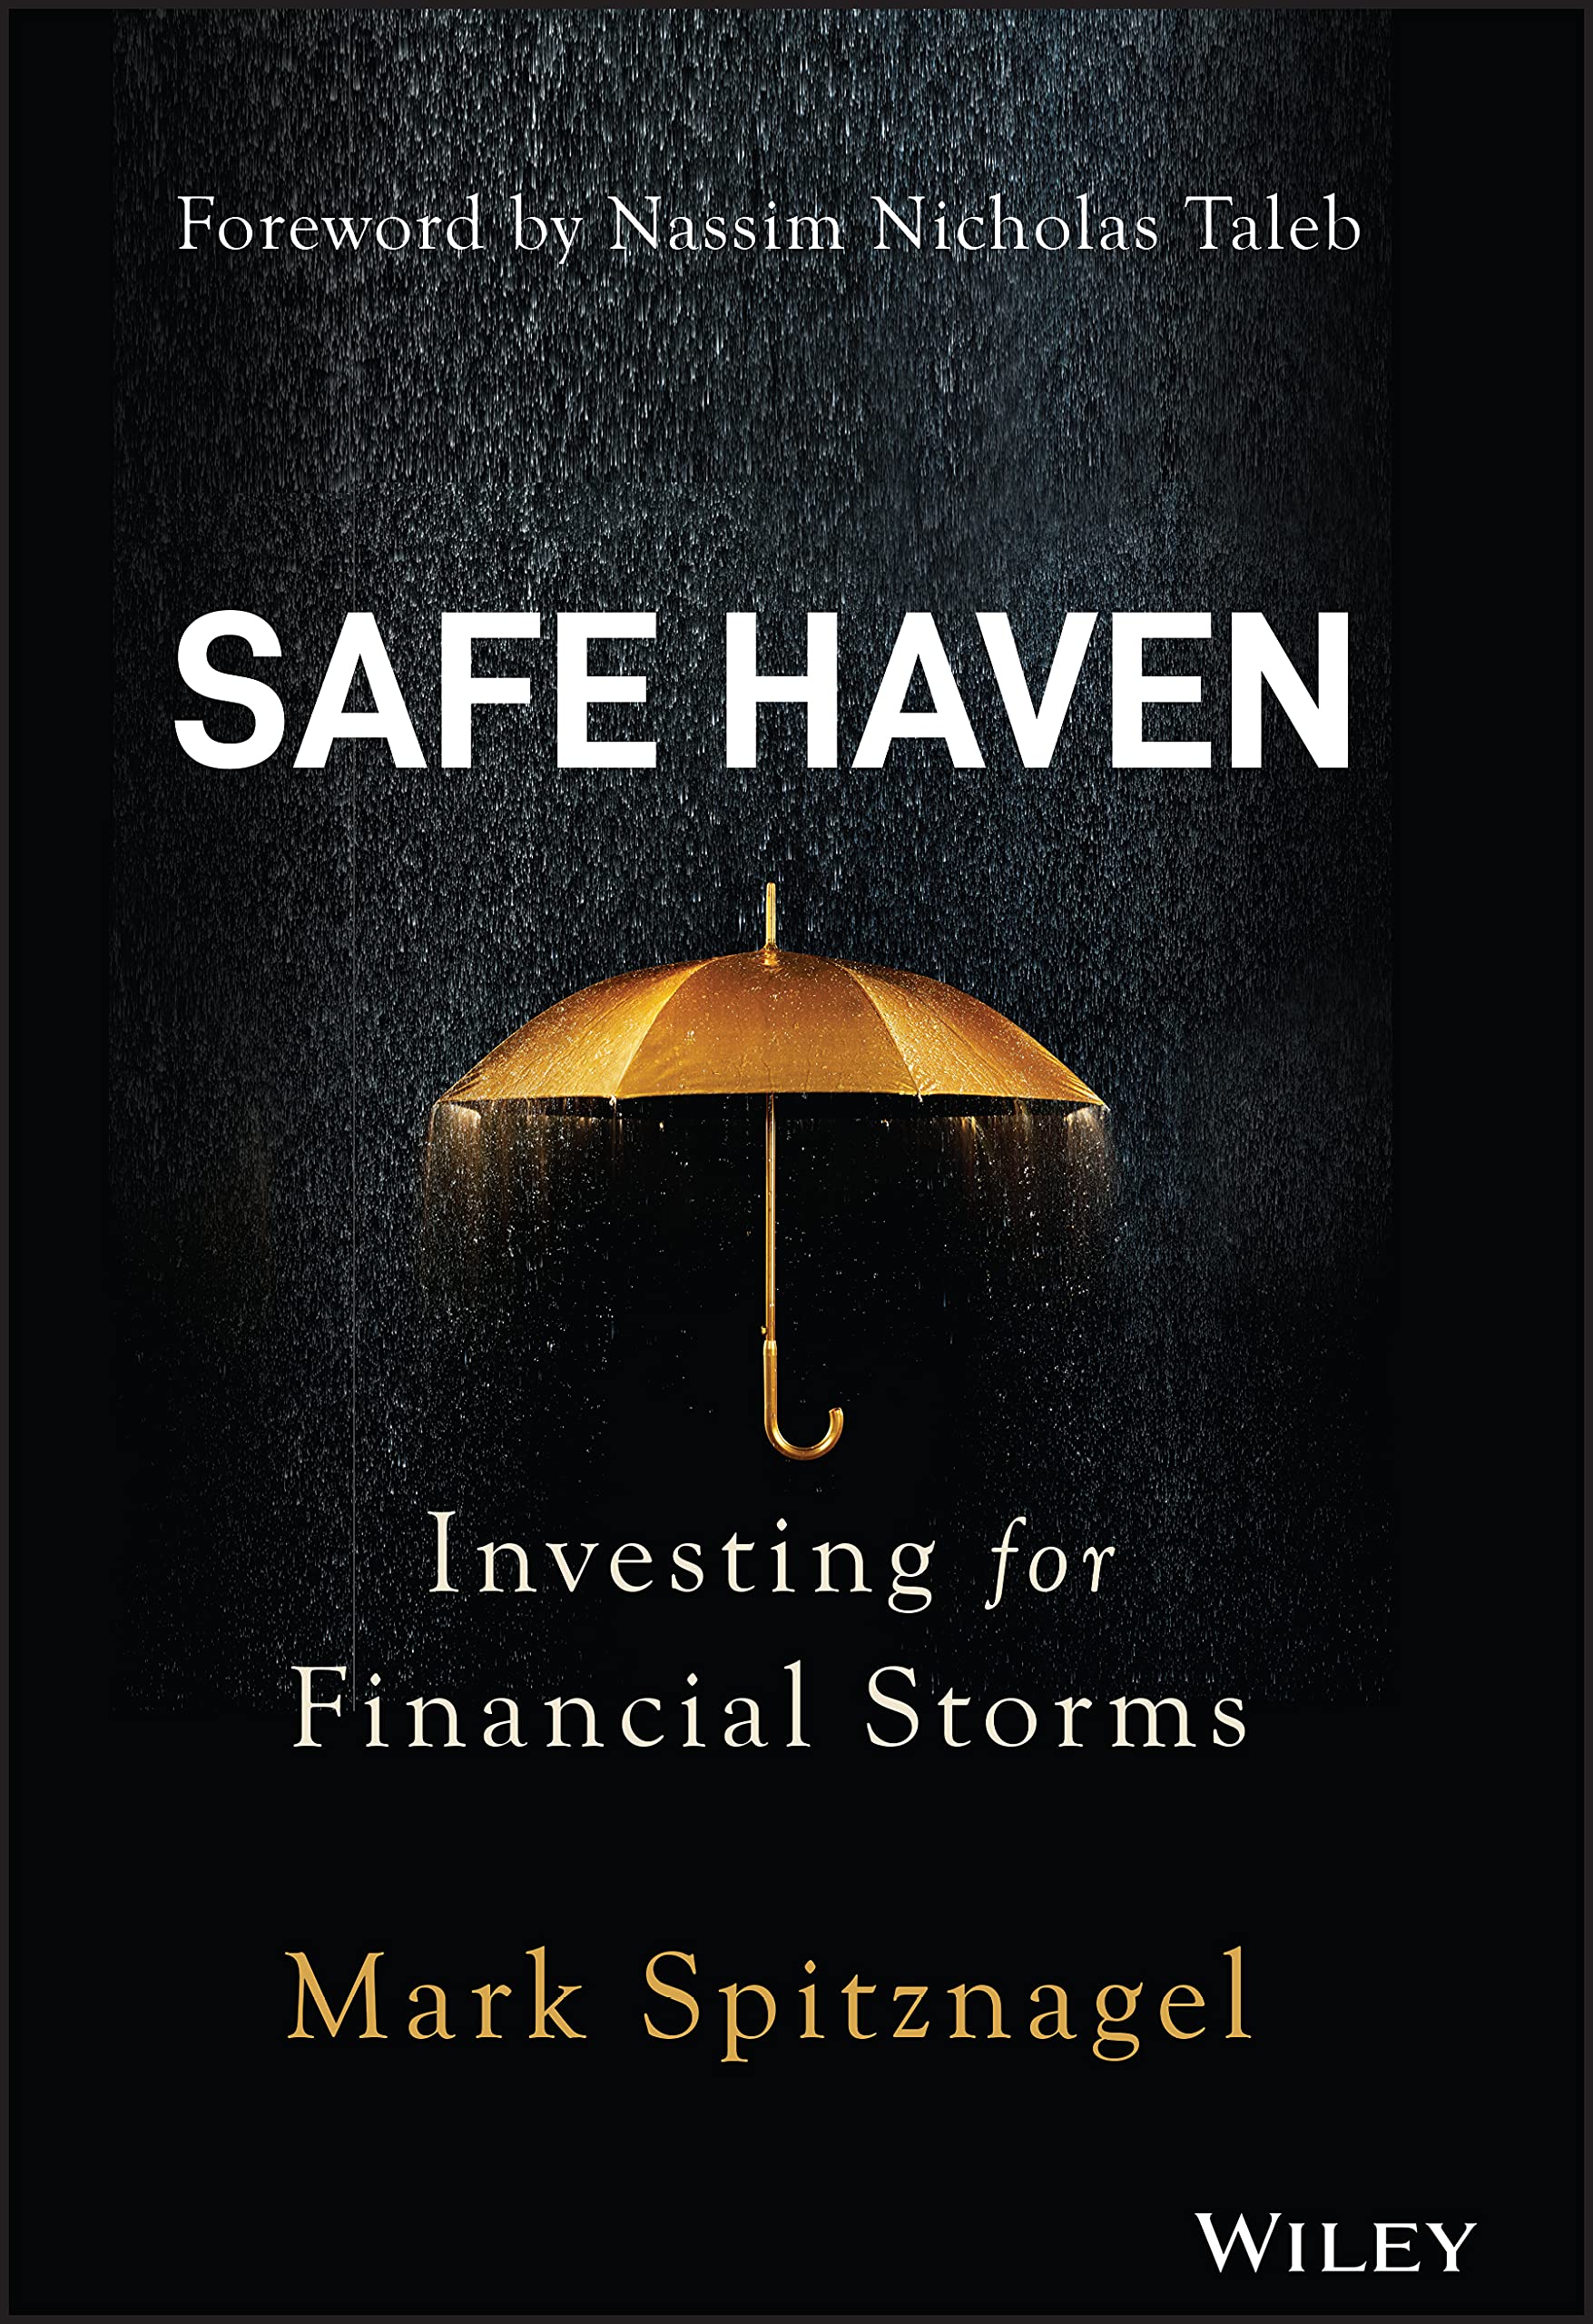
Picture Credit: Wiley Publishing || Ah, the golden umbrella!

This is a tough book to review. I don’t like the writing style — it is pompous, and drags you through a variety of “rabbit trails” that aren’t necessary to the core ideas of the book. Simplicity is beauty, so going on a travelogue of your philosophical interests detracts from the presentation of this book. As I have often said, the book needed a better editor who could overrule the author and say “That’s not relevant.” “That’s boring.” “Get to the point.” and “This is thin gruel.”

Quoting from pages 4-5:

As this book is, in part, a response to those questions, I do want to ensure that expectations are set  appropriately  at  the start. This is not a “how-to” book, but it is a “why-to” as well  as a “why-not-to” book. Let’s be clear: What I do specifically as a safe haven  investor  is not  to be attempted  by  nonprofessionals (nor-perhaps  even especially-by  most professionals). Nothing that I could tell you in a book will change that.

So, I will not be holding your hand and teaching you how to do it; I will not be revealing much in the way of trade secrets, and I have no interest in selling you anything as an investment manager. This book is not about the workings of a specific safe haven strategy, per se; nor is it an encyclopedic survey of all the major safe haven investments. Moreover, it has little if any current market commentary-as this would be entirely unnec�essary to the book’s point.

As such, the author talks in generalities, and does not give away his strategy. Do I blame him? No. I don’t blame him for not giving away his strategies. I do blame him for writing this book. Better to not write a vague book that is of no practical use to most who read it.

Modeling Issues

Then there are the modeling issues — a decent part of the book assumes that yearly returns are essentially random. Market returns are regime-dependent. There is momentum. There is weak mean reversion. The results in prior years affect the current year, both positively and negatively.

Toward the end of his analysis the author recognizes the problem and then uses 25-year blocks of S&P 500 returns 1900-2019 (or so), without noting that it gives undue weight to the years in the middle that get oversampled.

The grand problem is that we only have one history — and is it normal or an accident? We assume normal, but how can we know? Also, though we have 120 or so reliable years of performance for the pseudo-S&P 500, for options on the S&P 500, we only have ~35 years of data. For more esoteric diversifying investments, we have 10-40 years of data. We have no strong data on how they might have performed prior to their inception. Also, their modern presence may have affected the performance of the S&P 500.

Simulation analyses have to be done ultra-carefully. It’s best to develop an integrated structural model, deciding what variables are random and how they correlate with each other. Then use pseudo-random multivariate values for the analysis. I used these to great value to my employers 1996-2003 when I was an investment actuary.

What I Liked

But I like the book in some ways. He makes the important point that hedging when the cost of the hedge is fair or even in your favor is an advantage. And this is well known by regulated financial companies. There are two ways to win. 1) Source liabilities at favorable terms. 2) Buy assets on favorable terms. This book is about the first idea: insure your portfolio when it pays to do so. Happily, the insurance costs the least during bull markets, when everyone is hyperconfident. It costs the most during bear markets, where everyone is hyper-scared. So hedge more when it is cheap, and less when it is expensive. Simple, huh? But the book leaves this idea implicit. It never states it this plainly.

Second, I like his idea that the safest route is the one that maximizes expected wealth over time. That is underappreciated by asset managers.

Third, I appreciate that he brings in the Kelly Criterion, which is one of the best ways to deal with the risk-reward question, which in this case, is how you size your hedges.

Finally, he talks about maximizing the fifth percentile of likely outcomes, which in a well-structured model will keep the investor in the game, allowing the investor to cruise through bear markets, and stay invested. Hey, many actuaries have been doing that for life insurers over the last 25 years. Welcome to the club.

The Central Conundrum

He classifies his hedges as store-of-value, alpha, and insurance. Store of value is short-term savings that has no possibility of loss, which oddly he has at 7%/yr. That might be a long term average, or not, but when modeling the future, variables have to be forward-looking. There is no sign of 7% on the horizon at no risk.

He includes gold in this bucket, and thinks it is a genuine diversifier, with which I agree. Then there is alpha, which for him is commodity trading advisors who are trend followers, who do well when volatility is high. He also briefly touches on a variety of investments that he has tested, and finds they don’t aid the growth of terminal net worth on average.

Then there is insurance, which he never spells out exactly what it is, and the author says it is the most effective way to hedge, and profit. He hides his trade secrets.

What he should have told you I will reveal here. The insurance he is probably talking about is put options on stock or corporate bond indexes (particularly high-yield), or paying for protection on indexed credit-default swaps (best, but only institutions can do this). Imagine paying a constant percentage portfolio value by period to protect your portfolio. When valuations are high, implied volatility is low, and the insurance is cheap when you need it. When valuations are low, implied volatility is high, and the insurance is expensive when you don’t need it. In that situation, your existing hedges might have appreciated so much that you sell them off and go unhedged. Implied volatility can only go so high, before it mean-reverts. When option prices get high, potential hedgers and speculators who would be option buyers sit on their hands, and don’t do anything.

Quibbles

Already stated.

Summary / Who Would Benefit from this Book

If you have read this book review, you have learned more than the book will give you. I really don’t think many people will learn much from this book.

Full disclosure: The publisher kind of pushed a free copy on me, after I commented that I wasn’t crazy about the author’s last book.

Thoughts on 9/11 and its Aftermath

Picture Credit: Jackie || Though the idea for the lights bringing back the twin towers is beautiful, for me, someone who travelled to the PATH station beneath them many times, I miss the twin towers.

For those that don’t know my blog well, I described what happened to me during 9/11 in two places:

There’s one small thing I left out. I was planning to go to a conference at the World Trade Center on 9/12, if things were in good enough order at my work. I had to leave it flexible, because I did not know what would come of my client meeting planned for 9/11 — the client was rarely reasonable, and I might have to jump on a bunch of projects, and not go to NYC. As it was, I never had to make that choice. The events that unfolded made it for me.

One of the things that surprised me at the time was all the people who said, “Why did they attack us? What did we ever do to them?” in the US. I remember an email that came to me saying that, and I came up with seven reasons why they would do it. Now, I don’t have that email, so I am guessing at what I said, and I may not be able to come up with all seven, but I will try to do it here.

  1. The US supports Israel.
  2. Our entertainment dominates the globe, and poisons their culture, as many in Islamic countries like the entertainment, and become lukewarm to serious Islam.
  3. We support “moderate” Islamic governments, which keeps serious Islamists out of power.
  4. We kept bases in Saudi Arabia, desecrating their Holy Land.
  5. The Saudi Monarchy talks a good game with respect to Islam, but they oppose radicalism, and the US supports them.
  6. They hate the US because it is so morally degenerate, and yet so rich, which gnaws at them because the more consistent a nation is with Islam (excluding the accident of crude oil), the poorer they tend to be.
  7. The US invaded Iraq for less than significant reasons in Gulf War I. The US & Israel make military and pseudo-military actions with impunity in the Middle East. Think of Reagan bombing Ghaddafi.

Okay, I got to seven, and I suspect at least six of these were in my original email. My statement to those I ran across in 2001 was that the attack was not irrational. They had genuine reasons to hate the US government.

I think we didn’t learn anything from 9/11. Or, we didn’t care that we offended them. We essentially doubled down.

  1. We fought Gulf War II.
  2. We invaded Afghanistan, a nation that is not a nation, and tried to change it, blowing a lot of money on a hopeless cause. Cultural change is almost impossible to achieve, and certainly will not happen when pushed by outsiders.
  3. The O-bomber used drone strikes with impunity to eliminate enemies, and occasionally innocent people by mistake. Now Biden follows in his footsteps.
  4. Seal team six eliminated Osama Bin Laden in Pakistan. (Do we really want a world where those who are technologically powerful can assassinate with impunity? How should we feel about Salvador Allende of Chile?)

I believe that war is legitimate if there are legitimate reasons. I believe in Just War Theory. Aside from that, I tend to be a pacifist. One of the few things I liked about Trump was that he was probably the least hawkish President that we had in a long time. I don’t think the US has had a legitimate war over the last 70 years. It is our job to defend our nation, not the world as a whole.

I think we have created more problems in the Middle East over the last 20 years, and to the degree we feel we have to continue to interfere there, those problems will increase still more. If you think of George Washington warning about “entangling alliances,” I think we have fallen into the dangers that he described. And if you think of Eisenhower warning us about the “military-industrial complex,” that has come to dominate us as well.

We may have beaten back serious Islam for a time, but it will come back. We have offended them too much. The US has to understand that the hatred that exists in the Middle East can’t be solved. Let them fight, and let us stay out of it. Protect our nation? Yes. Protect the world? No. Offensive wars are almost never just.

Part of being a strong nation is controlling that strength, and only using it in the most severe situations that affect us directly. If you waste that strength on lesser matters, you weaken you own nation, and your reputation abroad.

So no, I don’t think we did the right things as a nation post-9/11, and I haven’t even touched on the loss of freedom here. The US needs to be more humble, and not impose its will on the rest of the world.

How to Avoid �Breaking the Buck� Redux

Picture Credit: All pictures today are by me. Aleph Blog

What sounded simple yesterday proved harder to put into a spreadsheet than I expected. Nonetheless, I got it done. As an aside, I wanted to mention one thing I don’t think I have disclosed before: I competed in the Modeloff competition four or five times. I always got to the second round. One time my first round score had me in the top 20, and one time my second round score had me in the top 1%. I never made it to the finals — it is no place for old men. I asked one of the organizers if I was the oldest guy in the contest, and he said, “No, there is one guy older than you.”

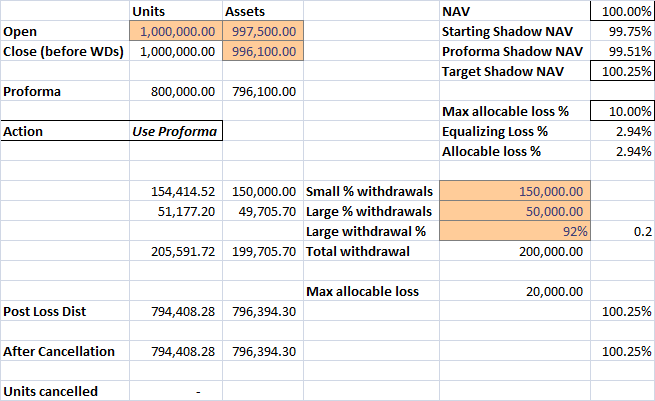
The grand challenge of this model was solving two messy simultaneous equations to find the loss percentage. That took me two hours to solve, due to repeated errors where I tried to do it too quickly. Always go back to first principles, and solve things step by step.

Tonight, I am only changing one variable, the most important one for this discussion, what are the assets worth at the close, prior to withdrawals. In my first example, that value is $996,100, leaving the Closing Pro-forma Shadow NAV at 99.51%, which doesn’t break the buck by a hair. The withdrawals get paid in full, and the fund lives to fight for another day with no press release.

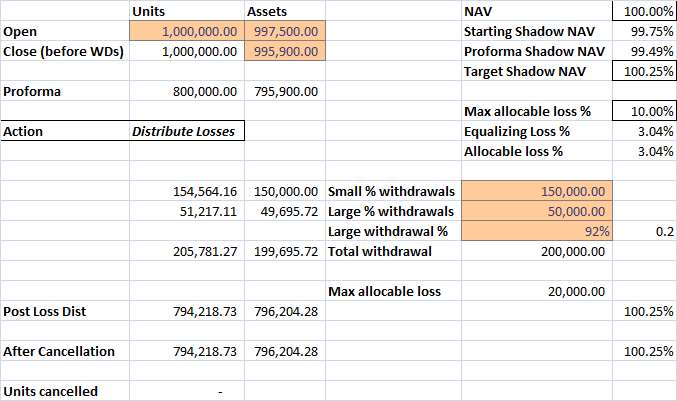
Scenario Two

In the second scenario, the closing assets prior to withdrawal are $995,900, leaving the Closing Pro-forma Shadow NAV at 99.49%, which breaks the buck by a hair. The withdrawals get paid at a 3.04% discount. The small withdrawers lose additional units, but the amount of money they requested comes in full. The large withdrawers don’t get paid in full. A large withdrawer is asking for all or almost all of their money back. The assumption in this set of scenarios is that the large withdrawers are asking for 92% of their assets back in aggregate. The calculation balances the losses between a payment discount, and loss of most of the remaining units.

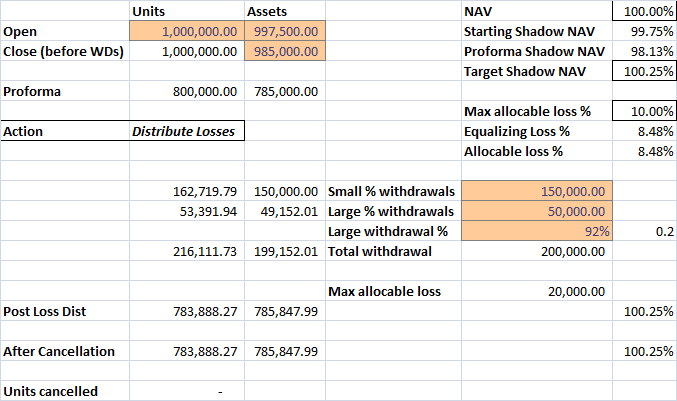
Scenario Three

In the third scenario, the closing assets prior to withdrawal are $985,000, leaving the Closing Pro-forma Shadow NAV at 98.13%, which breaks the buck. The withdrawals get paid at a 8.48% discount. Those staying still have all of their units at greater than par.

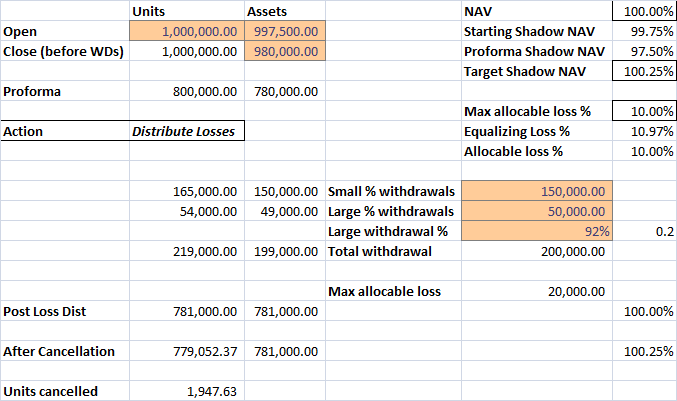
Scenario Four

In the fourth scenario, the closing assets prior to withdrawal are $980,000, leaving the Closing Pro-forma Shadow NAV at 97.50%. The withdrawals get paid at a 10.00% discount. Those staying also lose units, but their higher income rate will compensate for that, unless the losses are permanent from defaulted assets. Nonetheless, the losses they take are minor relative to those who withdrew from the MMF.

Scenario Five

In the fifth scenario, the meltdown scenario worse than Reserve Primary, the closing assets prior to withdrawal are $950,000, leaving the Closing Pro-forma Shadow NAV at 93.75%. The withdrawals get paid at a 10.00% discount. Those staying also lose units, but their higher income rate will compensate for that, unless the losses are permanent from defaulted assets. Nonetheless, the losses they take are less than those who withdrew from the MMF.

My contention is this: a structure like this would prevent money market panics. Would it stop something like the Great Financial Crisis? (2008-9) Of course not. The disaster was going to happen regardless. The money market funds were in the wrong place at the wrong time. The repo markets were far more significant, and still have not gotten fixed.

When I get a moment, I will submit this to the SEC, as I did the last time after the Great Financial Crisis. I talked with two of the lawyers at the SEC, who said my idea was promising, but too radical. We’ll see what happens this time. It will likely be nothing, but who can tell? Gensler might be willing to consider something radical.

How to Avoid “Breaking the Buck”

Picture Credit: photosteve101 || Maybe we can get some glue…

I used to write about this topic after the financial crisis a lot. I stopped after the SEC made their last set of changes. But when I read this article today, I decided to tweet this:

When I was an investment actuary, I developed and worked with a large number of insurance products that were managed to be pure savings vehicles. There was usually a short-term guarantee of crediting interest together with a full guarantee of principal. The difference between the short-term guarantee and actual earnings would get factored into the next short-term guarantee, making the short-term guarantee reflect the actual asset performance over time. Benefits would get paid at book value, while plan sponsor deciding to terminate would get something a little under the market value of the assets.

The names for those products were Initial Participation Guarantee, Guaranteed Investment Contracts, Stable Value Funds, and hybrids and synthetics of them. For fixed income investments that acted like savings accounts they worked well for pension plans and their beneficiaries in an era when interest rates started high, and kept falling. They were complex compared to running a money market fund because they ran with longer fixed income, making stability of principal much more tricky.

I even created a product that was relatively short duration that could trade like a mutual fund, making it eligible for a wide number of applications. (Sadly, I left shortly after it was created, and those who followed me didn’t run it right, and so it didn’t amount to much.)

So, when I write about money market funds [MMFs], I think I get the math going on there, and the problem is simpler because of the short duration, yet harder, because all assets are redeemable at par immediately. With the longer-dated insurance products, terminating customers would face a relatively harsh market value adjustment at termination. The challenge with MMFs is to make those demanding liquidity in a crisis pay the penalty, while those staying in do not get penalized, and possibly, get rewarded.

My proposal is slightly different than my prior proposal, but the math is the same. (Bond math is inexorable, even if bonds aren’t.) The first thing to do is define when a MMF is under stress, which is when its shadow NAV is under 0.995. If at the time the shadow NAV is calculated at the end of the day, the shadow NAV is under 0.995 then two things happen in this order:

  1. Those withdrawing funds lose additional units in the MMF in order to renormalize the shadow NAV to 1.0025. If any are doing a withdrawal of funds great enough that they won’t lose enough units, they suffer a market adjustment penalty of the same amount. The maximum amount of economic loss is 10% of the amount withdrawn.
  2. If the shadow NAV is still below 0.995 after step 1, units of those that remain are cancelled to the degree that the shadow NAV renormalizes at 1.0025.

Why penalize those who exit in a crisis? They are causing the crisis. Liquidity is not a free good, and certainly not in a crisis. This will make them think twice about liquidating, because they will absorb a disproportionate amount of the loss.

Why renormalize to 1.0025? Why not to 1.0000? This helps prevent further runs on the fund. If parties exit when the shadow NAV is over 1, it will boost the shadow NAV further. Even if the continuing holders lose units when the shadow NAV is renormalized, they don’t lose any value unless there are genuine defaults within the assets held in the MMF. If there are no defaults, the unit losses will be made up by a higher yield which will pay back the unit losses over the weighted average life of the assets involved.

A weak analogy to this is what Vanguard does on some funds that are less liquid. They charge a small termination penalty, but it gets paid to the fund, not Vanguard. Long -term holders get a small benefit from this.

The benefits of this proposal are:

  • Allows all MMFs to have a $1 share price all of the time
  • Penalizes those that grab for liquidity when an MMF is under stress
  • Discourages runs on MMFs
  • Would allow regulators to allow Prime MMFs to run a more aggressive investment policy

This sounds too good to be true, right? Well, it isn’t. My next post will run some scenarios to show how this would work. Personally, I think if this were adopted, corporations using Prime MMFs would appreciate the stable share price of $1, the potentially higher yield, but against that they would think about how liquidity would not be so easily available in a crisis, and that they would have to report credit losses when units are renormalized.

There is no free lunch, but there are ways to discourage people from running for the exits in the midst of a crisis, to the harm of everyone else.

PS — when I started writing tonight, I was just going to trot out my old proposals, but when I went through my history of working with guaranteed insurance products, I was reminded that our best risk-controlled products spread the losses onto those who leave at inopportune times. When I realized that, my old idea got a lot sharper.

The Best Simple Measure for Evaluating Credit Risk of Publicly Traded Firms for a Stock Investor

Picture Credit: andrechinn || A cute idea stemming from contingent claims theory!

I was looking at conditions in the shipping industry today, and I thought back on a stock that I used to own — Tsakos Energy Navigation Limited [TNP]. I think I sold it in 2007 or so. I was shocked to see it selling for a tiny fraction of the price of where I sold it. And so I thought: Is it going to go broke?

I turned to my favorite measure of credit risk to try to answer this: (Long-term Debt + Short-term Debt) / Market Capitalization. Unless a company is in a very stable industry, I like that figure to be under one. For TNP, it is not a stable industry; it is in a highly cyclical business. The current value of that statistic is 11.

What’s the logic here? Debt claims are fixed as far as the debtor is concerned. For TNP, all of the debts are secured by their ships. But the best estimate of what the residual claimants (stockholders) have for the value of their holdings is market capitalization. Thus the ratio of debts to market value of equity can be a simple summary of how levered the company truly is. In this case, TNP sells at around 0.1x of its book value. Is it cheap? Yes, and particularly on a Price-to-sales basis. Is it safe? No. Will I buy some? No. Will I short it? I never short. Is it going broke? Who can tell? It doesn’t have a sufficient margin of safety for me.

If I were one of the banks lending against the TNP ships, I would look at different metrics — Value of the ship as a ratio of the loan, marginal earnings of the ship as a ratio of financing costs, etc. But if TNP decided to not pay on any ship loan in hard times, it would negatively affect their ability to finance new ships, and refinance existing ships. Not paying would be catastrophic.

The intuitive way to think about this ratio is like this: the value of a stock is the present value of the future free cash flows. The value of the debt is the present value of the future debt payments. So the higher the ratio goes, the thinner the margin is for making the debt payments. Also, equity has the optionality of “Heads I win, Tails you lose” to creditors. The most the creditors can do is get paid back, but they can lose it all (in this situation for TNP, the downside is capped by the collateral). But though the equity can lose it all, in the right situation they can multiply the value highly if the cycle turns favorably.

Anyway, I think this is the best quick take on credit risk as far as stockholders are concerned. If others have better ideas, please share them in the comments.

Touching the Sky

Picture Credit: Adam Y Zhang || What goes up… wait, we’re in orbit?!

What I posted after the close yesterday…

I don’t have much more to say. The next Z.1 report comes out in late September, but will only bring the data up to June 30th. I use a pair of adjustments to adjust the share of assets invested in risk assets (stocks) between releases. So far, the adjustments seem reliable as the interim estimates have been tracking the results from new releases.

Could the model be wrong? Sure. I don’t run into many professionals who endorse the asset share model. Part of that is the industry gets compensated off of assets under management. No one wants to forecast declining future revenue. No one wants to have clients move out of stocks, as the percentage fees from stocks are higher than bonds or cash.

Aside from that, the asset share model is a balance sheet model. Most analysts prefer income statement models, even though they work as well, because P/E ratios are more intuitive to market participants. The asset share model is not the only balance sheet model — the Q-ratio is also a balance sheet model.

Though interest rates are low, they are not negative. 10-year investment grade bonds are competitive against domestic stocks at this point. Even if you are losing against inflation, you are losing less against inflation than the market as a whole. Same for cash. I don’t think that there is no alternative. Here are the alternatives:

  • Investment grade bonds (market duration)
  • Cash
  • Value stocks
  • Cyclical stocks
  • Foreign stocks
  • Emerging market stocks and bonds

So consider the alternatives, and consider hedging. I can’t nuance this anymore, as we are in uncharted waters. We are touching the sky.

Is Liquidity Evaporating? (What a gas, man…)

Picture Credit: FRED and Aleph Blog || The above is the negative of the year over year change in the velocity of M2. GDP is now growing faster than M2

There was an Interesting article on Bloomberg yesterday: Liquidity Is Evaporating Even Before Fed Taper Hits Markets. It makes the case that over the last 20+ years the stock market has fallen once GDP starts growing faster than M2. More money goes to production, and less to financing assets.

As the article says:

�Put another way, the recovering economy is now drinking from a punch bowl that the stock market once had all to itself,� Doug Ramsey, Leuthold Group�s chief investment officer, wrote in a note last week.

Liquidity Is Evaporating Even Before Fed Taper Hits Markets

Looking over the last 60 years, there seems to be a weak correlation that supports this idea. Now, for those that follow my S&P 500 valuation model, we are very close to the all-time peak valuation level. The peak was a -1.87%/year expected nominal return over the next 10 years. We are at -1.81%/year now. (Again, not adjusted for inflation.)

Anybody else noticing that interest rates have been rising recently? The 30-year Treasury bond yields 2.00%! (I remember my first boss saying to me in 1987, “Interest rates will never go below 10%.”)

In the Bloomberg article, Ed Yardeni is skeptical and said the following:

Ed Yardeni, the president and founder of Yardeni Research Inc., says he prefers to plot not the growth rates but the absolute level of M2 against GDP to measure liquidity. Based on that, liquidity stood near a record high. �Some people start to freak out about the M2 growth rate,� he said in an interview on Bloomberg TV and Radio. �What they don�t really appreciate is M2 today is $5 trillion higher than it was before the pandemic. There is just a tremendous liquidity sitting there.�

Liquidity Is Evaporating Even Before Fed Taper Hits Markets

I disagree with Yardeni here, but that doesn’t mean that I fully believe that danger is imminent. Economics has always improved by analyzing in terms of how marginal values are affected, not absolute values. Ben Bernanke uttered the word “taper” and forward interest rates roared higher as he protested that monetary policy was “accommodative.” Monetary policy is as loose as what economic actors can borrow money at. Rates are rising — tight. Rates are falling — loose. Yellen and Fischer made the same errors.

The Fed is tightening as they reduce QE, and begin raising the Fed Funds rate in 2022. It will end in a market meltdown in late 2022 as an overly indebted economy cannot tolerate the increase in the financing rate. The Fed will find itself trapped and interest rates will remain low.

My confidence level on this idea is only 70%. But valuations are high, and the Fed is tightening, even if they say they are not doing so. There will be far worse times to speculate on a fall in the market. It can’t go much higher. It can go a lot lower. Short bonds and cash are alternatives.

Theme: Overlay by Kaira