Category: Portfolio Management

Since 1950, the S&P 500 in 2017 Ranks First, Fourth, Tenth or Twenty-third?

Since 1950, the S&P 500 in 2017 Ranks First, Fourth, Tenth or Twenty-third?

Credit: Roadsidepictures from The Little Engine That Could By Watty Piper Illustrated By George & Doris Hauman c. 1954

=========================================

I wish I could have found a picture of Woodstock with a sign that said “We’re #1!”? Snoopy trails behind carrying a football, grinning and thinking “In this corner of the backyard.”

That’s how I feel regarding all of the attention that has been paid to the S&P being up every month in 2017, and every month for the last 14 months.? These have never happened before.

There’s a first time for everything, but I feel that these records are more akin to the people who do work for the sports channels scaring up odd statistical facts about players, teams, games, etc.? “Hey Bob, did you know that the Smoggers haven’t converted a 4th and 2 situation against the Robbers since 1998?”

Let me explain.? A month is around 21 trading days.? There is some variation around that, but on average, years tend to have 252 trading days.? 252 divided by 12 is 21.? You would think in a year like 2017 that it must? have spent the most time where 21-day periods had positive returns, as it did over each month.

Since 1950, 2017 would have come in fourth on that measure, behind 1954, 1958 and 1995.? Thus in one sense it was an accident that 2017 had positive returns each month versus years that had more positive returns over every 21 day period.

How about streaks of days where the 21-day trialing total return never dropped below zero (since 1950)?? By that measure, 2017 would have tied for tenth place with 2003, and beaten by the years 1958-9, 1995, 1961, 1971, 1964, 1980, 1972, 1965, and 1963.? (Note: quite a reminder of how bullish the late 1950s, 1960s and early 1970s were.? Go-go indeed.)

Let’s look at one more — total return over the whole year.? Now 2017 ranks 23rd out of 68 years with a total return of 21.8%.? That’s really good, don’t get me wrong, but it won’t deserve a mention in a book like “It Was a Very Good Year.”? That’s more than double the normal return, which means you’ll have give returns back in the future. 😉

So, how do I characterize 2017?? I call it?The Little Market that Could.? Why?? Few drawdowns, low implied volatility, and skepticism that gave way to uncritical belief.? Just as we have lost touch with the idea that government deficits and debts matter, so we have lost touch with the idea that valuation matters.

When I talk to professionals (and some amateurs) about the valuation model that I use for the market, increasingly I get pushback, suggesting that we are in a new era, and that my model might have been good for an era prior to our present technological innovations.? I simply respond by saying “The buying power has to come from somewhere.? Our stock market does not do well when risk assets are valued at 40%+ of the share of assets, and there have been significant technological shifts over my analysis period beginning in 1945, many rivaling the internet.”? (Every era idolizes its changes.? It is always a “new era.”? It is never a “new era.”)

If you are asking me about the short-term, I think the direction is up, but I am edgy about that.? Forecast ten year returns are below 3.75%/year not adjusted for inflation.? Just a guess on my part, but I think all of the people who are making money off of low volatility are feeding the calm in the short-run, while building up a whiplash in the intermediate term.

Time will tell.? It usually does, given enough time.? In the intermediate-term, it is tough to tell signal from noise.? I am at my maximum cash for my equity strategy accounts — I think that is a prudent place to be amid the high valuations that we face today.? Remember, once the surprise comes, and companies scramble to find financing, it is too late to make adjustments for market risk.

Estimating Future Stock Returns, September 2017 Update

Estimating Future Stock Returns, September 2017 Update

Another quarter goes by, the market rises further, and the the 10-year forward return falls again.? Here are the last eight values:?6.10%, 6.74%, 6.30%, 6.01%, 5.02%, 4.79%, and 4.30%, 3.99%. ?At the end of September 2017, the figure would have been 4.49%, but the rally since the end of the quarter shaves future returns down to 3.99%.

At the end of June the figure was 4.58%.? Subtract 29 basis points for the total return, and add back 12 basis points for mean reversion, and that would leave us at 4.41%.? The result for September month-end was 4.49%, so the re-estimation of the model added 8 basis points to 10-year forward returns.

Let me explain the adjustment calculations.? In-between quarterly readings, price movements shave future returns the same as a ten-year zero coupon bond.? Thus, a +2.9% move in the total return shaves roughly 29 basis points off future returns. (Dividing by 10 is close enough for government work, but I use a geometric calculation.)

The mean-reversion calculation is a little more complex.? I use a 10-year horizon because that is the horizon the fits the data best.? It is also the one I used before I tested it.? Accidents happen.? Though I haven’t talked about it before, this model could be used to provide shorter-run estimates of the market as well — but the error bounds around the shorter estimates would be big enough to make the model useless. It is enough to remember that when a market is at high valuations that corrections can’t be predicted as to time of occurrence, but when the retreat happens, it will be calamitous, and not orderly.

Beyond 10-years, though, the model has no opinion.? It is as if it says, past mean returns will occur.? So, if we have an expectation of a 4.58% returns, we have one 4.58%/yr quarter drop of at the end of the quarter, and a 9.5% quarter added on at the end of the 10-year period. That changes the quarterly average return up by 4.92%/40, or 12.3 basis points.? That is the mean reversion effect.

Going Forward

Thus, expected inflation-unadjusted returns on the S&P 500 are roughly 3.99% over the next ten years.? That’s not a lot of compensation for risk versus investment-grade bonds.? We are at the 94th percentile of valuations.

Now could we go higher?? Sure, the momentum is with us, and the volatility trade reinforces the rise for now.? Bitcoin is an example that shows that there is too much excess cash sloshing around to push up the prices of assets generally, and especially those with no intrinsic value, like Bitcoin and other cryptocurrencies.

Beyond that, there are not a lot of glaring factors pushing speculation, leaving aside futile government efforts to stimulate an already over-leveraged economy.? It’s not as if consumer or producer behavior is perfectly clean, but the US Government is the most profligate actor of all.

And so I say, keep the rally hats on.? I will be looking to hedge around an S&P 500 level of 2900 at present.? I will be watching the FOMC, as they may try to invert the yield curve again, and crash things.? They never learn… far better to stop and wait than make things happen too fast.? But they are omnipotent fools.? Maybe Powell will show some non-economist intelligence and wait once the yield curve gets to a small positive slope.

Who can tell?? ?Well, let’s see how this grand experiment goes as Baby Boomers arrive at the stock market too late to save for retirement, but just in time to put in the top of the equity market.? Though I am waiting until S&P 2900 to hedge, I am still carrying 19% cash in my equity portfolios, so I am bearish here except in the short-run.

PS — think of it this way: it should not have gone this high, therefore it could go higher still…

Short-Term Rational, but Intermediate-Term Irrational

Short-Term Rational, but Intermediate-Term Irrational

Don’t look at the left side of the chart on an empty stomach

==================

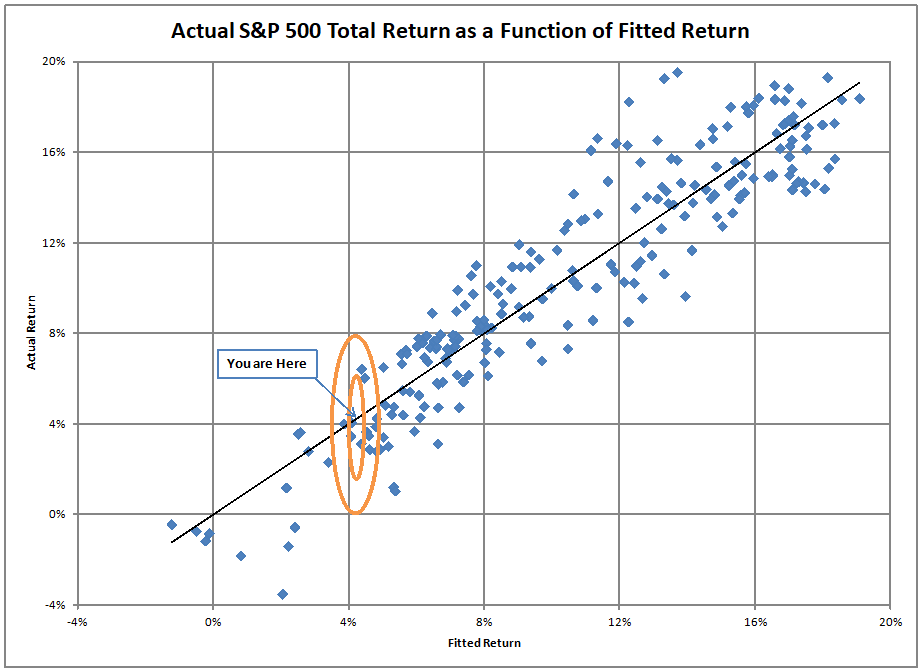
This will be a short post.? At present the expected 10-year rate of total return on the S&P 500 is around 4.05%/year.? We’re at the 94th percentile now.? The ovals on the graph above are 68% and 95% confidence intervals on what the actual return might be.? Truly, they should be two vertical lines, but this makes it easier to see.? One standard deviation is roughly equal to two percent.

But, at the left hand side of the graph, things get decidedly non-normal.? After the model gets to 2.5% projected returns, presently around 3100 on the S&P 500, returns in the past have been messy.? Of course, those were the periods from 1998-2000 to 2008-2010.? But aside from one stray period starting in 1968, that is the only time we have gotten to valuations like this.

My last piece hinted at this, but I want to make this a little plainer.? For sound effects while reading this, you could get your children or grandchildren to murmur behind you “We know it can’t. We know it can’t.” while you consider whether the market can deliver total returns of 7%/year over the next 10 years.

There are few if any things that remain permanently valid insights of finance.? Anything, even good strategies, can be overdone.? Even stable companies can be overlevered, until they are no longer stable.

In this case, it is buying the dips, buying a value-weighted cross section of the market, and putting your asset allocation on autopilot.? Set it and forget it.? Add in companies always using spare capital to buy back shares, and maxing out debts to fit the liberal edge of your preferred rating profile.

These have been good ideas for the past, but are likely to bite in the future.? Value is undervalued, safety is undervalued, and the US is overvalued.? A happy quiet momentum has brought us here, and for the most part it has been calm, not wild.? Individually prudent actions that have paid off in the past are likely to prove imprudent within three years, particularly if the S&P 500 rises 10-15% more in the next year.

People have bought into the idea that market timing never matters.? I agree with the idea that it usually doesn’t matter, and that it is usually is a fool’s game to time the market.? That changes when the 10-year forward forecast of market returns gets low, say, around 3%/year.

Remember, the market goes down double-speed.? Just because the 10-year returns don’t lose much, doesn’t mean that there might not be better opportunities 3-5 years out, when the market might offer returns of 6%/year or higher.

Also, remember that my data set begins in 1945.? I wish I had the values for the 1920s, because I expect they would be even further to the left, off the current graph, and well below the bottom of it.

This isn’t the most nuts that things can be.? In fact, it is very peaceful and steady — the cumulative effect of many rational decisions based off of what would have worked best in the past, in the short-run.

As a result, I am looking 10 years into the future, and slowly scaling back my risks as a result.? If the market moves higher, that will pick up speed.

The Little Market that Could

The Little Market that Could

Picture Credit: Roadsidepictures from The Little Engine That Could By Watty Piper, Illustrated By George & Doris Hauman | That said, for every one that COULD, at least two COULDN’T

======================================

So what do you think of the market?? Why are both actual and implied volatility so low?? Why are the moves so small, but predominantly up?? Is this the closest impression of the Chinese Water Torture that a stock market can pull off?

Why doesn’t the market care about external and internal risks?? Doesn’t it know that we have divisive, seemingly incompetent President who looks like he doesn’t know how to do much more than poke people in the eyes, figuratively?? Doesn’t it know that we have a divided, incompetent Congress that can’t get anything of significance done?

Leaving aside the possibility of a war that we blunder into (look at history), what if the inability of Washington DC to do anything is a plus?? Government on autopilot for four years, maybe eight if we decide we are better of without change — is that a plus or minus?? Just ignore the noise, Trump, other politicians, media… ahh, the quiet could be nice.

Then think about Baby Boomers showing up late for retirement, and wondering what they are going to do.? Then think about their surrogates, the few who still have defined benefit pension plans.? What are they going to do?? Say that the rate that they are targeting for investment earnings is 7%/year forever.? Even if my model for investment returns is wrong in a pessimistic way — i.e., my 4% nominal should be 6%/year nominal, you still can’t hit your funding target.? As for those with defined contribution plans, when you are way behind, even contributing more won’t do much unless investment earnings provide some oomph.

I am personally not a fan of TINA — “there is no alternative” to stocks in the market, but I recognize the power of the idea with some.? It is my opinion that more people and their agents will run above average risks in order to try to hit an unlikely target rather than lock in a loss versus what is planned.? Most will “muddle in the middle” taking some risk even with a high market, and realizing that they aren’t going to get there, but maybe a late retirement is better than none.

That’s the power of bonds returning 3% at best over the forecast horizon, unless interest rates jump, and then we have other problems, like risk assets repricing.? If you are older, almost no plan is achievable at reasonable cost if you are coming to the game now, rather than starting 15+ years ago.

And so I come to “the little market that could…” for now.? My view is that those with retirement obligations to fund are bidding up the market now.? That does two things.? Shares of risk assets (stocks) move from the hands of stronger investors to weaker investors, while cash flows the opposite direction.? In the process, prices for risk assets get bid up relative to their future free cash flows.

Unlike “the little engine that could,” the little market that could has climbed some small hills relative to the funding targets that investors need. Ready for the Himalayas?? The trouble with those targets is that regardless of what the trading price of the risk assets is, the cash flows that they produce will not support those targets.

Thought experiment: imagine that the stock market was gone and all the shares we held were of private companies that were difficult and expensive to trade.? ?Pension plans would estimate ability to meet targets by looking at forecasts of the underlying returns of their private investments, rather than a total return measure.

Well, guess what?? In the long run, the returns from public stock investments reflect just that — the distributable amount of earnings that they generate, regardless of what a marginal bidder is willing to pay for them at any point in time.? Stocks aren’t magic, any more than the firms that they represent ownership in.

So… we can puzzle over the current moment and wonder why the market is behaving in a placid, slow-climbing manner.? Or, we can look at the likely inadequacy of asset cash flows versus future demands for those cash flows for retirement, etc.? Personally, I think they are related as I have stated above, but the second view, that asset returns will not be able to fund all planned retirement needs is far more certain, and is one mountain that “the little market that could” cannot climb.

Thus, consider the security of your own plans, and adjust accordingly.? As I commented recently, for older folks with enough assets, maybe it is time to lock in gains.? For others, figure out what adjustments and compromises will need to be made if your assets can’t deliver enough.

Tough stuff, I know.? But better to be realistic about this than to be surprised when funding targets are not reached.

“Bank” Some of Your Gains

“Bank” Some of Your Gains

Photo Credit: Scoobyfoo

=======================

Recently I read Jonathan Clements’ piece Enough Already.? The basic idea was to encourage older investors who have made gains in the risk assets, typically stocks, though it would apply to high yield bonds and other non-guaranteed investments that are highly correlated with stocks.? His pithy way of phrasing it is:

If I have already won the game, why would I keep playing?

His inspiration for the piece stems from a another piece by William Bernstein [at the WSJ] How to Tell if Your Retirement Nest Egg Is Big Enough.? He asked a question like this (these are my words) back in early 2015, “Why keep taking risk if your performance has been good enough to let you reduce risk and live on the assets, rather than run the possibility of a fall in the market spoiling your ability to retire comfortably?”

Decent question.? If you are young enough, your time horizon is long enough that you can ignore it.? But if you are older, you might want to consider it.

Here’s the problem, though.? What do you reinvest in?? My article?How to Invest Carefully for Mom?took up some of the problem — if I were reducing exposure to stocks, I would invest in high quality short and long bonds, probably weighted 50/50 to 70/30 in that range.? Examples of tickers that I might consider be MINT and TLT.? Trouble is, you only get a yield of 2% on the mix.? The short bonds help if there is inflation, the long bonds help if there is deflation.? Both remove the risk of the stock market.

I’m also happier in running with my mix of international stocks and quality US value investments versus holding the S&P 500, because foreign and value have underperformed for so long, almost feels like 1999, minus the crazed atmosphere.

Now, Clements at the end of the exercise doesn’t want to make any big changes.? He still wants to play on at the ripe old age of 54.? He is concerned that his nest egg isn’t big enough.? Also, he thinks stocks will return 5-6%/year over the long haul (undefined), versus my model that says 2-6%/year over the next ten years.

What would I say?? I would say “do half.”? Whatever the amount you would cut from stocks to move to bonds if you were certain of it, do half of it.? If disaster strikes, you will pat yourself on the back for doing something.? If the market rallies further, you will be glad you didn’t do the whole thing.

What’s that, you say?? What am I doing?? At age 56, I am playing on, but 10-12% higher in the S&P 500, and I will hedge.? At levels like that future market outcomes are poor under almost every historical scenario, and even if the market doesn’t seem nuts in terms of qualitative signals, the amount you leave on the table is piddly over a 10-year horizon.? If I see more genuine nuttiness beyond certain logic-free zones in the market, I could act sooner, but for now, like Jonathan, I play on.

Full disclosure: long MINT and TLT for me and my fixed income clients

The Many Virtues of Simplicity

The Many Virtues of Simplicity

Photo Credit: Christopher || Maintaining a marriage is simple… if you do it right…

==============

There are at least eight reasons why taking a simple approach to investing is a wise thing to do.

  1. Understandable
  2. Explainable
  3. Reduced “Too smart for you own good risk”
  4. Clearer risk management
  5. Less trading
  6. Taxes are likely easier
  7. Not Trendy
  8. Cheap

Understandable

You have to understand your investments, even if it’s just at the highest overview level. ?If you don’t have that level of understanding, then at some point you will be tempted to change your investments during a period of market duress, and it will likely be a mistake. ?Panic never pays. ?How to avoid panic? ?Knowledge reduces panic. ?Whatever the strategy is, follow it in good times and bad. ?Understand how bad things can get before you start an investment program. ?Make changes if needed when things are calm, not in the midst of terror.

Explainable

You should be able to explain your investment strategy at a basic level, enough that you can convey it to a friend of equal intelligence. ?Only then will you know that you truly understand it. ?Also, in trying to explain it you will discover whether your investments are truly simple or not. ?Does your friend get it, even if he may not want to imitate what you are doing?

Take an index card and write out the strategy in outline form. ?Would you feel confident talking for one minute about it from the outline?

Reduced “Too smart for your own good risk”

If you have simple investments, you will tend not to get unexpected surprises. ?One reason the rating agencies did so badly in the last crisis was that they were forced to rate stuff for which they did not have good models. ?The complexity level was too high, but the regulators required ratings for assets held by banks and insurers, and so the rating agencies did it, earning money for it, but also at significant reputational risk.

Why did the investment banks get into trouble during the financial crisis? ?They didn’t keep things simple. ?They held a wide variety of complex, illiquid investments on their balance sheets, financed with short-term lending. ?When there was doubt about the value of those assets, their lenders refused to roll over their debts, and so they foundered, and most died, or were forced into mergers.

I try to keep things simple. ?Stocks that possess a margin of safety and high quality bonds are good investments. ?Stocks have enough risk, and high quality bonds are one of the few assets that truly diversify, along with cash. ?That makes sense from a structural standpoint, because fixed claims on future cash are different than participating in current profits, and the change in expectations for future profits.

Clearer risk management

When assets are relatively simple, risk management gets simple as well. ?Assets should succeed for the reasons that you thought they would in advance of purchase.? Risk assets should primarily generate capital gains over a full market cycle.? fixed Income assets help provide a floor, and limit downside, so long as inflation remains in check.

With simple asset allocations, you don’t tend to get negative surprises.? Does an income portfolio fall apart when the stock market does?? It probably was not high quality enough.? Does you asset allocation give large negative surprises close to retirement?? Maybe there were too many risk assets in the portfolio after a long bull run.

Cash and commodities (in small amounts) can help as well.? Those don’t have yield, and don’t typically provide capital gains, but they would help if inflation returned.

Less trading

Simplicity in asset allocation means you can sleep at night.? You’ve already determined how much you are willing to lose over the bear portion of a market cycle, so you aren’t looking to complicate your life through trying to time the market.? Few people have the disposition to sell near near top, and few?have the disposition to buy near near the bottom.? Almost no one can do both.? (I’m better at bottoms…)

Pick a day of the year — maybe use your half-birthday (as some of my kids would say — it is six months after your birthday).? Look at your portfolio, and adjust back to target percentages, if you need to do that.? Then put the portfolio away.? If you have set your asset allocation conservatively, you won’t feel the need to make radical changes, and over time, your assets should grow at a reasonable rate.? Remember, the more conservative asset allocation that you can live with permanently is far better than the less conservative one that you will panic over at the wrong time.

Taxes are likely easier

Not that many people have taxable accounts, though half the assets that I manage are taxable, but if you don’t trade a lot, taxes from your accounts are relatively easy.? Unrealized capital gains compound untaxed over time, and there is the option to donate appreciated stock if you want to get a write-off and eliminate taxes at the same time.

Not Trendy

You won’t get caught in fads that eventually blow up if you keep things simple.? You may be pleasantly surprised that you buy low more frequently than your trendy neighbors.? Remember, people always brag about their wins, but they never tell you about the losses, particularly the worst ones.? Those who don’t lose much, and take moderate risks typically win in the end.

Cheap

Simple investment strategies tend to have lower management fees, and fewer “soft” costs because they don’t trade as much.? That can be a help over the long run.

That’s all for this piece.? For most investors, simplicity pays off — it is that simple.

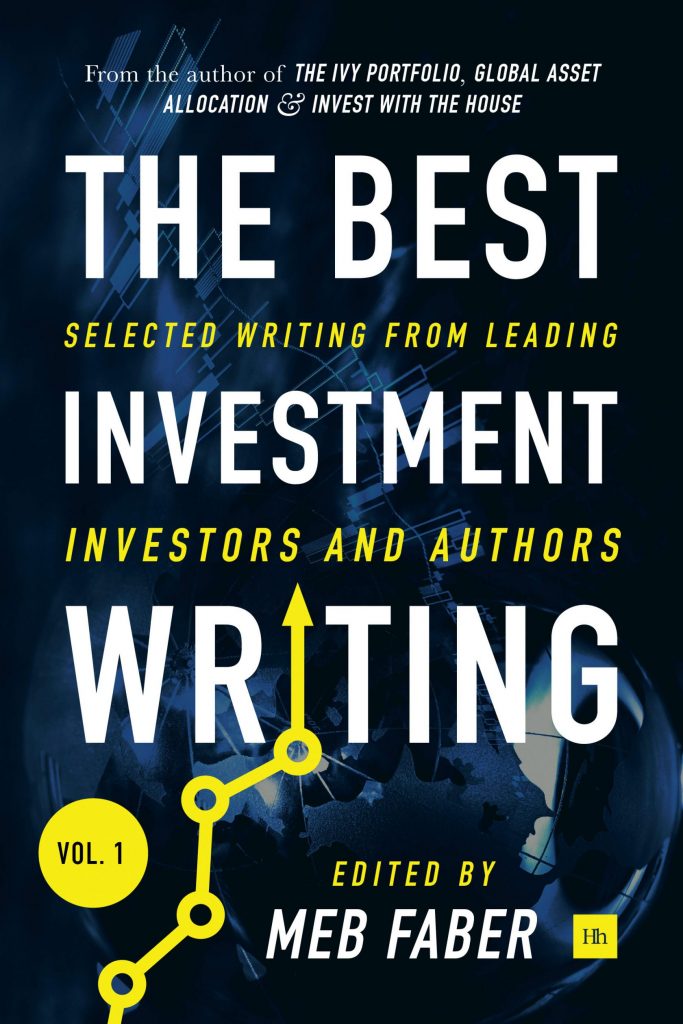
Book Review: The Best Investment Writing, Volume 1

Book Review: The Best Investment Writing, Volume 1

I was pleasantly surprised to be invited to contribute a chapter to this book.? I am going to encourage you to buy this book, but let me give some of the reasons not to buy this book:

  • Don’t buy it to give me something.? I don’t get anything from sales of this book.? Neither does Mebane Faber, who is giving all of the profits to charity.
  • Don’t buy it to read my article.? You can read it for free here.? Better, you can read the updated version of the article, which I publish quarterly, here.? (Those reading this at Amazon, there are links at my blog.? Google “Alephblog The Best Investment Writing” to find them.)
  • Don’t buy it to get current ideas.? There are none here.? The weakness of the book is that the articles are dated by 9-21 months or so, BUT… that doesn’t keep the book from being relevant.
  • Don’t buy it if you want one consistent theme.? It’s like reading RealMoney.com, except with a broader array of authors.? There is no “house view.”
  • Don’t buy it for the graphics in the book.? The grayscale images in the book are good for black & white, but some are hard to read.? The graphs for my article are far better at my blog.

The book is a good one because there is something for everyone here.? Do you want quantitative finance?? There is a good selection here. Do you want good basic articles about how to think about investing?? There are a good number of those as well, particularly from well-known financial journalists, and some of the most well-regarded bloggers.? Do you want a few unusual articles that might cause you consider some asset sub-classes or techniques that you haven’t considered before?? They are here too.

The writers fall into four buckets — journalists, asset managers, pundits/authors, and those who sell information at their websites.? I will tell you that my personal favorites from this volume are Tom Tresidder, Mebane Faber, Chris Meredith, Ben Carlson (how was he the only one with two articles in the book?), Jason Hsu & John West, and Cullen Roche.

Don’t get me wrong, I like almost all of the authors in this volume, and am proud to be featured among them.? For a number of them, though, I would have picked other things they have written in 2016 that had more punch, and offered more of a difference in perspective.

Why buy this?? After you read this, you will be a smarter, more well-rounded investor.? In my calculations, that’s? pretty good — 32 articles that will take you 4 hours to read.? Got seven minutes?? Read an article; it just might help you a great deal.

Quibbles

Already stated, though if you don’t like statistics, one-third of the articles may not appeal to you.? Also, a few articles veer into political commentary (not that I would ever do that 😉 ).

Summary / Who Would Benefit from this Book

Though almost anyone could benefit from this book, it is geared toward investors with intermediate-to-higher levels of knowledge and experience.? If you want to buy it, you can buy it here:?The Best Investment Writing: Selected writing from leading investors and authors.

Full disclosure:?I received two free copies of the book for contributing the article.? That’s all, unless someone buys the book through the link above.

If you enter Amazon through my site, and you buy anything, including books, I get a small commission. This is my main source of blog revenue. I prefer this to a ?tip jar? because I want you to get something you want, rather than merely giving me a tip. Book reviews take time, particularly with the reading, which most book reviewers don?t do in full, and I typically do. (When I don?t, I mention that I scanned the book. Also, I never use the data that the PR flacks send out.)

Most people buying at Amazon do not enter via a referring website. Thus Amazon builds an extra 1-3% into the prices to all buyers to compensate for the commissions given to the minority that come through referring sites. Whether you buy at Amazon directly or enter via my site, your prices don?t change.

Estimating Future Stock Returns, June 2017 Update

Estimating Future Stock Returns, June 2017 Update

I’d say this is getting boring, but it’s pretty fascinating watching the rally run. ?Now, this is the seventh time I have done this quarterly analysis. ?The first one was for December 2015. ?Over that time period, the expected annualized 10-year return went like this, quarter by quarter: 6.10%, 6.74%, 6.30%, 6.01%, 5.02%, 4.79%, and 4.30%. ?At the end of June 2017, the figure would have been 4.58%, but the rally since the end of the quarter shaves future returns down to 4.30%.

We are now in the 93rd percentile of valuations.

Wow.

This era will ultimately be remembered as a hot time in the markets, much like 1965-9, 1972, and 1997-2001.

The Internal Logic of this Model

I promised on of my readers that I would provide the equation for this model. ?Here it is:

10-year annualized total return = 32.77% – (70.11% * Percentage of total assets held in stocks for the US as a whole)

Now, the logic of this formula stems from the idea that the return on total assets varies linearly with the height of the stock market, and the return on debt (everything else aside from stocks) does not. ?After that, the formula is derived from the same formula that we use for the weighted average cost of capital [WACC]. ?Under those conditions, the total returns of the stock market can be approximated by a linear function of the weight the stocks have in the WACC formula.

Anyway, that’s one way to think of the logic behind this.

The Future?

Now, what are some of the possibilities for the future?

Above you see the nineteen scenarios for where the S&P 500 will be in 10 years, assuming a 2% dividend yield, and looking at the total returns that happen when the model forecasts returns between 3.30% and 5.30%. ?The total returns vary from 2.31%/year to 6.50%, and average out to 3.97% total returns. ?The bold line above is the 4.30% estimate.

As I have said before, this bodes ill for all collective security schemes that rely on the returns of risky assets to power the payments. ?There is no conventional way to achieve returns higher than 5%/year for the next ten years, unless you go for value and foreign markets (maybe both!).

Then again, the simple solution is just to lighten up and let cash build. ?Now if we all did that, we couldn’t. ?Who would be buying? ?But if enough of us did it such that equity valuations declined, there could be a more orderly market retreat.

The attitude of the market on a qualitative basis doesn’t seem nuts to me yet, so I am at maximum cash for ordinary conditions, but I haven’t hedged. ?When expected 10-year market returns get to 3%/year, I will likely do that, but for now I hold my stocks.

PS — the first article of this series has been translated into Chinese. ?The same website has 48 of my best articles in Chinese, which I find pretty amazing. ?Hope you smile at the cartoon version of me. 😉

How to Invest Carefully for Mom

How to Invest Carefully for Mom

Photo Credit: stewit

========

Just a note before I begin. My piece called “Where Money Goes to Die” was an abnormal piece for me, and it received abnormal attention. ?The responses came in many languages aside from English, including Spanish, Turkish and Russian. ?It was interesting to note the level of distortion of my positions among those writing articles. ?That was less true of writing responses here.

My main point is this: if something either has no value or can’t be valued, it can’t be an investment. ?Speculations that have strong upward price momentum, like penny stocks during a promotion, are dangerous to speculate in. ?Howard Marks, Jamie Dimon and Ray Dalio seem to agree with that. ?That’s all.

Now for Q&A:

Greetings and salutations. ?:)

Hope all is well with you and the family!

Just have what I believe is a quick question. I already know [my husband’s] answer to this (Vanguard index funds – it his default answer to all things investment), but this is for my Mom, so it is important that she get it right (no wiggle room for losing money in an unstable market), hence my asking you. My Mom inherited money and doesn’t know what to do with it. a quarter of it was already in index funds/mutual funds and she kept it there. The rest came from the sale of real estate in the form of a check. That is the part that she doesn’t know what she should do with. She wanted to stick it in a CD until she saw how low the interest rates are. She works intermittently (handyman kind of work – it is demand-dependent), but doesn’t have any money saved in a retirement account or anything like that, so she needs this money get her though the rest of her life (she is almost 60). What would you recommend? What would you tell [name of my wife] to do if she were in this position? BTW, it is approx $ZZZ, if that makes a difference. Any advice you can give would be very much appreciated!

Vanguard funds are almost always a good choice. ?The question here is which Vanguard funds? ?To answer that, we have to think about asset allocation. ?My thoughts on asset allocation is that it is a marriage of two concepts:

  • When will you need to spend the money? and
  • Where is there the opportunity for good returns?

Your mom is the same age as my wife. ?A major difference between the two of them is that your mom doesn’t have a lot of investable assets, and my wife does. ?We have to be more careful with your mom. ?If your mom is only going to draw on these assets in retirement, say at age 67, and will draw them down over the rest of her life, say until age 87, then the horizon she is investing over is long, and should have stocks and longer-term bonds for investments.

But there is a problem here. ?Drawing on an earlier article of mine, investors today face a big problem:

The biggest problem for investors is low future returns. ?Bonds have low rates of returns, and equities have high valuations. ?You?ll see more about equity valuations in my next post.

This is a real problem for those wanting to fund retirements. ?Stocks are priced to return around 4%/year over the next ten years, and investment-grade longer bonds are around 3%. ?There are some pockets of better opportunity and so I suggest the following:

  • Invest more in foreign and emerging market stocks. ?The rest of the world is cheaper than the US. ?Particularly in an era where the US is trying to decouple from the rest of the world, foreign stocks may provide better returns than US stocks for a while.
  • Invest your US stocks in a traditional “value” style. ?Admittedly, this is not popular now, as value has underperformed for a record eight years versus growth investing. ?The value/growth cycle will turn, as it did back in 2000, and it will give your mom better returns over the next ten years.
  • Split your bond allocation into two components: long US high-quality bonds (Treasuries and Investment Grade corporates), and very short bonds or a money market fund. ?The long bonds are there as a deflation hedge, and the short bonds are there for liquidity. ?If the market falls precipitously, the liquidity is there for future investments.

I would split the investments 25%, 35%, 20%, 20% in the order that I listed them, or something near that. ?Try to sell your mom on the idea of setting the asset allocation, and not sweating the short-term results. ?Revisit the strategy every three years or so, and rebalance annually. ?If assets are needed prematurely, liquidate the assets that have done relatively well, and are above their target weights.

I know you love your mom, but the amount of assets isn’t that big. ?It will be a help to her, but it ultimately will be a supplement to Social Security for her. ?Her children, including you and your dear husband may ultimately prove to be a greater help for her than the assets, especially if the markets don’t do well. ?The asset allocation I gave you is a balance of offense and defense in an otherwise poor environment. ?The above advice also mirrors what I am doing for my own assets, and the assets of my clients, though I am not using Vanguard.

Overvaluation is NOT Due to Passive Investing

Overvaluation is NOT Due to Passive Investing

Photo Credit: Hagens_world || I want to buy 1% of all of the items there in one nice neat package! 😉

============

There’s been a lot of words thrown around lately saying that indexing has been leading to overvaluation of the US stock market. ?I’m here to tell you that is wrong. ?I have two reasons for that:

1) Active managers have been pseudo-indexing for a long time. ?The moment they get benchmarked to an index they do one of two things:

a) accept it, gain funds for mandates that are like the index, and then they constrain their investing so that they are never too different from the index, and hopefully not in the fourth quartile of performance, so they don’t lose assets. ?This is the action of the majority.

b) Ignore it, get less fund flows, and don’t let the index affect your investment decisions. ?The assets should be stickier over time if you explain to clients what you are doing, and why. ?Only a minority do this.

This has been my opinion since my days of writing for RealMoney. All of the active managers out there add up to something close to a passive benchmark, less fees. ?It can’t be otherwise.

The one exception of any size would be stocks excluded from indexes because they don’t have enough free float available for non-insiders to own/trade. ?Even that is not very big — it might be 5% of the total stock market, though this is just a wild guess.

2) If you want to talk about valuation issues, you really want to talk about the trade-off between stocks and bonds, or stocks and cash. ?Stock valuations are never absolute — it is always a question of the other assets you are measuring the stocks against, and how you desirable those other assets will be in the future, and how sustainable the profitability of stocks will be over time. ?I broke apart some of these issues in my piece?The Dead Model. ?Desirability of stock investing can be broken into three components: maturity risk, credit risk and business risk. ?At present, the first two are getting thinner. ?The last one is thicker, and at least at present, there is no great rush to encourage people to trade slack cash for newly issued shares of stock. ?If anything, stock is getting retired on net. ?(Just a guess.)

Part of this stems from demographics: the Baby Boomers and others still sock away money so that they can get payments in the future, when they are too old to work much. ?That’s the maturity risk that I mentioned above, and the reward from that is low because so many are trying to do it. ?Flat yield curve and low overall yields are the cause of a lot of worries for investors. ?The same thing applies to credit spreads: people are searching for yield, and it leads them far afield — that said, I don’t see a lot of obvious places where credit metrics look bad, aside from auto loans, student loans, and overleveraged governments.

The demographic effect means that nothing looks safe and cheap. ?Yields are low, and price/earnings multiples are high. ?The question is what could lead those to change. ?When the markets are pricing in something like continued perfection, sometimes it doesn’t take much to jolt them out of what is an unstable equilibrium. (Note: contrary to neoclassical economics, most economic equilibria are unstable.)

Profit margins could fall, but most of the factors underpinning high profit margins look pretty strong — using technology to make labor more productive, ability to shift work globally to talented people who are paid less, and clever uses of accounting to reduce taxable income and tax rates seem intact, if not growing.

That said, remember my saying:

Governments are smaller than markets; markets are smaller than cultures.

There is always the possibility of a shock happening that no one expects:

  1. War, even if undeclared
  2. Cultural unrest leading to political change: remember the partial nationalization of Amazon and Google that took place in 2030? ?They got broken up and parts were turned into utilities by the US government because they were so pervasive, and then foreign governments expropriated their local assets, and banned them in their countries.
  3. Another example could be a type of Luddite behavior that attempted to force corporations to hire people proportionate to the profits.
  4. Hyperinflation in Japan, or somewhere else big.
  5. China has a bigger credit crisis than its last one, leading to drops in commodity prices, and further global deflation.

Point 2 was a joke, but meant to illustrate how cultural systems abhor entities that get too powerful.

Closing

I do think stock valuations are high, but the best way to see that is in my quarterly post on stock valuations. ?It takes into account the changing preferences economic actors have regarding what assets they hold — this is one indicator that explicitly reflects actual changes in stock and bond issuance and retirement, as well as changes induced by the Fed in creating more cash and credit, or, destroying it.

Passive investing is a sideshow as far as stock valuations go. ?Pay attention to the supply and demand for stock on the whole, and the factors that might lead supply and demand to change.

Theme: Overlay by Kaira