Search Results for: "we eat dollar"

We Eat Dollar Weighted Returns ? III (Update)

Photo Credit: Sitoo || No, you can’t eat money. But without money farmers would have a hard time buying what they need to grow crops, and we would have a hard time bartering to buy the crops
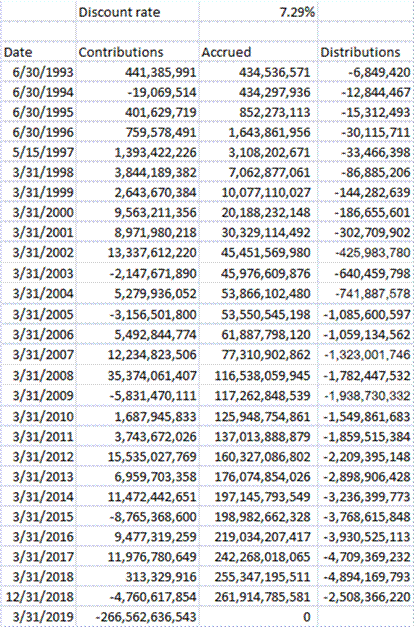
Data obtained from filings at SEC EDGAR

Tonight I am going to talk about one of the most underrated concepts in finance — the difference between dollar-weighted and time-weighted returns, and why it matters.

So far on this topic, I have done at least seven articles in this series, and you can find them here. The particular article that I am updating is number 3, which deals with the granddaddy of all ETFs, the SPDR S&P 500 ETF (SPY), which has been around now for almost 27 years. It is the largest ETF in the world, as far as I know.

From the end of January 1993 to the end of March 2019, SPY returned 9.42%/year on a time-weighted or total return basis. What that means is that if you had bought at the beginning and held until the end, you would have received an annualized return of 9.42%. Pretty good I say, and that is an advertisement for buy and hold investing. It is usually one of the top investing strategies, and anyone can do it if they can control their emotions.

Over the same period, SPY returned 7.29%/year on a dollar-weighted basis. What this means is if you took every dollar invested in the fund and calculated what it earned over the timespan being analyzed, they would have received an annualized return of 7.29%.

That’s an annualized difference of 2.13%/year over a 26+ year period. That is a serious difference. Why? Where does the difference come from? It comes partially from greed, but mostly from panic. More shares of SPY get created near market peaks when everyone is bullish, and fewer get created, or more get liquidated near market bottoms. Many investors buy high and sell low — that is where the difference comes from. This also is an advertisement for buy and hold investing, albeit a negative one — “Don’t Let This Happen To You.”

Comparison with the 2012 Article

Now, I know few people actually look at the old articles when I link to them. But for the sharp readers who do, they might ask, “Hey, wait a minute. In the old article, the difference was much larger. Time-weighted was 7.09%/year and dollar-weighted was 0.01%/year. Why did the difference shrink?” Good question.

The differences between time- and dollar-weighted returns stems mostly from behavior at turning points. As I have pointed out in prior articles, typically the size of the difference varies with the overall volatility of the fund. People get greedy and panic more with high-volatility investments, and not with low-volatility investments.

That said, most of the effects of the difference are created at the turning points. During the midst of a big move up or down, the amount of difference between dollar- and time-weight returns is relatively small. The big differences get created near the top (buying) and the bottom (selling).

So, since the article in 2012, the fund has grown from $80 billion to over $260 billion at the end of March 2019. There have been no major pullbacks in that time — it has been a continuous bull market. We will get to see greater divergence after the next bear market starts.

Be Careful what you Read about Dollar-Weighted Returns

I’m not naming names, but there are many out there, even among academics that are doing dollar-weighted returns wrong. They think that differences as cited in my articles are too large and wrong.

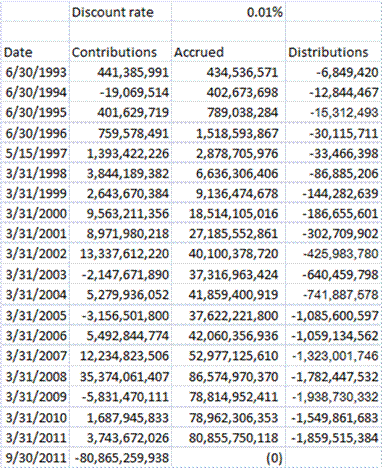
The idea behind dollar-weighted return is to run an Internal Rate of Return calculation. To do that you have to have a list of the inflows and outflows by date, together with the market value of the fund at the end as an outflow, and calculate the single rate that discounts the net present value of all the flows to zero. That rate is the dollar-weighted return, and you can use the XIRR function is Excel to help you calculate it. (Note that my calculations use a mid-period assumption for when the cash flows.)

The error I have seen is that they try to make the dollar-weighted calculation like that of the time-weighted, creating period by period values. Now, there is a way to do that, and you can see that in the appendix below. As far as I can tell, they are not doing what I will write in the Appendix. Instead, they treat each year like its own separate investing period and calculate the IRR of that year only, and then daisy-chain them like annual returns for a time-weighted calculation.

Now, the time-weighted calculation does not care at all about investor-driven cash flows, like purchases and sales of fund shares, aside from dividend payments and things like that. It does not care about the size of the fund. It just wants to calculate what return a buy and hold investor gets. [Just remember the rule that an NAV must be calculated any time there is a cash flow of any sort, otherwise some inequity takes place.]

The dollar-weighted calculation cares about all investor cash flows, and ultimately about the size of the fund at the end of the calculation. It doesn’t care about when the returns are earned, but only when the cash flows in and out of the investment.

The odd hybrid method is neither fish nor fowl. Time-weighted corresponds to buy and hold, and dollar-weighted to the returns generated by each dollar in the fund. The hybrid says something like this: “We will calculate the IRR each year, but then normalize the fund size each year to the same starting level so that the fund flows at tops and bottoms do not compound. Then we show them year-by-year so that the returns are comparable to the total returns for each year.

As H. L. Mencken said:

Explanations exist; they have existed for all time;?there is always a well-known solution to every human problem?neat, plausible, and wrong.

Source: Quote Investigator citing Mencken’s book “Prejudices: Second Series”

In an effort to make a simple annual comparison between the two, they eradicate most of the effects of selling low and buying high. More in the Appendix.

Summary

Be aware of the difference between dollar-weighted and time-weighted returns. If you have a strong control on your emotions, this is not as important. If you tend to panic, this is very important. It is more important if you buy highly volatile investments, and less so if you size your volatility to your ability to bear it.

To fund managers I would say this: if you are tired of all of the inflows and outflows, and are tired of getting whipsawed by your clients, maybe you should take a step back and lower the overall risks you are taking. This will benefit both you and your clients.

Appendix

Here’s how to run an annual calculation of dollar weighted returns that be correct. For purposes of simplicity, I will assume a simple annual calculation that has multiple cash flows inside it. (If we are working with a US-based mutual fund, there would be reporting of change in net assets every six months.)

Calculate the first year (dw1) the way the hybrid method does. No difference yet. Then for the second year, run the IRR calculation for the full two-year period (IRR2). Then the second year only dollar-weighted return (dw2) would be:

((1+ IRR2) ^2) / (1+dw1) -1 = dw2

and for each successive period it would be:

(1+IRR[n])^n(1+IRR[n-1])^(n-1) – 1 = dw[n]

That is more complex than what they do, but it would preserve the truths that each entail. It would make the values for the yearly dollar-weighted returns look odd, but hey, you can’t have everything, and the truth sometimes hurts.

Full disclosure: a few of my clients are short SPY as part of a hedged strategy.

We Eat Dollar Weighted Returns ? VII

We Eat Dollar Weighted Returns ? VII

Photo Credit: Fated Snowfox

I intended on writing this at some point, but Dr. Wesley Gray (an acquaintance of mine, and whom I respect) beat me to the punch. ?As he said in his blog post at The Wall Street Journal’s The Experts blog:

WESLEY GRAY: Imagine the following theoretical investment opportunity: Investors can invest in a fund that will beat the market by 5% a year over the next 10 years. Of course, there is the catch: The path to outperformance will involve a five-year stretch of poor relative performance.? ?No problem,? you might think?buy and hold and ignore the short-term noise.

Easier said than done.

Consider Ken Heebner, who ran the CGM Focus Fund, a diversified mutual fund that gained 18% annually, and was Morningstar Inc.?s highest performer of the decade ending in 2009. The CGM Focus fund, in many respects, resembled the theoretical opportunity outlined above. But the story didn?t end there: The average investor in the fund lost 11% annually over the period.

What happened? The massive divergence in the fund?s performance and what the typical fund investor actually earned can be explained by the ?behavioral return gap.?

The behavioral return gap works as follows: During periods of strong fund performance, investors pile in, but when fund performance is at its worst, short-sighted investors redeem in droves. Thus, despite a fund?s sound long-term process, the ?dollar-weighted? returns, or returns actually achieved by investors in the fund, lag substantially.

In other words, fund managers can deliver a great long-term strategy, but investors can still lose.

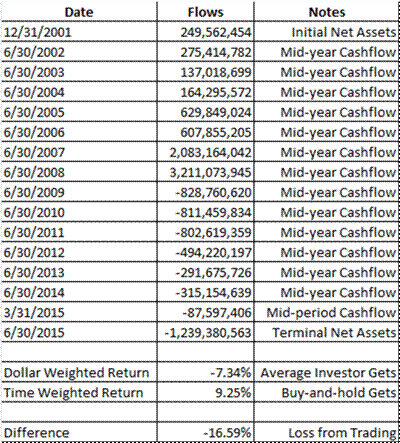
CGMFX Dollar Weighted_1552_image002That’s why I wanted to write this post. ?Ken Heebner is a really bright guy, and has the strength of his convictions, but his investors don’t in general have similar strength of convictions. ?As such, his investors buy high and sell low with his funds. ?The graph at the left is from the CGM Focus Fund, as far back as I could get the data at the SEC’s EDGAR database. ?The fund goes all the way back to late 1997, and had a tremendous start for which I can’t find the cash flow data.

The column marked flows corresponds to a figure called “Change in net assets derived from capital share transactions” from the Statement of Changes in Net Assets in the annual and semi-annual reports. ?This is all public data, but somewhat difficult to aggregate. ?I do it by hand.

I use annual cashflows for most of the calculation. ?For the buy and hold return, i got the data from Yahoo Finance, which got it from Morningstar.

Note the pattern of cashflows is positive until?the financial crisis, and negative thereafter. ?Also note that more has gone into the fund than has come out, and thus the average investor has lost money. ?The buy-and-hold investor has made money, what precious few were able to do that, much less rebalance.

This would be an ideal fund to rebalance. ?Talented manager, will do well over time. ?Add money when he does badly, take money out when he does well. ?Would make a ton of sense. ?Why doesn’t it happen? ?Why doesn’t at least buy-and-hold happen?

It doesn’t happen because there is a Asset-Liability mismatch. ?It doesn’t matter what the retail investors say their time horizon is, the truth is it is very short. ?If you underperform for less?than a few years, they yank funds. ?The poetic justice is that they yank the funds just as the performance is about to turn.

Practically, the time horizon of an average investor in mutual funds is inversely proportional to the volatility of the funds they invest in. ?It takes a certain amount of outperformance (whether relative or absolute) to get them in, and a certain amount of underperformance to get them out. ?The more volatile the fund, the more rapidly that happens. ?And Ken Heebner is so volatile that the only thing faster than his clients coming and going, is how rapidly he turns the portfolio over, which is once every 4-5 months.

Pretty astounding I think. ?This highlights two main facts about retail investing that can’t be denied.

  1. Asset prices move a lot more than fundamentals, and
  2. Most investors chase performance

These two factors lie behind most of the losses that retail investors suffer over the long run, not active management fees. ?remember as well that passive investing does not protect retail investors from themselves. ?I have done the same analyses with passive portfolios — the results are the same, proportionate to volatility.

I know buy-and-hold gets a bad rap, and it is not deserved. ?Take a few of my pieces from the past:

If you are a retail investor, the best thing you can do is set an asset allocation between risky and safe assets. ?If you want a spit-in-the-wind estimate use 120 minus your age for the percentage in risky assets, and the rest in safe assets. ?Rebalance to those percentages yearly. ?If you do that, you will not get caught in the cycle of greed and panic, and you will benefit from the madness of strangers who get greedy and panic with abandon. ?(Why 120? ?End of the mortality table. 😉 Take it from an investment actuary. 😉 We’re the best-kept secret in the financial markets. 😀 )

Okay, gotta close this off. ?This is not the last of this series. ?I will do more dollar-weighted returns. ?As far as retail investing goes, it is the most important issue. ?Period.

We Eat Dollar Weighted Returns ? VI

We Eat Dollar Weighted Returns ? VI

Photo Credit: Lynne Hand

One of the constants in investing is that average investors show up late to the party or to the crisis. ?Unlike many gatherings where it may be cool to be fashionably late, in investing it tends to mean you earn less and lose more, which is definitely not cool.

One reason why this happens is that information gets distributed in lumps. ?We don’t notice things in real time, partly because we’re not paying attention to the small changes that are happening. ?But after enough time passes, a few people notice a trend. ?After a while longer, still more people notice the trend, and it might get mentioned in some special purpose publications, blogs, etc. ?More time elapses and it becomes a topic of conversation, and articles make it into the broad financial press. ?The final phase is when?general interest magazines put it onto the cover, and get rich quick articles and books point at how great fortunes have been made, and you can do it too!

That slow dissemination and?gathering of information is paralleled by a similar flow of money, and just as the audience gets wider, the flow of money gets bigger. ?As the flow of money in or out gets bigger, prices tend to overshoot fair value, leaving those who arrived last with subpar returns.

There is another aspect to this, and that stems from the way that people commonly evaluate managers. ?We use past returns as a prologue to what is assumed to be still?greater returns in the future. ?This not only applies to retail investors but also many institutional investors. ?Somme institutional investors will balk at this conclusion, but my experience in talking with institutional investors has been that though they look at many of the right forward looking indicators of manager quality, almost none of them will hire a manager that has the right people, process, etc., and has below average returns relative to peers or indexes. ?(This also happens with hedge funds… there is nothing special in fund analysis there.)

For the retail crowd it is worse, because?most investors look at past returns when evaluating managers. ?Much as Morningstar is trying to do the right thing, and have forward looking analyst ratings (gold, silver, bronze, neutral and negative), yet much of the investing public will not touch a fund unless it has four or five stars from Morningstar, which is a backward looking rating. ?This not only applies to individuals, but also committees that choose funds for defined contribution plans. ?If they don’t choose the funds with four or five stars, they get complaints, or participants don’t use the funds.

Another Exercise in Dollar-Weighted Returns

One of the ways this investing shortfall gets expressed is looking at the difference between time-weighted (buy-and-hold) and dollar-weighted (weighted geometric average/IRR) returns. ?The first reveals what an investor who bought and held from the beginning earned, versus what the average dollar invested earned. ?Since money tends to come after good returns have been achieved, and money tends to leave after bad returns have been realized, the time-weighted returns are typically higher then the dollar-weighted returns. ?Generally, the more volatile the performance of the investment vehicle the larger the difference between time- and dollar-weighted returns gets. ?The greed and fear cycle is bigger when there is more volatility, and people buy and sell at the wrong times to a greater degree.

(An aside: much as some pooh-pooh buy-and-hold investing, it generally beats those who trade. ?There may be intelligent ways to trade, but they are always a minority among market actors.)

HSGFX Dollar Weighted Returns
HSGFX Dollar and Time Weighted Returns

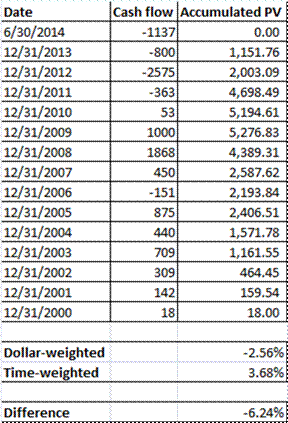
That brings me to tonight’s fund for analysis: Hussman Strategic Growth [HSGFX]. John Hussman, a very bright guy, has been trying to do something very difficult — time the markets. ?The results started out promising, attracting assets in the process, and then didn’t do so well, and assets have slowly left. ?For my calculation this evening, I run the calculation on his fund with the longest track record from inception to 30 June 2014. ?The fund’s fiscal years end on June 30th, and so I assume cash flows occur at mid-year as a simplifying assumption. ?At the end of the scenario, 30 June 2014, I assume that all of the funds remaining get paid out.

To run this calculation, I do what I have always done, gone to the SEC EDGAR website and look at the annual reports, particularly the section called “Statements of Changes in Net Assets.” ?The cash flow for each fiscal year is equal to the?net increase in net assets from capital share transactions plus the net decrease in net assets from distributions to shareholders. ?Once I have?the amount of money moving in or out of the fund in each fiscal year, I can then run an internal rate of return calculation to get the dollar-weighted rate of return.

In my table, the cash flows into/(out of) the fund are in millions of dollars, and the column titled Accumulated PV is the?accumulated present value calculated at an annualized rate of -2.56% per year, which is the dollar-weighted rate of return. ?The zero figure at the top shows that a discount rate -2.56% makes the cash inflows and outflows net to zero.

From the beginning of the Annual Report for the fiscal year ended in June 2014, they helpfully provide the buy-and-hold return since inception, which was +3.68%. ?That gives a difference of 6.24% of how much average investors earned less than the buy-and-hold investors. ?This is not meant to be a criticism of Hussman’s performance or methods, but simply a demonstration that a lot of people invested money after the fund’s good years, and then removed money after years of underperformance. ?They timed their investment in a market-timing fund poorly.

Now, Hussman’s fund may do better when the boom/bust cycle turns if his system makes the right move?somewhere near the bottom of the cycle. ?That didn’t happen in 2009, and thus the present state of affairs. ?I am reluctant to criticize, though, because I tried running a strategy like this for some of my own clients and did not do well at it. ?But when I realized that I did not have the personal ability/willingness to?buy when valuations were high even though the model said to do so because of momentum, rather than compound an error, I shut down the product, and refunded some fees.

One thing I can say with reasonable confidence, though: the low returns of the past by themselves are not a reason to not invest in Mr. Hussman’s funds. ?Past returns by themselves tell you almost nothing about future returns. ?The hard questions with a fund like this are: when will the cycle turn from bullish to bearish? ?(So that you can decide how long you are willing to sit on the sidelines), and when the cycle turns from bearish to bullish, will Mr. Hussman make the right decision then?

Those questions are impossible to answer with any precision, but at least those are the right questions to ask. ?What, you’d rather have the answer to a simple question like how did it return?in the past, that has no bearing on how the fund will do in the future? ?Sadly, that is the answer that propels more investment decisions than any other, and it is what leads to bad overall investment returns on average.

PS — In future articles in this irregular series, I will apply this to the Financial Sector Spider [XLF], and perhaps some fund of Kenneth Heebner’s. ?Till then.

We Eat Dollar Weighted Returns ? V

We Eat Dollar Weighted Returns ? V

This is the first episode of “We Eat Dollar Weighted Returns” where the fare is yummy.? Here’s the twist: investors in some bond ETFs have done better than one who bought at the beginning and held.

Now, all of this is history-dependent.? The particular bond funds I chose were among the largest and most well-known bond ETFs — HYG (iShares iBoxx $ High Yield Corporate Bd), JNK (SPDR Barclays Capital High Yield Bond), and TLT (iShares Barclays 20+ Year Treas Bond).

As bond funds go, these are relatively volatile.? TLT buys the longest Treasury bonds, taking interest rate risk.? HYG and JNK buy junk bonds, taking credit risk.

Let’s start with TLT:

Date

Cash Flow

Buy & Hold Return

Cumulated

11/9/2002

248,935,892

1

8/31/2003

-73,889,166

12.31%

1.1231

8/31/2004

439,348,999

3.11%

1.15802841

8/31/2005

73,509,821

6.72%

1.235847919

8/31/2006

442,211,811

6.12%

1.311481812

8/31/2007

165,784,828

3.37%

1.355678749

8/31/2008

-344,202,681

9.54%

1.485010502

8/31/2009

887,336,789

12.30%

1.667666793

8/31/2010

120,142,522

-5.85%

1.570108286

8/31/2011

-452,062,384

4.64%

1.64296131

2/29/2012

-3,038,265,474

32.32%

2.173966406

IRR

Buy & Hold

Difference

11.47%

8.42%

3.05%

I analyzed this back in June, saw the anomalous result, an decide to sit on it until I had more time to analyze it.? The way to think about it is that investors reached for yield at a time when stocks were in trouble, and indeed, rates went lower.? The average investor beat buy-and-hold by 3%.

Here are the results for the junk ETFs:

HYG

4/4/2007

2/29/2008

2/28/2009

2/28/2010

2/28/2011

2/29/2012

Distributions

-9,708

-92,708

-358,324

-512,979

-694,209

Net Additions

371,140

1,989,303

1,781,425

3,201,608

5,840,594

Net Assets

352,636

2,089,054

4,611,414

8,257,928

14,258,718

Investment Return

-8,796

-160,176

1,099,260

957,884

854,406

ROA

-4.57%

-13.12%

32.81%

14.89%

7.59%

4/4/2007

9/16/2007

8/29/2008

8/29/2009

8/29/2010

8/30/2011

2/29/2012

13.40%

IRR

-361,432

-1,896,594

-1,423,100

-2,688,629

-5,146,384

14,258,718

6.04%

Buy-and hold

7.36%

Difference
JNK

11/28/2007

6/30/2008

6/30/2009

6/30/2010

6/30/2011

6/30/2012

Distributions

-9,011

-111,409

-361,521

-616,525

-735,822

Net Additions

404,658

1,481,309

2,180,582

2,366,102

3,928,526

Net Assets

394,346

1,900,709

4,301,252

6,915,538

10,780,535

Investment Return

-1,302

136,463

581,481

864,710

672,292

ROA

-0.61%

11.89%

18.75%

15.42%

7.60%

IRR

11/28/2007

3/14/2008

12/29/2008

12/29/2009

12/29/2010

12/30/2011

6/30/2012

13.22%

IRR

-395,648

-1,369,900

-1,819,061

-1,749,577

-3,192,704

10,780,535

6.49%

Buy-and hold

6.73%

Difference

Both funds were small in advance of the credit crisis, and investors bought into them as yields spiked, and bought even more as income opportunities diminished largely due to the Fed’s low-rate monetary policies. The average investor beat buy-and-hold by 6%+.

Now, the? junk funds were small during default, and grew during the boom, amid unprecedented monetary [policy from the Fed.? (Note: I think that Bernanke will rank below Greenspan in the history books in 210o, and both will be judged to be horrendous failures.? It is better to let things fail, and clear out the bad debt, rather than continue malinvestment.? We need fewer banks, houses, and auto companies, among others.? The government, including the Fed and the GSEs, should not be in the lending business.? Lending should be unusual, and applied mostly to financing short-term assets.? Long-term assets should be financed by equity, or at worst, long-dated debt.

For all three funds, we have the historical accident that the Fed dropped Fed funds rates to near zero, leading to a yield frenzy.? But what happens when defaults spike?? What? happens when no one want to buy long dated Treasuries at anything near current levels?

I think bond investors are more rational than stock investors; they have more rational benchmarks to guide them.? Bond investors have cash flows to analyze against EBITDA (earnings before interest, taxes, depreciation and amortization.? Stock investors wonder at earnings, which are easily gamed.

The real question will come when we have the next credit crisis?? How many holders of HYG or JNK will run then?? Or when inflation starts to run, and the Fed stops buying long Treasury bonds, and even starts to sell them, what will happen to dollar-weighted returns then?

This is an interesting piece for bond assets in a bull market.? We need to see bear market results to truly understand what is going on.

Full disclosure: long TLT for myself and clients

We Eat Dollar Weighted Returns ? IV

We Eat Dollar Weighted Returns ? IV

I think one of the largest areas for practical investigation in finance is reviewing dollar-weighted versus time weighted returns, especially for vehicles that are traded heavily.? I am going to try to analyze one major ETF per month to see what the level of slippage is due to trading.

But if my hypothesis is wrong, I’ll post on it anyway.? The last post I did on this was on SPY, the S&P 500 Spider.? The slippage was 7%+/year.

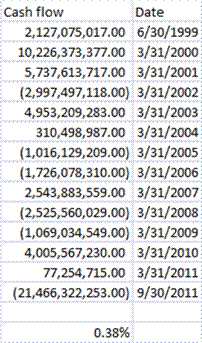
Now I have done the calculation for the QQQ, the PowerShares QQQ Trust, which mimics the Nasdaq 100.? The Nasdaq 100 is more volatile than the S&P 500, so I expected the gap to be worse, but it wasn’t: from the inception in March 1999 to the end of the fiscal year in September of 2011, the dollar weighted return was 0.38%/year versus a time-weighted return that a buy-and-hold investor would get of 0.77%/year.? 0.4% of difference isn’t much to talk about.? It still indicates a little bad trading.

That said, the net amount of unit creation and liquidation tended to be small.? Maybe that is the difference.? I have to think more about this, but my advice to anyone using exchange traded products remains the same — read your prospectus carefully, and understand the weaknesses of the vehicle.? If creation units don’t have to be something exact, ask what that might imply for your returns.

Anyway, here were the figures from my dollar-weighted return calculation:

I used annual data, and assumed midperiod dates for the cashflows.

The next ETF I plan to analyze is XLF, the Financial Sector Spider.? I suspect that will look bad, but who knows?
Full disclosure: short SPY in some hedged accounts.

We Eat Dollar Weighted Returns — III

We Eat Dollar Weighted Returns — III

Somebody notify the Bogleheads, they will like this one, or at least Jack will.? Yo, Jack, I met you over 15 years ago at a Philadelphia Financial Analysts Society meeting.

How bad are individual investors? at investing?? Bad, very bad.? But what if we limit it to a passive vehicle like the Grandaddy of all ETFs, the S&P 500 Spider [SPY]?? Should be better, right?

I remember a study done by Morningstar, where the difference between Time and Dollar-weighted returns was 3%/year on the S&P 500 open end fund for Vanguard, 1996-2006.

But here’s the result for the S&P 500 Spider, January 1993- September 2011.? Time-weighted return: 7.09%/year.? Dollar-weighted: 0.01%/yr.? Gap: 7%/yr+

Why so much worse than the open-end fund?? Easy.? Unlike the professional managers at Vanguard, and the relatively long term investors they attract, the retail short term traders of SPY trade badly; they arrive late, and leave late on average.

There is far more analysis to be done here, but to me, this confirms that Jack Bogle was right, and ETFs would be a net harm to retail investors.? The freedom to trade harms average investors, and maybe a lot of professionals as well.? It may also indicate that short-term trading as practiced by technicians may underperform in aggregate.? Not sure about that, but the conclusion is tempting.

One thing I will say: I am certain that profitable trading is not easy.? If you are tempted to trade for a living, the answer is probably don’t.

Anyway, here’s my spreadsheet on the topic:


Full disclosure: I have a few clients short SPY, hedged against my long positions.

We Eat Dollar-Weighted Returns

We Eat Dollar-Weighted Returns

Why do we do time-weighted returns for analysis of portfolios?? Because we are lazy, and they are simple to calculate.? We don’t want to be bothered with the effects of cash flows.

Besides, mutual fund managers don’t make decisions to move money in and out of their funds.? They should not be held accountable for the actions of their shareholders.

Really?? I think that is only half correct.? The good fund manager takes account of his implicit liability structure.? When will people leave, when will they come?? For almost all funds, investors are trend followers.? And the the greater the degree of volatility, the worse the investors are at following the trend.? Thus a manager of a volatile fund should run with more of a cash buffer, particularly when markets are moving down hard, because he will have more of his clients cashing out.? The manager of a volatile fund should also avoid taking concentrated positions, because when he is doing well, his own buying may drive the stocks he owns up, only to see them fall harder when he is forced to liquidate positions when the market is doing poorly, and shareholders are leaving.? Wise managers concentrate near bottoms, and diversify near tops.

Now for my poster child, the Legg Mason Value Trust.? Bill Miller is a very intelligent guy, and has a very talented staff.? My main criticism of his management is that it neglects the core concept of value investing, which is “margin of safety.”? The core concept is not cheapness, or as Bill Miller was fond of saying “lowest average cost wins.”

Legg Mason Value Trust enthused investors as they racked up significant returns in the late 90s, and the adulation persisted through 2006.? As Legg Mason Value Trust grew larger it concentrated its positions.? It also did not care much about margin of safety in financial companies.? It bought cheap, and suffered as earnings quality proved to be poor.

Eventually, holding a large portfolio of concentrated, lower-quality companies as the crisis hit, the performance fell apart, and many shareholders of the fund liquidated, exacerbating the losses of the fund, and their selling pushed the prices of their stocks down, leading to more shareholder selling.? I’m not sure the situation has stabilized, but it is probably close to doing being there.

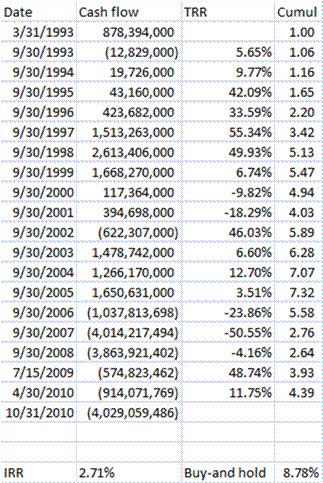
But now to the point: what did Bill Miller earn for shareholders?? The earliest date that I could get data for was 3/31/1993, probably due to the creation of EDGAR in the mid-90s.

On a dollar-weighted basis, he earned 2.71%/year for investors through 10/31/2010.? But for those stout-hearted souls that bought and held, they earned 6%+ more, 8.78%.? But those that did that had to be patient, even Stoic, people who had no need for liquidity, and no propensity for panic.? (There is always enough time to panic. 😉 )

Legg Mason Value Trust was a volatile fund, and as such, it is no surprise that the difference between time-weighted and dollar-weighted returns are so large.? But what does this imply about Bill Miller? He beat the S&P 15 years in a row.? But as posts like this point out, did he go from first to worst?

His neglect of the core idea in value investing, margin of safety, allowed him to do well as the lending bubble expanded, and low quality companies prospered.? But when the tide went out, he was found to be swimming naked.? Far from following Buffett’s principles, or Graham’s, he was just a growth investor masquerading as value investor because “he bought them cheap.”? And they got a lot cheaper, and he had to sell them cheaper still.

So what are the lessons here?

  • Focus on margin of safety in investing.? Analyze balance sheets.
  • Avoid investing in popular funds, even excellent managers make mistakes when lots of money is coming in.
  • Stick to your knitting.? Don’t engage in all manner of fancy logic once you achieve success.? Stay humble.
  • Remember that your timing in investing makes a difference.? Don’t be quick to add to a winning fund.? Better to find a fund with good ideas that is temporarily underperforming.
  • Buy-and-hold often beats the average investor over the long haul.? Some traders might do better, but have you developed that skill?
  • Avoid managers that say a lot of clever things, but can’t deliver on returns.

So be wise, and realize, you are still responsible for your investment success or failure, even if you hand it off to others.

The Best of the Aleph Blog, Part 36

The Best of the Aleph Blog, Part 36


Photo Credit: Renaud Camus

====================

In my view, these were my best posts written between November 2015 and January?2016:

Don?t be a Miser in Retirement (Or Ever)

It is possible to over-save, and underspend.? You should leave some inheritance for your heirs, but don’t deprive yourself of the benefits that having some assets provides.

On Lump Sum Distributions

In general it is better to take payments over time than to receive it as a lump sum.? If you do have a lump sum that comes to you, take care not to spend it too rapidly.

On Currencies that are Not a Store of Value

How would you live if you were trapped in Venezuela, Turkey, Zimbabwe, or some other badly run country with high inflation.? Here are a few bits of advice.

Understand Your Liabilities

How do you figure out how much expenses you need to fund, and as a result, how much you have to grow your assets to fund those expenses.

Ten Questions and Answers on ETFs and Other Topics

This was from a survey of bloggers on basic questions to answer for young people.

Ten Investing Books to Consider

Good books on value investing, markets, and risk.

We Eat Dollar Weighted Returns ? VII

Truly gruesome.? What’s the difference between what a buy-and-hold investor earned on Ken Heebner’s main fund versus what the average investor earned on the fund?? Really, it’s astounding.

The Limits of Risky Asset Diversification

Over time, all classes of risky assets tend to become correlated with each other.? This is because investors naively diversify their risky assets across these classes, and then engage in panic selling behavior with all of these classes as a group.

How Much is that Asset in the Window? (III)

What is the value of a fund that you can’t get money out of?

Direction Matters More Than Position with Monetary Policy

As the yield curve steepens, more investment opportunities become uneconomic.? Don’t say that monetary policy is accommodative when you are tightening.

Sell a Fraction of Your Home?

There are always new freaky ideas in finance that will likely not become common.? This is one of them.

Annotated ?In Hoc Anno Domini?

Response to ?In Hoc Anno Domini?

At Christmas, the Wall Street Journal republishes a vacuous opinion piece by Vermont Royster that is little better than liberation theology for conservatives.? He twists Scripture out its contexts to make it mean what is never meant.? Bogus beyond measure.

The Best of the Aleph Blog, Part 34

The Best of the Aleph Blog, Part 34

Photo Credit: Renaud Camus

=========================

In my view, these were my best posts written between May 2015 and July 2015:

Learning from the Past, Part 5b [Institutional Stock Version]

Learning from the Past, Part 5c [Institutional Stock Version]

How I did a bad job for Hovde on Scottish Re and National Atlantic Holdings.? Also, what I did to mitigate the errors.? (And I am supposed to be really good with insurance companies…)

The SEC Pursues a Fool?s Errand

On why the Consolidated Audit Trial [CAT] is a bad idea.? Preventing “flash crashes” is not a desirable goal; they teach people not to use market orders, and to be careful.? The market is a place for big guys, not little guys.

On Partnership Investing

What do you have to be careful about if you are entering into a partnership?

On Risk-Based Liquidity and Systemic Risk

On how the Federal Government is making a mess of post-crisis policy.? The best policies would be:

  • Regulate banks, money market funds and other depositary financials tightly.
  • Don?t let them invest in one another.
  • Make sure that they have more than enough liquid assets to meet any conceivable liquidity withdrawal scenario.
  • Regulate repurchase markets tightly.
  • Raise the amount of money that has to be deposited for margin agreements, until those are no longer a threat.
  • Perhaps break up banks by ending interstate branching. ?State regulation is good regulation.

Advice to a Friend on a Concentrated Private Stock Position from His Employer

How to analyze a large position in your employer’s stock.? Lots of potential for gain and loss because of the lack of diversification in one stock.

There?s a Reason for Risk Premiums

Some academic literature implicitly treats risk premiums as “free money” if you hold it long enough.? But there’s the problem: can you hold it long enough?? Also, sometimes the extra returns are so small that they are not worth the risk.

On Bond Market Illiquidity (and more)

On Bond Market Illiquidity (and more) Redux

Some things aren’t meant to be highly liquid, and it is foolish to worry about the lack lack of liquidity.? The second article covered some good questions that I got asked, including bonds that are predominantly “bought and held,” and the limitations on investment banks to hold inventory post-crisis.

Yes, Build the Buffer

More reasons why you should keep a supply of cash on hand.

Coping With Zero

In this period, I couldn’t find any new stocks to buy.? What should I do?

Stocks or Bonds?

What do you recommend when stocks and bonds are likely to return the same amount over the next ten years?? I leaned toward the bonds, which so far has been the wrong call.

The Phases of an Investment Idea

Sixteen Implications of ?The Phases of an Investment Idea?

How to analyze the cycles that investment ideas go through.? People think about it linearly, which helps lead to the booms and busts.? The second article gives 16 practical applications of the idea to illustrate the general theory.

Avoid Indexed Life Insurance Products

Why indexed insurance products give subpar returns with reduced volatility, assuming the insurer stays solvent.

Asset-Liability Mismatches and Bubbles

In this article, I argue that China has been indirectly encouraging its banks to run huge risks by financing illiquid assets with liquid liabilities.? Again, the risk hasn’t materialized yet.

How To End Index Gaming

?…in this short post I would like to point out two ways to stop the gaming.

  1. Define your index to include all securities in the class (say, all US-based stocks with over $10 million in market cap), or
  2. Control your index so that additions and deletions are done at your leisure, and not in any predictable way.

Gundlach vs Morningstar

I discussed the unwillingness of Doubleline to cooperate with Morningstar to analyze certain Doubleline funds, and why it was reasonable in some ways for Doubleline to refuse, and Morningstar to not give favorable ratings.? That said, I concluded that Morningstar should apologize to Doubleline.? This article earned me polite calls from both sides, and one request to take the article down voluntarily.? I politely refused.

What is Liquidity? (Part VIII)

The occasional series that never ends.? Ten things that affect the liquidity of an asset, and explaining the Treasury “flash crash.”

It?s Difficult to Make Predictions, Especially About the Future

It is a fatal attraction, but if you are going to write about investing, you will have to make some predictions about markets.? Just try to keep them from being too outlandish.

We Eat Dollar Weighted Returns ? VI

In which I analyze the Hussman Strategic Growth fund and the large negative difference between time-weighted and dollar-weighted returns.

Stock Valuations: Micro and Macro

Can valuation measures applied to individual companies be used to value the market as a whole?? Under what conditions, or, is there a better way?

The School of Money, First Grade

This was the first of what was going to be sixteen articles.? I was thinking of turning it into a book.? Things have been too busy for that.? This article is about figuring out what you want to do in life.

Pick a Valid Strategy, Stick With It

Many amateur investors give up on a strategy just as it is about to start succeeding, and choose a strategy that has performed well, only to watch it underperform.

Bid Out Your Personal Insurance Policies!

I give you at least five reasons why you should bid out your personal insurance policies every three years or so.? Underwriting rules and premiums change, and some companies take advantage of loyalty.

Twenty Enduring Posts

Twenty Enduring Posts

Photo Credit: Kat N.L.M.

This morning, I looked at the fall in the Chinese stock market, and I said to myself, “It’s been a long journey since the last crash.” After that, I wrote a brief piece at RealMoney, and another at what was then the new Aleph Blog, which was republished and promoted at Seeking Alpha, and got featured at a few news outlets. ?It gave my blog an early jolt of prominence. I was surprised at all of the early attention. That said, it encouraged me to keep going, and eventually led me away from RealMoney, and into my present work of managing money for upper middle class individuals and small institutions.

I try to write material that will last, even though this is only blogging. ?Looking at the piece on the last China crash made me think… what pieces of the past (pre-2015) still get readers? ?So, I stumbled across a way to answer that at wordpress.com, and thought that the array of articles still getting readers was interesting. ?The tail is very long on my blog, with 2725 articles so far, with an average word length of around 800. ?Anyway, have a look at the top 20 articles written before 2015 that are still getting read now:

20.?Got Cash?

Though I write about personal finance, it’s not my strongest suit. ?Nonetheless, when I?wanted to write some articles about personal finance for average people, I realized I needed to limit myself mostly to cash management. ?A few of the articles in the new series “The School of Money,” should be good in that regard.

19.?Book Review: Best Practices for Equity Research Analysts

I write a lot of book reviews. ?I have some coming up. ?I was surprised that on this specialized got so many hits after four years.

18.?On the Structure of Berkshire Hathaway, Part 2, the Harney Investment Trust

This is a controversial piece on the most secretive aspects of what Buffett does in investing. ?I have tried to get people from the media to pick up this story, but no one wants to touch it. ?I think I am one of the few admirers of Buffett willing to be critical… but so what? ?Hasn’t worked on this story.

17.?Learning from the Past, Part 1

This short series goes through my worst investing mistakes. ?It’s almost finished. ?I have one or two more articles to write on the topic. ?This one covers my early days, where I made a lot of rookie errors.

16.?On Trading Illiquid Stocks

I describe some of my trading techniques that I use to fight back against the high frequency traders.

15.?De Minimus Laws

Here I do a post aiding all of my competitors, giving the relevant references to the de minimus laws for registered investment advisers in all 50 states, plus DC and Puerto Rico. ?Note that I got my home state of Maryland wrong, and I corrected it later.

14.?The Good ETF, Part 2 (sort of)

Reprises an article of mine explaining what makes for exchange-traded products that are good for investors.

13.?On Bond Risks in the Short-Run

A piece giving advice on institutional bond management. ?Kinda surprised this one still gets read…

12.?Should Jim Cramer Sell TheStreet or Quit CNBC?

Cramer generates controversy, and thus pageviews as well. ?As an aside, TheStreet.com is down another 20% since I wrote that. ?Still, the piece had my insights from brief discussions that I had with Cramer, way back when.

11.?An Internship at a Hedge Fund

Basic advice to a young man starting a new job at a hedge fund.

10.?Q&A with Guy Spier of Aquamarine Capital

I have always enjoyed the times where I have had the opportunity to interact with the authors of the books that I have gotten to review. ?Guy Spier was a particularly interesting and nice guy to interact with.

9.?The Good ETF

This is the predecessor piece to the one rated #14 on this list. ?Brief, but gets the points across on what the best exchange traded products are like. ?It was written in 2009.

8.?We Eat Dollar Weighted Returns ? III

I’ve been banging this drum for some time, and the last one in this series was quite popular also. ?This article highlighted how much average investors lose relative to buy-and-hold investors in the?S&P 500 Spider [SPY]. ?Really kinda sad, underperforming by ~7%/year.

7.?Portfolio Rule Seven

Now, why does my rebalancing trade rule get more play than any of my other rules? ?I don’t know.

6.?The US is not Japan, but there are some Similarities

I had forgotten that I had written this one in 2011. ?Why does it still get hits? ?In it I argue that the US will get out of its difficulties more easily than Japan. ?(Maybe this gets read in Japan?)

5.?Actuaries Versus Quants

My contention is that Actuaries are underrated relative to Quantitative Analysts, and have a lot to offer the financial markets, should the Actuaries ever get their act together.

4.?Can the ?Permanent Portfolio? Work Today?

Does it still make sense to split your portfolio into equal proportions of stocks, long Treasuries, T-bills, and gold?! ?Maybe.

3.?The Venn Diagram Method for Greatest Common Factors and Least Common Multiples

I was shocked at this one, written in 2008. ?This post explains a math concept in simple visual terms for teachers to explain?greatest common factors and least common multiples.

And now for the last three:

2.?On Berkshire Hathaway and Asbestos

1.?On the Structure of Berkshire Hathaway

0.?Understanding Insurance Float?(oops, miscounted when I started… so much for being good at math 😉 )

Should it be any surprise that the last three, the most popular, are on Buffett, Berkshire Hathaway and Insurance? ?People go nuts over Buffett!

The one novel thing I bring to table here is my understanding of the insurance aspects of BRK. ?Each of the three deal with that topic in a detailed way. ?Aleph Blog is pretty unique on that topic; who else has written in detail about the insurance company-driven holding company structure? ?Aside from that,?many don’t get how critical BRK is to covering asbestos claims, and don’t get the economics of insurance float. ?Many think float is magic, when it can lead to an amplification of losses, as well as an intensification of gains.

These last three pieces got really popular in March, around the time that BRK released its 2015 earnings, even though they were one year old.

Anyway, I hope you found this interesting… I was surprised at what gets read after time goes by. ?One final note: for every time the most popular pre-2015 article was read, articles that would have been rated #22 and beyond got read 10 times… and thus the long tail. ?It’s nice to write for the long term. 🙂

Full disclosure: long BRK/B for myself and clients

Theme: Overlay by Kaira