There’s a lot of bits and bytes spilled in the war between Elliott Associates (and those that favor their position) and the current board of Arconic. ?I want to point out a few things, having held Alcoa since prior to the breakup, and added to my positions in both new Alcoa and Arconic post-breakup.
Profitability will likely improve more if Elliott’s nominees are elected to the board, and Larry Lawson is CEO.
The existing management team does not deserve credit for the recent rise in the stock price for two reasons: a decent amount of the rise in Arconic’s stock price anticipates a rising probability that the board and management team will be replaced. ?Second, a decent amount of the increase in the stock price of Alcoa has been due to a rise in the price of aluminum, for which no single entity?can take credit. ?Current Arconic benefited from that, at least until it sold its whole stake in Alcoa.
To their discredit, the existing management team and board resisted the breakup of the company into upstream and downstream for years. ?(See point 2 of this Elliott letter,?Was Dr. Kleinfeld the Driving Force Behind the Separation?)
Existing management was not a good capital allocator.
Prior to the agitation by Elliott, Alcoa and Arconic sold at low valuations, because earnings prospects were poor. ?Now new Alcoa is in better hands, and that might be true for Arconic in the future, which may further improve valuation.
The existing board has low ownership in Arconic. ?Many of the existing board members have been around too long.
The current board are late to the party of improving corporate governance. ?Though their proposals are good, it looks like they were dragged there by the activists, and therefore, can’t be trusted to maintain these improvements.
That’s my short summary; it is not meant to be detailed, as Elliott’s arguments are. ?In general, I agree with the arguments over at New Arconic, and will be voting the blue proxy card. ?If you disagree, then you should vote the white proxy card sent out by the existing board.
I’m not telling you what to do. ?Vote the proxy that reflects your view of what will improve Arconic the most.
Full disclosure: long AA & ARNC for my clients and me (Note: Aleph Investments, LLC, is?dust on the scales in this fight, representing less than 0.01% of outstanding shares.)
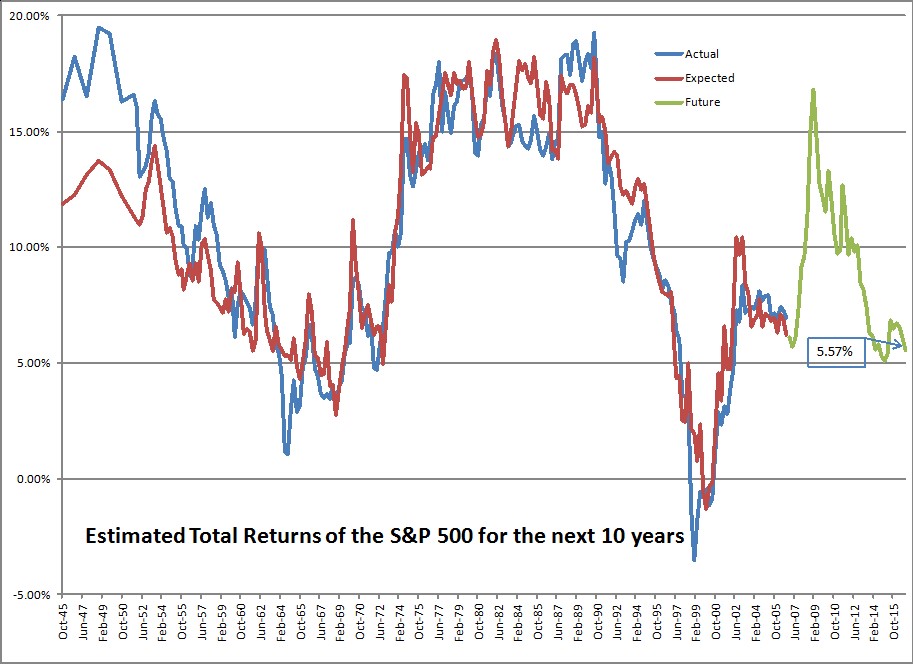
Are you ready to earn 6%/year until 9/30/2026? ?The data from the Federal Reserve comes out with some delay. ?If I had it instantly at the close of the third quarter, I would have said 6.37% ? but with the run-up in prices since then, the returns decline to 6.01%/year.
So now I say:
Are you ready to earn 5%/year until 12/31/2026? ?The data from the Federal Reserve comes out with some delay. ?If I had it instantly at the close of the fourth?quarter, I would have said 5.57% ? but with the run-up in prices since then, the returns decline to 5.02%/year.
A one percent drop is pretty significant. ?It stems from one main factor, though — investors are allocating a larger percentage of their total net worth to stocks. ?The amount in stocks moved from 38.00% to 38.75%, and is probably higher now. ?Remember that these figures come out with a 10-week delay.
Remember that the measure in question covers both public and private equities, and is market value to the extent that it can be, and “fair value” where it can’t. ?Bonds and most other assets tend to be a little easier to estimate.
So what does it mean for the ratio to move up from 38.00% to 38.75%? ?Well, it can mean that equities have appreciated, which they have. ?But corporations buy back stock, pay dividends, get acquired for cash which reduces the amount of stock outstanding, and places more cash in the hands of investors. ?More cash in the hands of investors means more buying power, and that gets used by many long-term institutional investors who have fixed mandates to follow. ?Gotta buy more if you hit the low end of your equity allocation.
And the opposite is true if new money gets put into businesses, whether through private equity, Public IPOs, etc. ?One of the reasons this ratio went so high in 1998-2001 was the high rate of business formation. ?People placed more money at risk as they thought they could strike it rich in the Dot-Com bubble. ?The same was true of the Go-Go era in the late 1960s.
Remember here, that average returns are around 9.5%/year historically. ?To be at 5.02% places us in the 88th percentile of valuations. ?Also note that I will hedge what I can if expected 10-year returns get down to 3%/year, which corresponds to a ratio of 42.4% in stocks, and the 95th percentile of valuations. ?(Note, all figures in this piece are nominal, not inflation-adjusted.) ?At that level, past 10-year returns in the equity markets have been less than 1%, and in the short-to-intermediate run, quite poor.)
You can also note that short-term and 10-year Treasury yields have risen, lowering the valuation advantage versus cash and bonds.
The investors? positioning suggests burgeoning optimism, with TD Ameritrade clients increasing their net exposure to stocks in February, buying bank shares and popular stocks such as Amazon.com Inc. and sending the retail brokerage?s Investor Movement Index to a fresh high in data going back to 2010. The index tracks investors? exposure to stocks and bonds to gauge their sentiment.
?People went toe in the water, knee in the water and now many are probably above the waist for the first time,? said JJ Kinahan, chief market strategist at TD Ameritrade.
This is sad to say, but it is rare for a rally to end before the “dumb money” shows up in size. ?Running a small asset management shop like I do, at times like this I suggest to clients that they might want more bonds (with me that’s short and high quality now), but few do that. ?Asset allocation is the choice of my clients, not me. ?That said, most of my clients are long-term investors like me, for which I give them kudos.
Then there is this piece over at Bloomberg.com called:?Wall Street’s Buzz Over ‘Great Leader’ Trump Gives Shiller Dot-Com Deja Vu. ?I want to see the next data point in this analysis, which won’t be available by mid-June, but I do think a lot of the rally can be chalked up to willingness to take more risk.
I do think that most people and corporations think that they will have a more profitable time under Trump rather than Obama. ?That said, a lot of the advantage gets erased by a higher cost of debt capital, which is partly driven by the Fed, and partly by a potentially humongous deficit. ?As I have said before though, politicians are typically limited in what they can do. ?(And the few unlimited ones are typically destructive.)
Shiller’s position is driven at least partly by the weak CAPE model, and the rest by his interpretation of current events. ?I don’t make much out of policy uncertainty indices, which are too new. ?The VIX is low, but hey, it usually is when the market is near new highs. ?Bull markets run on complacency. ?Bear markets plunge on revealed credit risk threatening economic weakness.
One place I will agree with Shiller:
What Shiller will say now is that he?s refrained from adding to his own U.S. stock positions, emphasizing overseas markets instead.
That is what I am doing. ?Where I part ways with Shiller for now is that I am not pressing the panic button. ?Valuations are high, but not so high that I want to hedge or sell.
That’s all for now. ?This series of posts generates more questions than most, so feel free to ask away in the comments section, or send me an email. ?I will try to answer the best questions.
=========================
Late edit: changed bolded statement above from third to fourth quarter.
It was shortly after the election when I last moved my trading band. ?Well, time to move it again, this time up 4%, with a small twist. ?I’m at my cash limit of 20%, with a few more stocks knocking on the door of a rebalancing sale, and none near a rebalancing buy. ?(To decode this, you can read my article on portfolio rule seven.) ?Here is portfolio rule seven:
Rebalance the portfolio whenever a stock gets more than 20% away from its target weight. Run a largely equal-weighted portfolio because it is genuinely difficult to tell what idea is the best. Keep about 30-40 names for diversification purposes.
This is my interim trading rule, which helps me make a little additional money for clients by buying relatively low and selling relatively high. ?It also reduces risk, because higher prices are riskier than lower prices, all other things equal.
There are two companies that are double-weights in my portfolio, one half-weight, and 32 single-weights. ?The half-weight is a micro-cap that is difficult to buy or sell. (Patience, patience…) ?With cash near 20%, a?single-weight currently runs around 2.2% of assets, with buying happening near 1.75%, and selling near 2.63%.
But, I said there was a small twist. ?I’m going to add another single-weight position. ?I don’t know what yet. ?Also, I’m leaving enough in reserve to turn one of the single-weights into a double-weight. ?That company is a well-run Mexican firm that has ?had a falling stock price even though it is still performing well. ?If it falls another 10%, I will do more than rebalance. ?I will rebalance and double it.
Part of the reason for the move in both number of positions and position size at the same time is that both the half-weight and one single-weight that is at the top of its band are being acquired for cash, and so they (3.5% of assets) behave more like cash than stocks.
Thus, amid a portfolio that has been performing well, I am adjusting my positioning so that if the market continues to do well, the portfolio doesn’t lag much, or even continues to outperform. ?I’m not out to make big macro bets; I will make a small bet that the market is high, and carry above average cash, but it will all get deployed if the market falls 25%+ from here.
I keep the excess cash around for the same reason Buffett does. ?It gives you more easy options in a bad market environment. ?Until that environment comes, you’ll never know how valuable is is to keep some extra cash around. ?Better safe, than sorry.
Comments are always appreciated from readers, if they are polite. ?Here’s a recent one from the piece?Distrust Forecasts.
You made one statement that I don?t really understand. ?Most forecasters only think about income statements. Most of the limits stem from balance sheets proving insufficient, or cash flows inverting, and staying that way for a while.?
What is the danger of balance sheets proving insufficient? Does that mean that the company doesn?t have enough cash to cover their ?burn rate??
Not having enough cash to cover the burn rate can be an example of this. ?Let me back up a bit, and speak generally before focusing.
Whether economists, quantitative analysts, chartists or guys who pull numbers out of the air, most people do not consider balance sheets when making predictions. ?(Counterexample: analysts at the ratings agencies.) ?It is much easier to assume a world where there are no limits to borrowing. ?Practical example #1 would be home owners and buyers during the last financial crisis, together with the banks, shadow banks, and government sponsored enterprises that financed them.
In economies that have significant private debts, growth is limited, because of higher default probabilities/severity, and less capability of borrowing more should defaults tarry. ?Most firms don?t like issuing equity, except as a last resort, so restricted ability to borrow limits growth. High debt among consumers limits growth in another way ? they have less borrowing capacity and many feel less comfortable borrowing anyway.
Figuring out when there is “too much debt” is a squishy concept at any level — household, company, government, economy, etc. ?It’s not as if you get to a magic number and things go haywire. ?People have a hard time dealing with the idea that as leverage rises, so does the probability of default and the severity of default should it happen. ?You can get to really high amounts of leverage and things still hold together for a while — there may be extenuating circumstances allowing it to work longer — just as in other cases, a failure in one area triggers a lot more failures as lenders stop lending, and those with inadequate liquidity can refinance and then fail.
Three?More Reasons to Distrust Predictions
1) Media Effects — the media does not get the best people on the tube — they get those that are the most entertaining. ?This encourages extreme predictions. ?The same applies to people who make predictions in books — those that make extreme predictions sell more books. ?As an example, consider this post from Ben Carlson on Harry Dent. ?Harry Dent hasn’t been right in a long time, but it doesn’t stop him from making more extreme predictions.
2) Momentum Effects — this one is two-sided. ?There are?momentum effects in the market, so it’s not bogus to shade near term estimates based off of what has happened recently. ?There are two problems though — the longer and more severe the rise or fall, the more you should start downplaying momentum, and increasingly think mean-reversion. ?Don’t argue for a high returning year when valuations are stretched, and vice-versa for large market falls when valuations are compressed.
The second thing is kind of a media effect when you begin seeing articles like “Everyone Ought to be Rich,” etc. ?”Dow 36,000″-type predictions come near the end of bull markets, just as “The Death of Equities’ comes at the end of Bear Markets. ?The media always shows up late; retail shows up late; the nuttiest books show up late. ?Occasionally it will fell like books and pundits are playing “Can you top this?” near the end of a cycle.
3) Spurious Math — Whether it is the geometry of charts or the statistical optimization of regression, it is easy to argue for trends persisting longer than they should. ?We should always try to think beyond the math to the human processes that the math is describing. ?What levels of valuation or indebtedness are implied? ?Setting new records in either is always possible, but it is not the most likely occurrence.
Here’s the quick summary of what I will say: People and companies need liquidity. ?Anything where payments need to be made needs liquidity. ?Secondary markets will develop their own liquidity if it is needed.
Recently, I was at an annual meeting of a private company that I own shares in. ?Toward the end of the meeting, one fellow who was kind of new to the firm asked?what liquidity the shares had and how people valued them. ?The board and management of the company wisely said little. ?I gave a brief extemporaneous talk that said that most people who owned these shares know they are illiquid, and as such, they hold onto them, and enjoy the distributions. ?I digressed a little and explained how one *might* put a value on the shares, but trading values really depended on who was more motivated — the buyer or the seller.
Now, there’s no need for that company to have a liquid market in its stock. ?In general, if someone wants to sell, someone will buy — trades are very infrequent, say a handful per year. ?But the holders know that, and most plan not to sell the shares, looking to other sources if they need money to spend — liquidity.
And in one sense, the shares generate their own flow of liquidity. ?The distributions come quite regularly. ?Which would you rather have? ?A bucket of golden eggs, or the goose that lays them one at a time?
Now the company itself doesn’t need liquidity. ?It generates its liquidity internally through profitable operations that don’t require much in the way of reinvestment in order to maintain its productive capacity.
Now, Buffett used to?purchase only companies that were like this, because he wanted to reallocate the excess liquidity that the companies threw off to new investments. ?But as time has gone along, he has purchased capital-intensive businesses like BNSF that require continued capital investment. ?Quoting from a good post at Alpha Architect?referencing Buffett’s recent annual meeting:
Question: ?In your 1987 Letter to Shareholders, you commented on the kind of companies Berkshire would like to buy: those that required only small amounts of capital. You said, quote, ?Because so little capital is required to run these businesses, they can grow while concurrently making all their earnings available for deployment in new opportunities.? Today the company has changed its strategy. It now invests in companies that need tons of capital expenditures, are over-regulated, and earn lower returns on equity capital. Why did this happen?
Warren Buffett?It?s one of the problems of prosperity. The ideal business is one that takes no capital, but yet grows, and there are a few businesses like that. And we own some?We?d love to find one that we can buy for $10 or $20 or $30 billion that was not capital intensive, and we may, but it?s harder. And that does hurt us, in terms of compounding earnings growth. Because obviously if you have a business that grows, and gives you a lot of money every year?[that] isn?t required in its growth, you get a double-barreled effect from the earnings growth that occurs internally without the use of capital and then you get the capital it produces to go and buy other businesses?[our] increasing capital [base] acts as an anchor on returns in many ways. And one of the ways is that it drives us into, just in terms of availability?into businesses that are much more capital intensive.
Emphasis that of Alpha Architect
Liquidity is meant to support the spending of corporations and people who need services and products to further their existence. ?As such, intelligent entities plan for liquidity needs in advance. ?A pension plan in decline allocates more to bonds so that the cash flow from the bonds will fund expected net payouts. ?Well-run insurance companies and banks match expected cash flows at least for a few years.
Buffer funds are typically low-yielding assets of high quality and short duration — short maturity bonds, CDs, savings and bank deposits, etc. ?Ordinary people and corporations need them to manage the economic bumps of life. ?Expenses are up, and current income doesn’t exceed them. ?Got cash? ?It certainly helps to be able to draw on excess assets in a pinch. ?Those who run a balance on their credit cards pay handsomely for the convenience.
In a crisis, who needs liquidity most? ?Usually, it’s whoever is at the center of the crisis, but usually, those entities are too far gone to be helped. ?More often, the helpable needy are the lenders to those at the center of the crisis, and woe betide us if no one will privately lend to them. ?In that case, the financial system itself is in crisis, and then people end up lending to whoever is the lender of last resort. ?In the last crisis, Treasury bonds rallied as a safe haven.
In that sense, liquidity is a ‘fraidy cat. ?Marginal borrowers can’t get it when they need it most. ?Liquidity typically flows to quality in a crisis. ?Buffett bailed out only the highest quality companies in the last crisis. Not knowing how bad it would be, he was happy to hit singles, rather than risk it on home runs.
Who needs liquidity most now? ?Hard to say. ?At present in the US, liquidity is plentiful, and almost any?person or firm can get a loan or equity finance if they want it. ?Companies happily extend their balance sheets, buying back stock, paying dividends, and occasionally investing. ?Often when liquidity is flush, the marginal bidder is a speculative entity. ?As an example, perhaps some emerging market countries, companies and people would like additional offers of liquidity.
That’s a major difference between bull and bear markets — the quality of those that can easily get unsecured loans. ?To me that is the leading reason why we are in the seventh or eighth inning of a bull market now, because almost any entity can get the loans they want at attractive levels. ?Why isn’t it the ninth inning? ?We’re not at “nuts” levels yet. ?We may never get there though, which is why baseball analogies are sometimes lame. ?Some event can disrupt the market when it is so high, and suddenly people and firms are no longer so willing to extend credit.
Ending the article here — be aware. ?The time to take inventory of your assets and their financing needs is before the markets have an event. ?I’ve just completed my review of my portfolio. ?I sold two of the 35 companies that I hold and replaced them with more solid entities that still have good prospects. ?I will sell two more in the new year for tax reasons. ?My bond portfolio is high quality. ?My clients and I are ready if liquidity gets worse.
?In the short run, the market is a voting machine but in the long run, it is a weighing machine.?
Not that I will ever surpass the elegance of Ben Graham, but I think there are aspects of my saying that work better. ?Ben Graham lived in a time where capital was mostly physical, and he invested that way. ?He found undervalued net assets and bought them, sometimes fighting to realize value, and sometimes waiting to realize value, while all of the while enjoying the arts as a bon vivant. ?In one sense, Graham kept the peas and carrots of life on separate sides of the plate. ?There is the tangible (a cheap set of assets, easily measured), and the intangible — artistic expression, whether in painting, music, acting, etc. (where values are not only relative, but contradictory — except perhaps for Keynes’ beauty contest).
Voting and weighing are discrete actions. ?Neither has a lot of complexity on one level, though deciding who to vote for can have its challenges. (That said, that may be true in the US for 10% of the electorate. ?Most of us act like we are party hacks. 😉 )
What drives asset?prices? ?New information? ?Often, but new information is only part of it. It stems from changes in expectations. ?Expectations change when:
Earnings get announced (or pre-announced)
Economic data gets released.
Important people like the President, Cabinet members, Fed governors, etc., give speeches.
Acts of God occur — earthquakes, hurricanes, wars, terrorist attacks, etc.
A pundit releases a report, whether that person is a short, a long-only manager, hedge fund manager, financial journalist, sell-side analyst, etc. ?(I’ve even budged the market occasionally on some illiquid stocks…)
Asset prices move and some people mimic to intensify the move because they feel they are missing out.
Holdings reports get released.
New scientific discoveries are announced
Mergers or acquisitions or new issues are announced.
The solvency of a firm is questioned, or a firm of questionable solvency has an event.
And more… nowadays even a “tweet” can move the market
In the short run, it doesn’t matter whether the news is true. ?What matters is that people believe it enough to act on it. ?Their expectation change. ?Now, that may not be enough to create a permanent move in the price — kind of like people buying stocks that Cramer says he likes on TV, and the Street shorts those stocks from the inflated levels. ?(Street 1, Retail 0)
But if the news seems to have permanent validity, the price will adjust to a higher or lower level. ?It will then take new data to move the price of the asset, and the dance of information and prices goes on and on. ?Asset prices are always in an unstable equilibrium that takes account of the many views of what the world will be like over various time horizons. ?They are more volatile than most theories would predict because people are not rational in the sense that economists posit — they do not think as much as imitate and extrapolate.
Read the news, whether on paper or the web — “XXX is dead,” “YYY is the future.” ?Horrible overstatements most of the time — sure, certain products or industries may shrink or grow due to changes in technology or preferences, but with a few exceptions, a new temporary unstable equilibrium is reached which is larger or smaller than before. ?(How many times has radio died?)
“Stocks rallied because the Fed cut interest rates.”
“Stocks rallied because the Fed tightened interest rates, showing a strong economy.”
“Stocks rallied just because this market wants to go up.”
“Stocks rallied and I can’t tell you why even though you are interviewing me live.”
Okay, the last one is fake — we have to give reasons after the fact of a market move, even anthropomorphizing the market, or we would feel uncomfortable.
We like our answers big and definite. ?Often, those big, definite answers that seem right at 5PM will look ridiculous in hindsight — especially when considering what was said near turning points. ?The tremendous growth that everyone expected to last forever is a farce. ?The world did not end; every firm did not go bankrupt.
So, expectations matter a lot, and changes in expectations matter even more in the short-run, but who can lift up their head and look into the distance and say, “This is crazy.” ?Even more, who can do that precisely at the turning points?
No one.
There are few if any people who can both look at the short-term information and the long-term information and use them both well. ?Value investors are almost always early. ?If they do it neglecting the margin of safety, they may not survive to make it to the long-run, where they would have been right. ?Shorts predicting the end often develop a mindset that keeps them from seeing that things have stopped getting worse, and they stubbornly die in their bearishness. ?Vice-versa, for bullish Pollyannas.
Financially, only two things matter — cash flows, the cost of financing cash flows, and how they change with time. ?Amid the noise and news, we often forget that there are businesses going on, quietly meeting human needs in exchange for a profit. ?The businessmen are frequently more rational than the markets, and attentive to the underlying business processes producing products and services that people value.
As with most things I write about, the basic ideas are easy, but they work out in hard ways. ?We may not live long enough to see what was true or false in our market judgments. ?There comes a time for everyone to hang up their spurs if they don’t die in the saddle. ?Some of the most notable businessmen and market savants, who in their time were indispensable people, will eventually leave the playing field, leaving others to play the game, while they go to the grave. ?Keynes, the great value investor that he was, said, “In the long run we are all dead.” ?The truth remains — omnipresent and elusive, inscrutable and unchangeable like a giant cube of gold in a baseball infield.
As it was, Ben Graham left the game, but never left the theory of value investing. ?Changes in expectations drive prices, and unless you are clever enough to divine the future, perhaps the best you can do is search for places where those expectations are too low, and tuck some of those assets away for a better day. ?That better day may be slow in coming, but diversification and the margin of safety embedded in those assets there will help compensate for the lack of clairvoyance.
My last post on this generated some good questions. ?I’m going to answer them here, because this model deserves a better explanation. ?Before I start, I should say that in order to understand the model, you need to read the first two articles in the series, which are?here:
If you are curious about the model, the information is there. ?It includes links to the main article at Economic Philosopher’s blog ( @jesselivermore on Twitter).
On to the questions:
Is this nominal or real return? Where can I find your original blog post explaining how you calculate future returns? Similar charts using Shiller PE, total market cap to gdp, q-ratio etc. all seem to imply much lower future returns.
This is a nominal return. ?In my opinion, returns and inflation should be forecast separately, because they have little to do with each other. ?Real interest rates?have a large impact on equity prices, inflation has a small impact that varies by sector.
This model also forecasts returns for the next ten years. ?If I had it do forecasts over shorter horizons, the forecasts would be lower, and less precise. ?The lower precision comes from the greater ease of forecasting an average than a single year. ?It would be lower because?the model has successively less power in forecasting each successive year — and that should make sense, as the further you get away from the current data, the less impact the data have. ?Once you get past year ten, other factors dominate?that this model does not account for — factors reflecting the long-term productivity of capital.
I can’t fully explain why this model is giving higher return levels, but I can tell you how the models are different:
This model focuses in investor behavior — how much are investors investing in stocks versus everything else. ?It doesn’t explicitly consider valuation.
The Shiller PE isn’t a well-thought-out model for many reasons. ?16 years ago I wrote an email to Ken Fisher where I listed a dozen flaws, some small and some large. ?That e-mail is lost, sadly. ?That said, let me be as fair as I can be — it attempts to compare the S&P 500 to trailing 10-year average earnings. ?SInce using a single year would be unsteady, the averaging is a way to compare a outdated smoothed income statement figure to the value of the index. ?Think of it as price-to-smoothed-earnings.
Market Cap to GDP does a sort of mismatch, and makes the assumption that public firms are representative of all firms. ?It also assumes that total payments to all factors are what matter for equities, rather than profits only. ?Think of it as a mismatched price-to-sales ratio.
Q-ratio compares the market value of equities and debt to the book value of the same. ?The original idea was to compare to replacement value, but book value is what is available. ?The question is whether it would be cheaper to buy or build the corporations. ?If it is cheaper to build, stocks are overvalued. ?Vice-versa if they are cheaper to buy. ?The grand challenge here is that book value may not represent replacement cost, and increasingly so because intellectual capital is an increasing part of the value of firms, and that is mostly not on the balance sheet. ?Think of a glorified Economic Value to Book Capital ratio.
What are the return drivers for your model? Do you assume mean reversion in (a) multiples and (b) margins?
Again, this model does not explicitly consider valuations or profitability. ?It is based off of the subjective judgments of people allocating their portfolios to equities or anything else. ?Of course, when the underlying ratio is high, it implies that people are attributing high valuations to equities relative to other assets, and vice-versa. ?But the estimate is implicit.
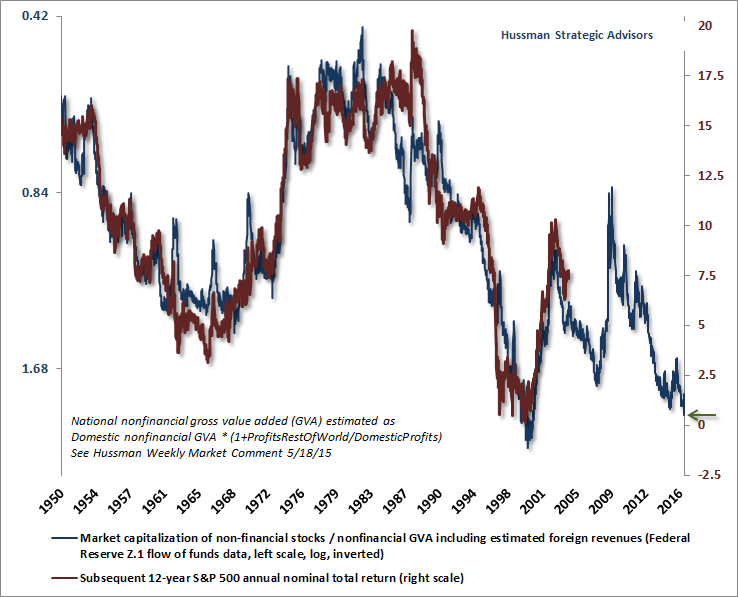
So?I?m wondering what the difference is between your algorithm for future returns and John Hussman?s algorithm for future returns. For history, up to the 10 year ago point, the two graphs look quite similar. However, for recent years within the 10-year span, the diverge quite substantially in absolute terms (although the shape of the ?curves? look quite similar). It appears that John?s algorithm takes into account the rise in the market during the 2005-2008 timeframe, and yours does not (as you stated, all else remaining the same, the higher the market is at any given point, the lower the expected future returns that can be for an economy). That results in shifting your expected future returns up by around 5% per year compared to his! That leads to remarkably different conclusions for the future.
Perhaps you have another blog post explaining your prediction algorithm that I have not seen. John has explained (and defended) his algorithm extensively. In absence of some explanation of the differences, I think that John?s is more credible at this point. See virtually any of his weekly posts for his chart, but the most recent should be at http://www.hussmanfunds.com/wmc/wmc161212e.png?(DJM: the article in question is here.)
I’d love to meet and talk with John Hussman. ?I have met some members of his small staff, and he lives about six miles from my house. ?(PS — Even more, I would like to meet @jesselivermore). ?The Baltimore CFA Society asked him to come speak to us a number of times, but we have been turned down.
Now, I’m not fully cognizant of everything he has written on the topic, but the particular method he is using now was first published on 5/18/2015. ?There is an article critiquing aspects of Dr. Hussman’s methods from Economic Philosopher. ?You can read EP for yourself, but I gain one significant thing from reading this — this isn’t Hussman’s first model on the topic. ?This means the current model has benefit of hindsight bias as he acted to modify the model to correct inadequacies. ?We sometimes call it a specification search. ?Try out a number of models and adjust until you get one that fits well. ?This doesn’t mean his model is wrong, but that the odds of it forecasting well in the future are lower because each model adjustment effectively relies on less data as the model gets “tuned” to eliminate past inaccuracies. ?Dr. Hussman has good reasons to adjust his models, because they have generally been too bearish, at least recently.
I don’t have much problem with his underlying theory, which looks like a modified version of Price-to-sales. ?It should be more comparable to the market cap to GDP model.
This model, to the best of my knowledge, has not been tweaked. ?It is still running on its first pass through the data. ?As such, I would give it more credibility.
There is another reason I would give it more credibility. ?You don’t have the same sort of tomfoolery going on now as was present during the dot-com bubble. ?There are some speculative enterprises today, yes, but they don’t make up as much of the total market capitalization.
All that said, this model does not tell you that the market can’t fall in 2017. ?It certainly could. ?But what it does tell you versus valuations in 1999-2000 is that if we do get a bear market, it likely wouldn’t be as severe, and would likely come back faster. ?This is not unique to this model, though. ?This is true for all of the models mentioned in this article.
Stock returns are probabilistic and mean-reverting (in a healthy economy with no war on your home soil, etc.). ?The returns for any given year are difficult to predict, and not tightly related to valuation, but the returns over a long period of time are easier to predict, and are affected by valuation more strongly. ?Why? ?The correction has to happen sometime, and the most likely year is next year when valuations are high, but the probability?of it happening in the 2017?are maybe 30-40%, not 80-100%.
If you’ve read me for a long time, you will know I almost always lean bearish. ?The objective is to become intelligent in the estimation of likely returns and odds. ?This model is just one of ones that I use, but I think it is the best one that I have. ?As such, if you look the model now, we should be Teddy Bears, not full-fledged Grizzlies.
That is my defense of the model for now. ?I am open to new data and interpretations, so once again feel free to leave comments.
[bctt tweet=”As such, if you look the model now, we should be Teddy Bears, not full-fledged Grizzly Bears.” username=”alephblog”]
Are you ready to earn 6%/year until 9/30/2026? ?The data from the Federal Reserve comes out with some delay. ?If I had it instantly at the close of the third quarter, I would have said 6.37% — but with the run-up in prices since then, the returns decline to 6.01%/year.
That puts us in the 82nd percentile of valuations, which isn’t low, but isn’t the nosebleed levels last seen in the dot-com era. ?There are many talking about how high valuations are, but investors have not responded in frenzy mode yet, where they overallocate stocks relative to bonds and other investments.
Think of it this way: as more people invest in equities, returns go up to those who owned previously, but go down for the new buyers. ?The businesses themselves throw off a certain rate of return evaluated at replacement cost, but when the price paid is far above replacement cost the return drops considerably even as the cash flows from the businesses do not change at all.
For me to get to a level where I would hedge my returns, we would be talking about?considerably higher levels where the market is discounting future returns of 3%/year — we don’t have that type of investor behavior yet.
One final note: sometimes I like to pick on the concept of Dow 36,000 because the authors didn’t get the concept of risk premia, or, margin of safety. ?They assumed the market could be priced to no margin of safety, and with high growth. ?That said, the model does offer a speculative prediction of Dow 36,000. ?It just happens to come around the year 2030.
Until next time, when we will actually have some estimates of post-election behavior… happy investing and remember margin of safety.
[bctt tweet=”Are you ready to earn 6%/year until 9/30/2026?” username=”alephblog”]
Photo Credit: Daniele Dalledonne || Ever been to a place where everything was a little past its prime, but showed that it was a beautiful place in its time?
One of the great draws in?reading investment writing is the lure of “hot tips.” ?Everyone wants an investment idea that they can put a lot of money into that will reward buyers (or shorts) with a quick and large score. ?Thus most publications try to lure you in with articles like these, whether they will work or not.
We live in an era where market players scour as much fresh data as possible to make money, because there is validity to the idea that only fresh, previously unknown information can produce excess returns. ?The grand majority of us will never receive that information for free, and can’t afford to pay up for services that promise to give such carefully researched ideas (whether true or not, and whether they work or not).
So what’s a humble value investor to do, professional or amateur? ?I can suggest five?things:
Take a look at old ideas that seemed promising but when the news hit the market, there was a price jump, then a fall, then nothing. ?Typically, I have lists of companies that I have looked at — maybe it is time for a second look?
Source your own ideas — particularly look at smaller companies that have low or no analyst coverage. ?As regulations have come over Wall Street, you might be surprised at the number of companies in seemingly boring industries that have little to no real coverage. ?Some of them are sizable. ?(By “real coverage” I mean a human being, not an algorithm. ?Don’t get me wrong, algorithms are often better than people, but the value of a human being ?here is that he/she is more representative of how human investors think — and we love exciting stories.)
Scan 13Fs for new positions and additions — my favorite ideas are when a number of clever investors are adding on net to their holdings (and the stock has done nothing), or two hedge funds buy a new name at the same time that none of the other bright investors hold at all. ?(not a spinoff)
Or, look at spinoffs. ?For a little while, there will be liquidity and small or no analyst coverage. ?Many large investors and indexers will toss out the smaller spinoff, often leaving a undervalued company behind.
Hold onto companies in your portfolio if they stumble, but you still think management is making the right decisions.
One of the main ideas behind this is that it takes a while for business ideas to work out. ?Most valid ideas will hit a couple of bumps along the way, and short-term earnings will disappoint occasionally with good companies. ?Companies that never have disappointing earnings may be manipulating their accounting.
Many if not most of the companies that I hold for years run into disappointments, become an unrealized capital loss in my portfolio for a while, and come back to greater success. ?The short-term disappointments sometimes allow me buy a little bit more, but the main thing to analyze is that the company’s management continues to behave rationally for the good of all shareholders.
Final Notes
This only applies to healthy companies. ?Do not try this with companies that have weak balance sheets that might be forced to try to raise funds (at unattractive levels) if their plans don’t go right. ?All good investing embeds a margin of safety.
Another way to phrase this is think differently. ?There is a lot of money out there chasing the most liquid companies. If you can take on a little illiquidity on a quality company that is not well-known, that could be a good idea. ?But remember, thinking differently is not enough if?your idea isn’t smart. ?It has to be smart and different.
With that, happy hunting. ?Sometime in the near term, I will do a post on underfollowed companies. ?Read it when it comes — it might have some good ideas.
[bctt tweet=”So what?s a humble value investor to do, professional or amateur? I can suggest five things” username=”alephblog”]
Most days, I don’t trade. ?I study.? I model. ?I muse. ?I plan.
There are some clever traders out there. ?I am not one of them. ?What little trading I do is done efficiently and effectively to get the best prices for assets that I want to buy and sell, but that’s not where most of the money is made in investing.
I can be like a chef who goes out to the market in the morning and buys the best ingredients available that day at great prices, except that my period of analysis is years, not a day. ?The point is that I consider the deals that the market is offering, and choose attractive ones that will benefit my clients and me for years to come. ?(I am still the largest investor that I manage money for — I eat the exact same meal that I serve to clients.)
What trading I do divides into two categories, which are designed for two different time horizons. ?The first time horizon is long — 3-10 years in length. ?Can I find companies with good or better business prospects trading at prices more attractive than the businesses that I currently own?
This is mostly a patient thing, unless I conclude that I got something materially wrong, in which case I try to be quick to sell. ?Patience is needed, because investing is like farming. ?It doesn’t grow overnight. ?It will take time for value to be built, and time for people to recognize that the company is better than they thought it was. ?It won’t be a linear process, either, unless something unusually good happens. ?There are setbacks with almost every?winning investment. ?Keep your eyes on the main drivers of growth in value, and whether management is using excess cash to the best?ends, which will vary by company.
At least half of my winners spent time as an unrealized capital loss at some point. ?My timing is sometimes nonideal, but ideal timing is not required for great results if the time horizon is years. ?So I watch?and monitor, and occasionally trade away the position when I find something with materially better prospects.
As an aside, not all RIA clients would like this, because it looks like I’m not doing that much. ?I sometimes wonder how much better money management would be if clients were happy with portfolios that don’t change much and don’t have many of the current hottest and most recognizable companies in them. ?Portfolios filled with?unknown companies in boring but profitable industries… difficult to talk about at parties, but often more profitable.
What I have mentioned above is 85% of what I do. ?The shorter-run movements of the market provide the other 15% as ideas and companies go in and out of favor in the short run. ?I mentioned that my timing is often not the best. ?This gives me an opportunity to do a little better.
20% is a significant move — it’s enough to justify the trading costs. ?If the company is still a good one, the fall in price gives me the opportunity to lower my average cost modestly. ?Note that this is a modest change — I’m not trying to be a hero or a home-run hitter. ?I learned better when I was younger that making timing decisions on that level is too undisciplined. ?It is far better to edge in and edge out around a core position — with a good company, a lower price means lower risk, and a higher price means higher risk, so this method is always taking and shedding risk at appropriate levels.
Edge in, edge out — trades like this happen a few times a month — more frequently when the market is lively, less often when it is sleepy. ?Hey, don’t force things. ?This is gradual reallocation of money from less to more attractive homes for capital. ?The time horizon here is 3-12 months, and offers the ability to make a little more off of core positions.
Over 5 years, companies that I own might have a grand total of 5-10 trades from edging in and out. ?It will always be a mix of both buys and sells — few companies don’t have moves of 20%+ down amid growth. ?(As some will note, if markets are efficient, why is there such a large gap between 52-week highs and lows for individual stocks? ?Really, markets aren’t efficient — they are just very hard to beat.)
Now, others will come up with different ways of managing multiple time horizons in investing, but this method offers a decent balance between the short- and long-terms, and does so in a businesslike, disciplined way. ?And so I edge in and edge out.
[bctt tweet=”This balances the short- and long-terms, and does so in a businesslike, disciplined way.” username=”alephblog”]


