Category: Value Investing

Bumped Against My Upper Cash Limit

Bumped Against My Upper Cash Limit

Photo Credit: Wayne Stadler || Most of us have limited vision, myself included

=-=-=-=-=-=-=-=-=-=-=-=-=-=-=-=-=-=-=-=-=-=-=-=

In the time I have been managing money for myself and others in my stock strategy, I set a limit on the amount of cash in the strategy. ?I don’t let it go below 0%, and I don’t let it go over 20%.

I have bumped against the lower limit six or so?times in the last sixteen years. ?I bumped against it around five times in 2002, and once in 2008-9. ?All occurred near the bottom of the stock market. ?In 2002, I raised cash by selling off the stocks that had gotten hurt the least, and concentrating in sound stocks that had taken more punishment. ?In September 2002, when things were at their worst, I scraped together what spare cash I had, and invested it. ?I don’t often do that.

In 2008-9 I behaved similarly, though my household cash situation was tighter. ?Along with other stocks I thought were bulletproof, but had gotten killed, I bought a double position of RGA near the bottom, and then held it until last week, when it finally broke $100.

But, I had never run into a situation yet where I bumped into the 20% cash limit until yesterday. ?Enough of my stocks ran up such that I have been selling small bits of a number of companies for risk control purposes. ?The cash started to build up, and I didn’t have anything that I deeply wanted to own, so it kept building. ?As the limit got closer, I had one stock that I liked that would serve as at least a temporary place to invest — Tesoro [TSO]. ?Seems cheap, reasonably financed, and refining spreads are relatively low right now. ?I bought a position in Tesoro yesterday.

I could have done other things. ?I could have moved the position sizes of my portfolio up, but I would have had to increase the position sizes a lot to have some stocks hit the lower edge of the trading band,?but that would have been more bullish than I feel now. ?As it is, refiners have been lagging — I can live with more exposure there to augment Valero, Marathon Petroleum and PBF.

I also could have doubled a position size of an existing holding, but I didn’t have anything that I was that?impressed with. ?It takes a lot to make me double a position size.

As it is, my actions are that of following the rules that discipline my investing, but acting in such a way that reflects my moderate bearishness over the intermediate term. ?In the short run, things can go higher; the current odds even favor that, though at the end the market plays for small possible gains versus a larger possible loss.

The credit cycle is getting long in the tooth; though many criticize the rating agencies, their research (not their ratings) can serve as a relatively neutral guidepost to investors. ?Corporate debt is high and increasing, and profits are flat to shrinking… not the best setup for longs. ?(Read John Lonski at Moody’s.)

I will close this piece by saying that I am looking over my existing holdings and analyzing them for need for financing over the next three years, and selling those that seem weak… though what I will replace them with is a mystery to me.

Bumping up against my upper cash limit is bearish… and that is what I am working through now.

Full disclosure: long VLO MPC PBF and TSO

Book Review: Wiped Out

Book Review: Wiped Out

Wiped Out

Before I start this evening, thanks to Dividend Growth Investor for telling me about this book.

This is an obscure little book published in 1966. ?The title is direct, simple, and descriptive. ?A more flowery title could have been, “Losing Money in the Stock Market as an Art Form.” ?Why? ?Because he made every mistake possible in an era that favored stock investment, and managed to lose a nice-sized lump sum that could have been a real support to his family. ?Instead, he tried to recoup it by anonymously publishing ?this short book which goes from tragedy to tragedy with just enough successes to keep him hooked.

Whom God Would Destroy

There is a saying, “”Whom the gods would destroy, they first make mad.” ?My modification of it is, “Whom God would destroy, he first makes proud.” ?In this book, the author knows little about investing, but wishing to make more money in the midst of a boom, he entrusts a sizable nest egg for a young middle-class family to a broker, and lo and behold, the broker makes money in a rising market with a series of short-term investments, with very few losses.

Rather than be grateful, the author got greedy. ?Spurred by success, he became somewhat compulsive, and began reading everything he could on investing. ?To brokers, he became “the impossible client,” (my words, not those of the book) because now he could never be satisfied. ?Instead of being happy with a long-run impossible goal of 15%/year (double your money every five years), he wanted to double his money every 2-3 years. (26-41%/year)

As such, he moved his money from the broker that later he admitted he should have been satisfied with, and sought out brokers that would try to hit home runs. ?The baseball analogy is useful here, because home run hitters tend to strike out a lot. ?The analogy breaks down?here: a home run hitter can be useful to a team even if he has a .250 average and strikes out three times for every home run. ?Baseball is mostly a game of team compounding, where usually a number of batters have to do well in order to score. ?Investment is a game of individual compounding, where strikeouts matter a great deal, because losses of capital are very difficult to make up. ?Three 25% losses followed by a 100% gain is a 15% loss.

In the process of trying to win big, he ended up losing more and more. ?He concentrated his holdings. ?He bought speculative stocks, and not “blue chips.” ?He borrowed money to buy more stock (used margin). ?He bought “story stocks” that did not possess a margin of safety, which would maybe deliver high gains ?if the story unfolded as illustrated. ?He did not do homework, but listened to “hot tips” and invested off them. ?He let his judgment be clouded by his slight relationships with corporate insiders at the end. ?HE TRIED TO MAKE BIG MONEY QUICKLY, AND CUT EVERY CORNER TO DO SO. ?His expectations were desperately unrealistic, and as a result, he lost it all.

As he lost more and more, he fell into the psychological trap of wanting to get back what he lost, and being willing to lose it all in order to do so. ?I.e., if he lost so much already, it was worth losing what was left if there was a chance to prove he wasn’t a fool from his “investing.” ?As such, he lost it all… but there are three good things to say about the author:

  1. He had the humility to write the book, baring it all, and he writes well.
  2. He didn’t leave himself in debt at the end, but that was good providence for him, because if he had waited one more day, the margin clerk would have sold him out at a decided loss, and he would have owed the brokerage money.
  3. In the end, he knew why he had gone wrong, and he tells his readers that they need to: a) invest in quality companies, b) diversify, and c) limit speculation to no more than 20% of the portfolio.

His advice could have been better, but at least he got the aforementioned ideas?right. ?Margin of safety is the key. ?Doing significant due diligence if you are going to buy individual stocks is required.

Quibbles

This book will not teach you what to do; it teaches what not to do. ?It is best as a type of macabre financial entertainment.

Also, though you can still buy used copies of the book, if enough of you try to buy the used books out there, the price will rise pretty quickly. ?If you can, borrow it from interlibrary loan. ?It is an interesting historical curiosity of a book, and a cautionary tale for those who are tempted to greed. ?As the author closes the book:

“Cupidity is seldom circumspect.”

And thus, much as the greedy need to hear this advice, it is unlikely they will listen. ?Greed is compulsive.

Summary / Who Would Benefit from this Book

A good book, subject to the above limitations. ?It is best for entertainment, because it will teach you what not to do, rather than what to do.

Borrow it through interlibrary loan. ?If you feel you have to buy it, you can buy it here:?WIPED OUT. How I Lost a Fortune in the Stock Market While the Averages Were Making New Highs.

Full disclosure:?I bought it with my own money for three bucks.

If you enter Amazon through my site, and you buy anything, including books, I get a small commission. This is my main source of blog revenue. I prefer this to a ?tip jar? because I want you to get something you want, rather than merely giving me a tip. Book reviews take time, particularly with the reading, which most book reviewers don?t do in full, and I typically do. (When I don?t, I mention that I scanned the book. Also, I never use the data that the PR flacks send out.)

Most people buying at Amazon do not enter via a referring website. Thus Amazon builds an extra 1-3% into the prices to all buyers to compensate for the commissions given to the minority that come through referring sites. Whether you buy at Amazon directly or enter via my site, your prices don?t change.

Estimating Future Stock Returns, March 2016 Update

Estimating Future Stock Returns, March 2016 Update

ecphilosopher data 2015 revision_21058_image001

You might remember my post?Estimating Future Stock Returns, and its follow-up piece. ?If not they are good reads, and you can get the data on one file here.

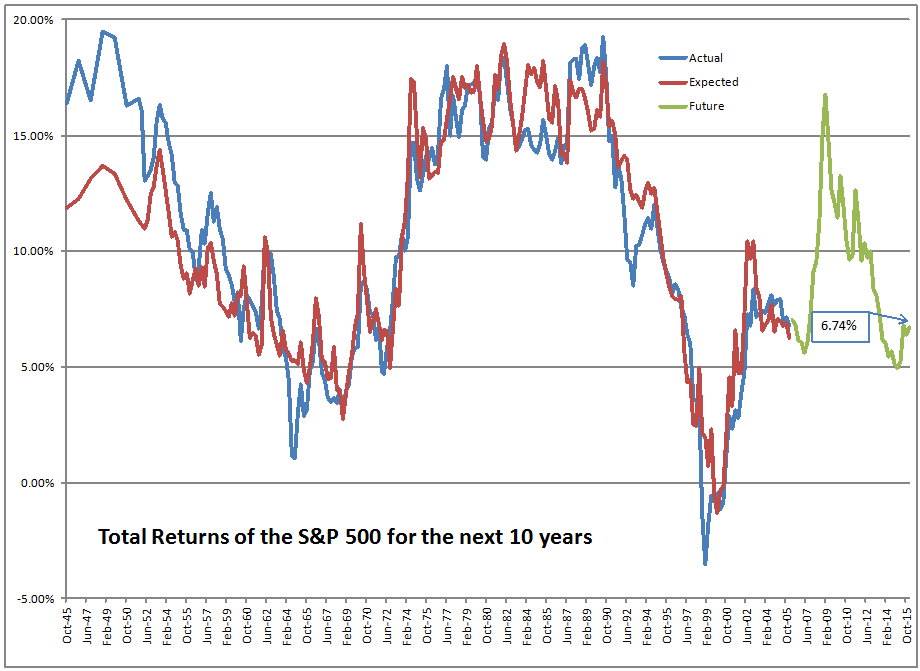
The Z.1 report came out yesterday, giving an important new data point to the analysis. ?After all, the most recent point gives the best read into current conditions. ?As of March 31st, 2016 the best estimate of 10-year returns on the S&P 500 is 6.74%/year.

The sharp-eyed reader will say, “Wait a minute! ?That’s higher than last time, and the market is higher also! ?What happened?!” ?Good question.

First, the market isn’t higher from 12/31/2015 to 3/31/2016 — it’s down about a percent, with dividends. ?But that would be enough to move the estimate on the return up maybe 0.10%. ?It moved up 0.64%, so where did the 0.54% come from?

The market climbs a wall of worry, and?the private sector has been holding less stock as a percentage of assets than before — the percentage?went from 37.6% to 37.1%, and the absolute amount fell by about $250 billion. ?Some stock gets eliminated by M&A for cash, some by buybacks, etc. ?The amount has been falling over?the last twelve months, while the amount in bonds, cash, and other assets keeps rising.

If you think that return on assets doesn’t vary that much over time, you would?conclude that having a smaller amount of stock owning the assets would lead to a higher rate of return on the stock. ?One year ago, the percentage the private sector held in stocks was 39.6%. ?A move down of 2.5% is pretty large, and moved the estimate for 10-year future returns from 4.98% to 6.74%.

Summary

As a result, I am a little less bearish. ?The valuations are above average, but they aren’t at levels that would lead to a severe crash. ?Take note, Palindrome.

Bear markets are always possible, but a big one is not likely here. ?Yes, this is the ordinarily bearish David Merkel writing. ?I’m not really a bull here, but I’m not changing my asset allocation which is 75% in risk assets.

Postscript for Nerds

One other thing affecting this calculation is the Federal Reserve revising estimates of assets other than stocks up prior to 1961. ?There are little adjustments in the last few years, but in percentage terms the adjustments prior to 1961 are huge, and drop the R-squared of the regression from 90% to 86%, which also is huge. ?I don’t know what the Fed’s statisticians are doing here, but I?am going to look into it, because it is?troubling to wonder if your data series is sound or not.

That said, the R-squared on this model is better than any alternative. ?Next time, if I get a chance, I will try to put a confidence interval on the estimate. ?Till then.

Saudi Arabia: Reading Tea Leaves

Saudi Arabia: Reading Tea Leaves

Photo Credit: Bahrain Ministry of Foreign Affairs

=-=-=-=-=-=-=-

Let me mention four?posts that I did recently on energy issues:

There were four?main ideas that came out of those articles:

  • Saudi Arabia would allow the price of crude oil to fall to hurt competitors/rivals, particularly Iran.
  • The price of crude oil would stay near $50/barrel.
  • Lots of overlevered companies dependent on a high price for crude oil would go bankrupt.
  • But?bankruptcy would happen to fewer, and more slowly, because of all the private equity wanting to buy distressed assets.

All that said, my view has changed a little recently. ?I could be wrong, but I think that the ceiling price for crude oil may be $70/barrel for a few years, with the average remaining at $50. ?I believe this because I think the Saudis are more desperate for cash than most believe.

Here’s my reasoning:

  • First, you have them selling off a?5%?interest in Saudi Aramco. ?When you need?money, there is a tendency to sell high quality easily saleable assets, because they will sell for a high price, and with little fuss. ?Admittedly, they aren’t rushing to do it, which weakens my point. ?My view is that you would sell off lesser things that aren’t core, rather than complicate life by selling off a portion of a top quality asset.
  • Second, they are seeking loans, and considering selling bonds.
  • Third, they are considering decreasing the subsidies that they give to their people. ?I think this will be very difficult to achieve politically.
  • Fourth, when the amount of Saudi holdings of US Treasury bonds was announced, it was lower than many expected, at $120+ billion, which only covers a little more than a year of their budget deficits, which was $98 billion last year.
  • Fifth, and most speculatively, I wonder if many of the US Treasury holdings have been pledged to cover other debts. ?No proof here, but it’s not uncommon to use highly liquid assets as collateral for privately contracted debts. ?That may explain the musing by some that there had to be more US Treasuries ?there… but where are they?

What this implies to me is that Saudi Arabia is now little different than most of their associates in OPEC. ?Their financial situation is tight enough that they must pump crude oil without respect?to the strategy of holding crude oil off the markets to get better prices. ?It’s not just punishing US shale oil production and Iranian crude production — the Saudis need the money.

If the Saudis need the money, and must pump, then OPEC lacks any significant coalition to raise prices. ?Prices will rise with growth in demand, and cheap resource depletion… but as for right now, there are enough barrels to come out of the ground below $70.

The Saudi need for money is a much simpler explanation than trying to knock out US shale oil, or gouge the Iranians, because it has the Saudis acting directly in their own interests, and it fits the price series for crude oil better.

PS — One more note: this is mildly bearish for the US Dollar as the US does not have the same dedicated buyer of US Dollar assets as it once did. ?I say mildly bearish, because most of the damage is already past.

The Dead Model

The Dead Model

How Lucky Do You Feel?

-=-=-=-=-=-=-

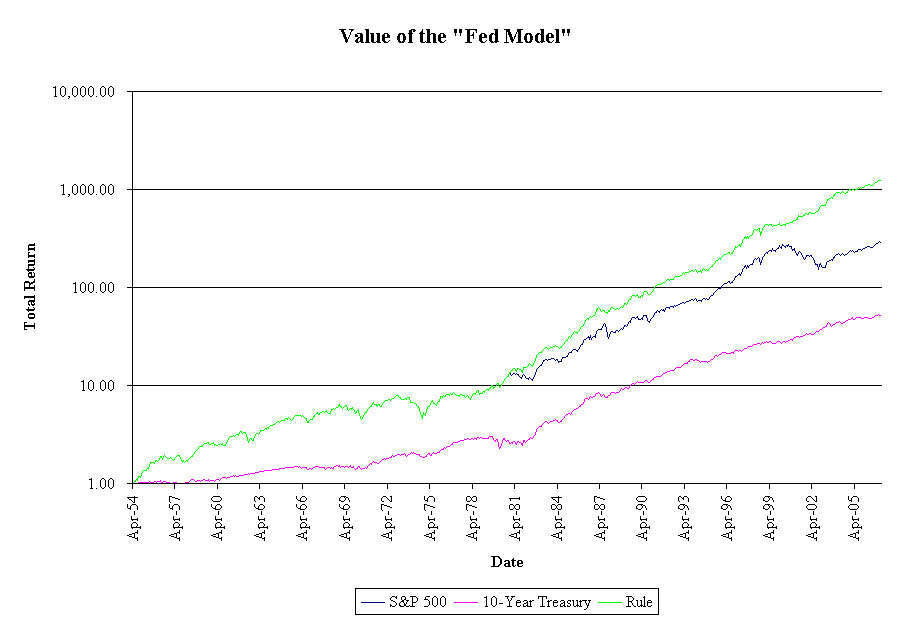
Nine years ago, I wrote about the so-called “Fed Model.” The insights there are still true, though the model has yielded no useful signals over that time. It would have told you to remain in stocks, which given the way many panic,, would not have been a bad decision.

I’m here to write about a related issue this evening. ?To a first approximation, most investment judgments are a comparison between two figures, whether most people want to admit it or not. ?Take the “Fed Model” as an example. ?You decide to invest in stocks or not based on the difference between Treasury yields and the earnings yield of stocks as a whole.

Now with interest rates so low, belief in the Fed Model?is tantamount to saying “there is no alternative to stocks.” [TINA] ?That should make everyone take a step back and say, “Wait. ?You mean that stocks can’t do badly when Treasury yields are low, even if it is due to deflationary conditions?” ?Well, if there were only two assets to choose from, a S&P 500 index fund and 10-year Treasuries, and that might be the case, especially if the government were borrowing on behalf of the corporations.

Here’s why: in my?prior piece on the Fed Model, I showed how the Fed Model was basically an implication of the Dividend Discount Model. ?With a few simplifying assumptions, the model collapses to the differences between the earnings yield of the corporation/index and its cost of capital.

Now that’s a basic idea that makes sense, particularly when consider how corporations work. ?If a corporation can issue cheap debt capital to?retire stock with a higher yield on earnings, in the short-run it is a plus for the stock. ?After all, if the markets have priced the debt so richly, the trade of expensive debt for cheap equity makes sense in foresight, even if a bad scenario comes along afterwards. ?If true for corporations, it should be true for the market as a whole.

The means the “Fed Model” is a good concept, but not as commonly practiced, using Treasuries — rather, the firm’s cost of capital is the tradeoff. ?My proxy for the cost of capital?for the market as a whole is the long-term Moody’s Baa bond index, for which we have about 100 years of yield data. ?It’s not perfect, but here are some reasons why it is a reasonable proxy:

  • Like equity, which is a long duration asset, these bonds in the index are noncallable with 25-30 years of maturity.
  • The Baa bonds are on the cusp of investment grade. ?The equity of the S&P 500 is not investment grade in the same sense as a bond, but its cash flows are very reliable on average. ?You could tranche?off a pseudo-debt interest in a way akin to the old Americus Trusts, and the cash flows would price out much like corporate debt or a preferred stock interest.
  • The debt ratings of most of the S&P 500 would be strong investment grade. ?Mixing in equity and extending to a bond of 25-30 years throws on enough yield that it is going to be comparable to the cost of capital, with perhaps a spread to compensate for the difference.

As such, I think a better comparison is the earnings yield on the S&P 500 vs the yield on the Moody’s BAA index if you’re going to do something like the Fed Model. ?That’s a better pair to compare against one another.

A new take on the Equity Premium
A new take on the Equity Premium!

=-=-=-=-=-=-

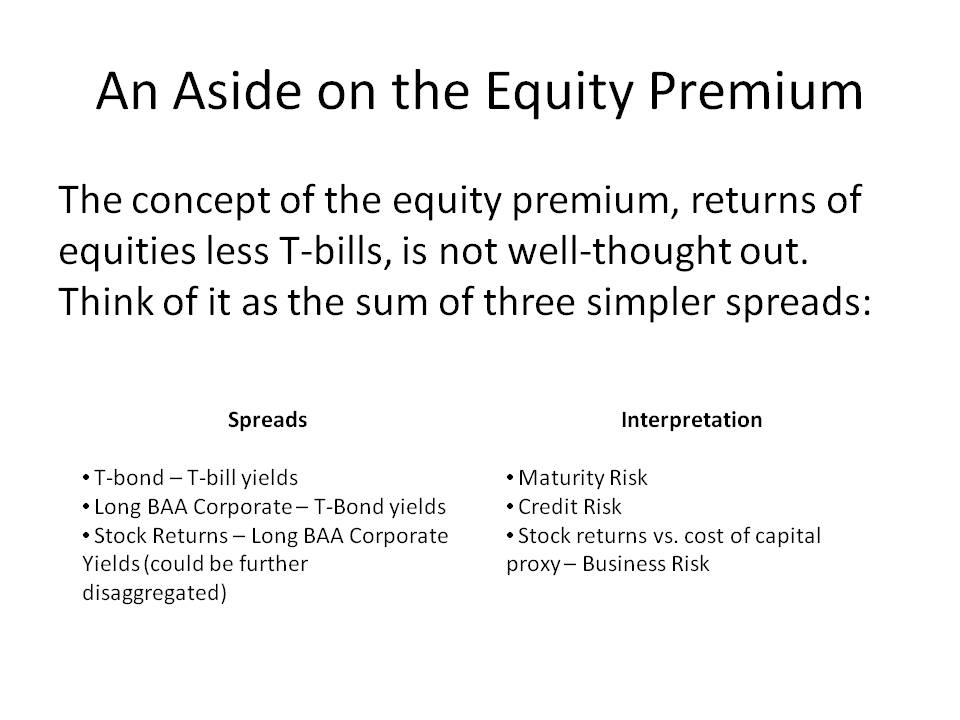
That brings up another bad binary comparison that is common — the equity premium. ?What do?stock returns?have to with the returns on T-bills? ?Directly, they have nothing to do with one another. ?Indirectly, as in the above slide from a recent presentation that I gave, the spread between the two of them can be broken into the sum of three spreads that are more commonly analyzed — those of maturity risk, credit risk and business risk. ?(And the last of those should be split into a economic earnings ?factor and a valuation change factor.)

This is why I’m not a fan of the concept of the equity premium. ?The concept relies on the idea that equities and T-bills?are a binary choice within the beta calculation, as if only the risky returns trade against one another. ?The returns of equities can be explained in a simpler non-binary way, one that a businessman or bond manager could appreciate. ?At certain points lending long is attractive, or taking credit risk, or raising capital to start a business. ?Together these form an explanation for equity returns more robust than the non-informative academic view of the equity premium, which mysteriously appears out of nowhere.

Summary

When looking at investment analyses, ask “What’s the comparison here?” ?By doing that, you will make more intelligent investment decisions. ?Even a simple purchase or sale of stock makes a statement about the relative desirability of cash versus the stock. ?(That’s why I prefer swap transactions.) ?People aren’t always good at knowing what they are comparing, so pay attention, and you may find that the comparison doesn’t make much sense, leading you to ask different questions as a result.


You Can Get Too Pessimistic

You Can Get Too Pessimistic

Photo Credit: Kathryn
Photo Credit: Kathryn || Truly, I sympathize. ?I try to be strong for others when internally I am broken.

Entire societies and nations have been wiped out in the past. ?Sometimes this has been in spite of the best efforts of leading citizens to avoid it, and sometimes it has been because of their efforts. ?In human terms, this is as bad as it gets on Earth. ?In virtually all of these cases, the optimal strategy was to run, and hope that wherever you ended up would be kind to foreigners. ?Also, most common methods of preserving value don’t work in the worst situations… flight capital stashed early in the place of refuge?and?gold might work, if you can get there.

There. ?That’s the worst survivable scenario I can think of. ?What does it take to get there?

  • Total government and?market breakdown, or
  • A lost war on your home soil, with the victors considerably less kind than the USA and its allies

The odds of these are very low in most of the developed world. ?In the developing world, most of the wealthy have “flight capital” stashed away in the USA or someplace equally reliable.

-=-=-=-=-=-=-=-=-=-=-=-=-=-=-=-=-=-=-=-=-=-=-=-=-=-=-=-=-=-=-=-==-=-=-=-=-=-

Most nations, societies and economies are more durable than most people would expect. ?There is a cynical reason for this: the wealthy and the powerful have a distinct interest in not letting things break. ?As Solomon observed a little less than 3000 years ago:

If you see the oppression of the poor, and the violent perversion of justice and righteousness in a province, do not marvel at the matter; for high official watches over high official, and higher officials are over them. Moreover the profit of the land is for all; even the king is served from the field. — Ecclesiastes 5:8-9 [NKJV]

In general, I think there is?no value in preparing for the “total disaster” scenario if you live in the developed world. ?No one wants to poison their own prosperity, and so the?rich and powerful?hold back from being too rapacious.

-=-=-=-=-=-=-=-=-=-=-=-=-=-=-=-=-=-=-=-=-=-=-=-=-=-=-=-=-=-=-=-==-=-=-=-=-=-

If you don’t have a copy, it would?be a good idea to get a copy of?Triumph of the Optimists. ?[TOTO] ?As I commented in my review of TOTO:

TOTO points out a number of things that should bias investors toward risk-bearing in the equity markets:

  1. Over the period 1900-2000, equities beat bonds, which beat cash in returns. (Note: time weighted returns. If the study had been done with dollar-weighted returns, the order would be the same, but the differences would not be so big.)

  2. This was true regardless of what presently developed nation you looked at. (Note: survivor bias? what of all the developing markets that looked bigger in 1900, like Russia and India, that amounted to little?)

  3. Relative importance of industries shifts, but the aggregate market tended to do well regardless. (Note: some industries are manias when they are new)

  4. Returns were higher globally in the last quarter of the 20th century.

  5. Downdrafts can be severe. Consider the US 1929-1932, UK 1973-74, Germany 1945-48, or Japan 1944-47. Amazing what losing a war on your home soil can do, or, even a severe recession.

  6. Real cash returns tend to be positive but small.

  7. Long bonds returned more than short bonds, but with a lot more risk. High grade corporate bonds returned more on average, but again, with some severe downdrafts.

  8. Purchasing power parity seems to work for currencies in the long run. (Note: estimates of forward interest rates work in the short run, but they are noisy.)

  9. International diversification may give risk reduction. During times of global stress, such as wartime, it may not diversify much. Global markets are more correlated now than before, reducing diversification benefits.

  10. Small caps may or may not outperform large caps on average.

  11. Value tends to beat growth over the long run.

  12. Higher dividends tend to beat lower dividends.

  13. Forward-looking equity risk premia are lower than most estimates stemming from historical results. (Note: I agree, and the low returns of the 2000s so far in the US are a partial demonstration of that. My estimates are a little lower, even?)

  14. Stocks will beat bonds over the long run, but in the short run, having some bonds makes sense.

  15. Returns in the latter part of the 20th century were artificially high.

Capitalist republics/democracies tend to be very resilient. ?This should make us willing to be long term bullish.

Now, many people look at their societies and shake their heads, wondering if things won’t keep getting worse. ?This typically falls into three?non-exclusive buckets:

  • The rich are getting richer, and the middle class is getting destroyed ?(toss in comments about robotics, immigrants, unfair trade, education problems with children, etc. ?Most such comments are bogus.)
  • The dependency class is getting larger and larger versus the productive elements of society. ?(Add in comments related to demographics… those comments are not bogus, but there is a deal that could be driven here. ?A painful deal…)
  • Looking at moral decay, and wondering at it.

You can add to the list. ?I don’t discount that there are challenges/troubles. ?Even modestly healthy society can deal with these without falling apart.

-=-=-=-=-=-=-=-=-=-=-=-=-=-=-=-=-=-=-=-=-=-=-=-=-=-=-=-=-=-=-=-==-=-=-=-=-=-

If you give into fears like these, you can become prey to a variety of investment “experts” who counsel radical strategies that will only succeed with very low probability. ?Examples:

  • Strategies that neglect investing in risk assets at all, or pursue shorting them. ?(Even with hedge funds you have to be careful, we passed the limits to arbitrage back in the late ’90s, and since then aggregate returns have been poor. ?A few niche hedge funds make sense, but they limit their size.)
  • Gold, odd commodities — trend following CTAs can sometimes make sense as a diversifier, but finding one with skill is tough.
  • Anything that smacks of being part of a “secret club.” ?There are no secrets in investing. ?THERE ARE NO SECRETS IN INVESTING!!! ?If you think that con men in investing is not a problem, read?On Avoiding Con Men. ?I spend lots of time trying to take apart investment pitches that are bogus, and yet I feel that I am barely scraping the surface.

-=-=-=-=-=-=-=-=-=-=-=-=-=-=-=-=-=-=-=-=-=-=-=-=-=-=-=-=-=-=-=-==-=-=-=-=-=-

Things are rarely as bad as they seem. ?Be willing to be a modest bull most of the time. ?I’m not saying don’t be cautious — of course be cautious! ?Just don’t let that keep you from taking some risk. ?Size your risks to your time horizon for needing cash back, and your ability to sleep at night. ?The biggest risk may not be taking no risk, but that might be the most common risk economically for those who have some assets.

To close, here is a personal comment that might help: I am natively a pessimist, and would easily give into disaster scenarios. ?I had to train myself to realize that even in the worst situations there was some reason for optimism. ?That served me well as I invested spare assets at the bottoms in 2002-3 and 2008-9. ?The sun will rise tomorrow, Lord helping us… so?diversify and take moderate risks most of time.

Goes Down Double-Speed (Update 3)

Goes Down Double-Speed (Update 3)

Photo Credit: Vincent Nguyen
S&P 500 at turning points
Data Credit: Ed Yardeni

This is the fourth article in this series, and is here because the S&P 500 is now in its second-longest bull market since 1928, having just passed the bull market that ended in 1956.? ? Yeah, who’da thunk it?

This post is a little different from the first three articles, because I got the data to extend the beginning of my study from 1950 to 1928, and I standardized my turning points using the standard bull and bear market definitions of a 20% rise or fall from the last turning point. ?You can see my basic data to the left of this paragraph.

Before I go on, I want to show you two graphs dealing with bear markets:

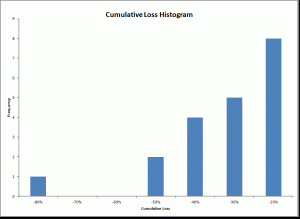
As you can see from the first graph, small bear markets are much more common than large ones. ?Really brutal bear markets like the biggest one in the Great Depression were so brutal that there is nothing to compare it to — financial leverage collapsed that had been encouraged by government policy, the Fed, and a speculative mania among greedy people.

The second graph tells the same story in a different way. ?Bear markets are often short and sharp. ?They don’t last long, but the intensity in term of the speed of declines is a little more than?twice as fast as the rises of bull markets. ?If it weren’t for the fact that bull markets last more than three times as long on average, the sharp drops in bear markets would be enough to keep everyone out of the stock market.

Instead, it just keeps many people out of the market, some entirely, but most to some degree that would benefit them.

Oh well, on to the gains:

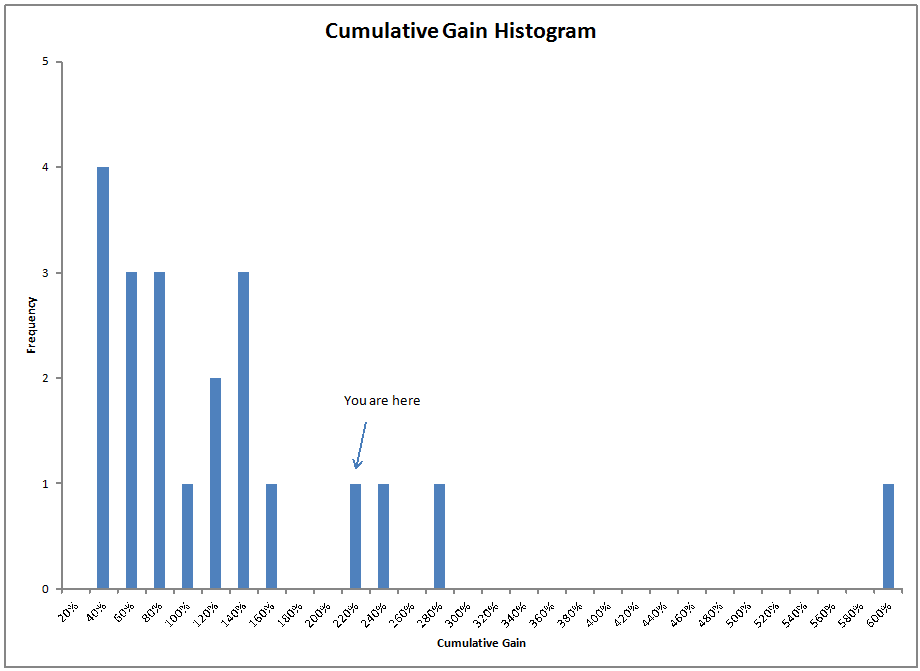
Like bear markets, most bull markets are small. ?The likelihood of a big bull market declines with size. ?The current bull market is the fourth largest, and the one that it passed in duration was the second largest. ?As an aside, each of the four largest bull markets came after a surprise:

  1. (1987-2000) 1987: We knew the prior bull market was bogus. ?When will inflation return? ?It has to, right?
  2. (1949-56) 1949: Hey, we’re not getting the inflation we expected, and virtually everyone is finding work post-WWII
  3. (1982-7) 1982: The economy is in horrible shape, and?interest rates are way too high. ?We will never recover.
  4. (2009-Present) 2009: The financial sector is in a shambles, government debt is out of control, and the central bank is panicking! ?Everything is falling apart.
Sometimes you win, sometimes you lose...
Sometimes you win, sometimes you lose…

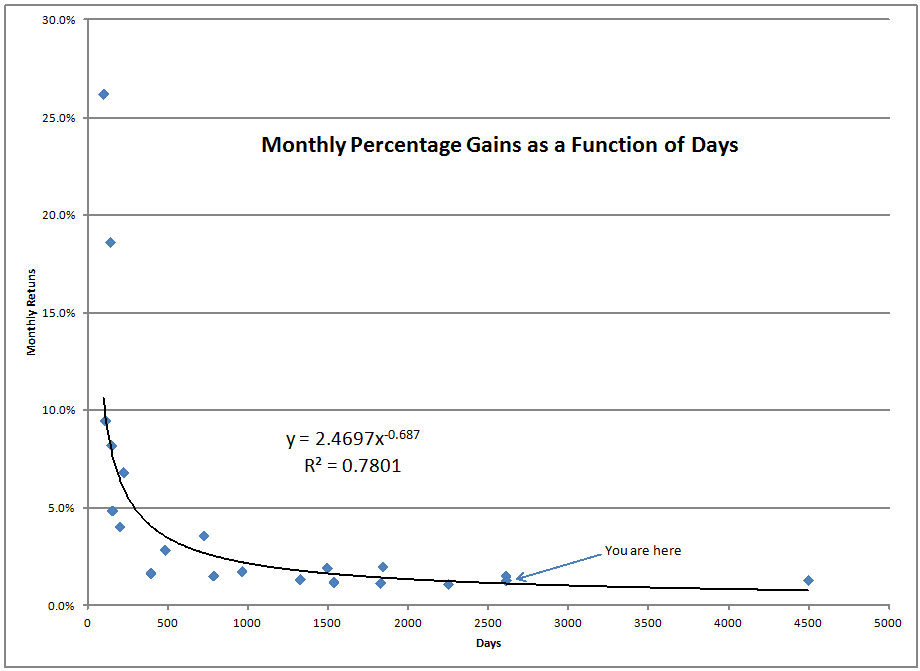
Note the two dots stuck on each other around 2800 days. ?The arrow points to the lower current bull market, versus the higher-returning bull market 1949-1956.

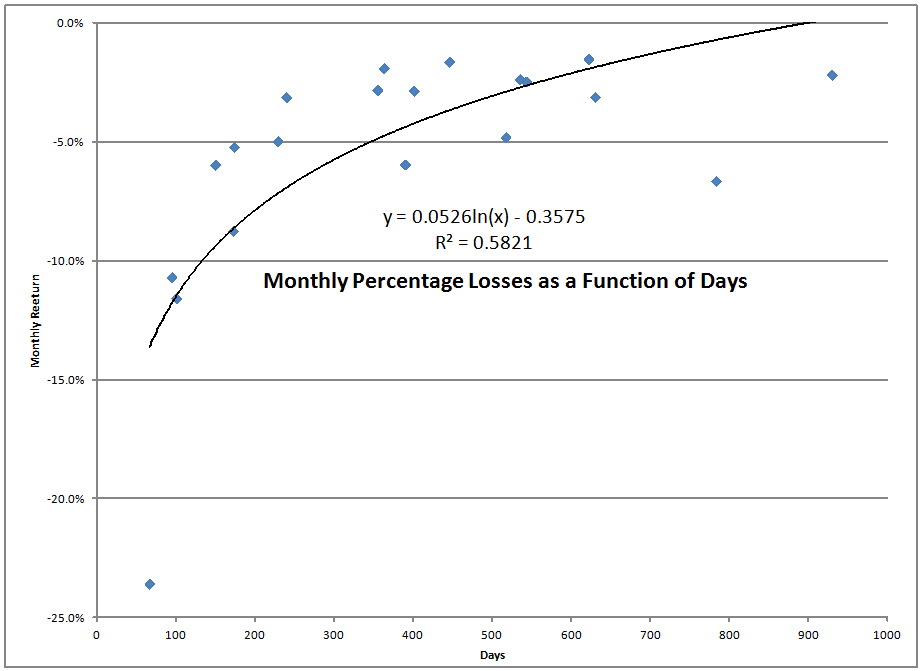
Like bear markets, bull markets also?can be short and sharp, but they can also be long and after the early sharp phase, meander upwards. ?If you look through the earlier articles in this series, you would see that this bull market started as an incredibly sharp phenomenon, and has become rather average in its intensity of monthly returns.

Conclusion

It may be difficult to swallow, but this bull market that is one of the longest since 1928 is pretty average in terms of its monthly average returns for a long bull market. ?It would be difficult for the cost of capital to go much lower from here. ?It would be a little easier for corporate profits to rise from here, but that also doesn’t seem too likely.

Does that mean the bull is doomed? ?Well, yes, eventually… but stranger things have happened, it could persist for some time longer if the right conditions come along.

But that’s not the way I would bet. ?Be careful, and take opportunities to lower your risk level in stocks somewhat.

PS — one difference with the Bloomberg article linked to in the first paragraph, the longest bull market did not begin in 1990 but in 1987. ?There was a correction in 1990 that fell just short of the -20% hurdle at -19.92%, as mentioned in this Barron’s article. ?The money shot:

The historical analogue that matches well with these conditions is 1990. There was a 19.9% drop in the S&P 500, lasting a bit under three months. But the damage to foreign stocks, small-caps, cyclicals, and value stocks in that cycle was considerably more. Both the Russell and the Nasdaq were down 32% to 33%. You might remember United Airlines? failed buyout bid; the transports were down 46%. Foreign stocks were down about 30%.

And then Saddam Hussein invaded Kuwait.

That might have been the final trigger. The broad market top was in the fall of 1989, and most stocks didn?t bottom until Oct. 11, 1990. In the record books, it was a shallow bear market that didn?t even officially meet the 20% definition. But it was a damaging one that created a lot of opportunity for the rest of the 1990s.

FWIW, I remember the fear that existed among many banks and insurance companies that had overlent on?commercial properties in that era. ?The fears led Alan Greenspan to encourage the FOMC to lower rates to… (drumroll) 3%!!! ?And, that experiment together with the one in 2003, which went down to 1.25%, practically led to the idea that the FOMC could lower rates to get out of any ditch… which is now being proven wrong.

Big Returns, Narrow Doors

Big Returns, Narrow Doors

Photo Credit: Leslie Archard

Every now and then, you will run across a mathematical analysis where if you use a certain screening, trading, or other investment method, it produces a high return in hindsight.

And now, you know about it, because it was just published.

But wait. ?Just published?

Think about what doesn’t get published: financial research that fails, whether for reasons of error or luck.

Now, luck can simply be a question of timing… think of my recent post:?Think Half of a Cycle Ahead. ?What would happen to value investing if you tested it only over the last ten years?

It would be in the dustbin of failed research.

Just published… well… odds are, particularly if the data only goes back a short distance in time, it means that there was likely a favorable macro backdrop giving the idea a tailwind.

There is a different aspect to luck though. ?Perhaps a few souls were experimenting with something like the theory before it was discovered. ?They had excellent returns, and there was a little spread of the theory?via word of mouth and unsavory means like social media and blogs.

Regardless, one of the main reasons the theory worked was that the asset being bought by those using the theory were underpriced. ?Lack of knowledge by institutions and most of the general public was a barrier to entry allowing for superior returns.

When the idea became known by institutions after the initial paper was published, a small flood of money came through the narrow doors, bidding up the asset prices to the point where the theory would not only no longer work, but the opposite of the theory would work for a time, as the overpriced assets had subpar?prospective returns.

Remember how dot-com stocks were inevitable in March of 2000? ?Now those doors weren’t narrow, but they were more narrow than the money that pursued them. ?Such is the end of any cycle, and the reason why average investors get skinned chasing performance.

Now occasionally the doors of a new theory are so narrow that institutions don’t pursue the strategy. ?Or, the strategy is so involved, that even average quants can tell that the data has been tortured to confess that it was born in a place where the universe randomly served up a royal straight flush, but that five-leaf clover got picked and served up as if it were growing everywhere.

Sigh.

My advice to you tonight is simple. ?Be skeptical of complex approaches that worked well in the past and are portrayed as new ideas for making money in the markets. ?These ideas quickly outgrow the carrying capacity of the markets, and choke on their own success.

The easiest way to kill a good strategy is to oversaturate it too much money.

As such, I have respect for those with proprietary knowledge that limit their fund size, and don’t try to make lots of money in the short run by hauling in assets just to drive fees. ?They create their own barriers to entry with their knowledge and self-restraint, and size their ambitions to the size of the narrow doors that they walk through.

To those that use institutional investors, do ask where they will cut off the fund size, and not create any other funds like it that buy the same assets. ?If they won’t give a firm answer, avoid them, or at minimum, keep your eye on the assets under management, and be willing to sell out when they get reeeally popular.

If it were easy, the returns wouldn’t be that great. ?Be willing to take the hard actions such that your managers do something different, and finds above average returns, but limits the size of what they do to serve current clients well.

Then pray that they never decide to hand your money back to you, and manage only for themselves. ?At that point, the narrow door excludes all but geniuses inside.

OPEC and Game Theory

OPEC and Game Theory

Photo Credit: Istvan || Note OPEC HQ in Vienna

Most games in life are cooperative. ?Many are competitive. ?A few are perverse.

That’s what the crude oil market is like today. ?It reminds me of the prisoner’s dilemma. ?In the prisoner’s dilemma, two parties that would benefit from cooperating together tend not to do so because of other incentives that if both follow, they will both end up in a worse place.

This stems from three?problems facing?OPEC [Organization of the Petroleum Exporting Countries].

  1. The Saudis and the Iranians don’t want to take any action that would benefit the other, even if it would help themselves.
  2. It’s virtually impossible to keep member nations in OPEC from cheating, and producing more than their quota.
  3. Thanks to hydraulic fracturing (at least for now) there is enough supply outside of OPEC at inexpensive prices, that if OPEC cut production as a group, it might not gain as much of the benefit as they did in the ’70s and early ’80s.

Factors 1 and 2 interact, because even if there was a credible deal to cut production on the table, the Saudis likely think that the Iranians might cheat and produce more… leaving the Iranians much better off and the Saudis not that much better off.

We have to remember that the neoclassical model of man as a maximizer of utility or profits is often wrong. ?People and nations are envious, and will make do with less if it means those that they dislike are even worse off. ?The Saudis may be burning through their financial reserves quickly, but virtually everyone else in OPEC is worse off. ?The Saudis might think that they can drive a better deal inside OPEC when almost everyone else is desperate.

What this argues for is crude oil prices staying lower for a longer period of time — my guess is between $30 and $50 per barrel of Brent-type crude. ?What could change this?

  • Faster economic growth
  • Turmoil in oil producing regions that reduces supply
  • Depletion of short-life low-cost sources of crude (as is common with hydraulic fracturing)
  • Some clever third parties in OPEC find a way to get the Saudis and Iranians to cooperate while saving face, and no one cheats.

On the other side there is:

  • More cheating within OPEC
  • Weaker growth
  • Higher energy taxes
  • Further technological refinements that lower crude oil production costs further
  • Continued improvements in solar,?wind, and energy storage (primarily battery) technology.

At present, my guess is that the marginal barrels of crude oil are being extracted in North America, and probably will be out to 2020 or so. ?As such, I would encourage energy investors to stick with strong companies with a mix of low debt and cheap production costs. ?Also, look for companies that are misunderstood, that have other businesses away from energy but have been tarred with the low energy price story.

In summary, play it safe while the members of OPEC flounder in a game that they designed for themselves.

Estimating Future Stock Returns, Follow-up

Estimating Future Stock Returns, Follow-up

Idea Credit: Philosophical Economics Blog

Idea Credit: Philosophical Economics Blog

My most recent post,?Estimating Future Stock Returns?was well-received. ?I expected as much. ?I presented it as part of a larger presentation to a session at the Society of Actuaries 2015 Investment Symposium, and a recent meeting of the Baltimore Chapter of the AAII. ?Both groups found it to be one of the interesting aspects of my presentation.

This post is meant to answer three reasonable questions that got posed:

  1. How do you estimate the model?
  2. How do we understand what it is forecasting given multiple forecast horizons seemingly implied by the model?
  3. Why didn’t the model how badly the market would do in 2001 and 2008? ?And I will add 1973-4 for good measure.

Ready? ?Let’s go!

How to Estimate

In his original piece, @Jesse_Livermore freely gave the data and equation out that he used. ?I will do that as well. ?About a year before I wrote this, I corresponded with him by email, asking if he had noticed that the Fed changed some of the data in the series that?his variable used retroactively. ?That was interesting, and a harbinger for what would follow. ?(Strange things happen when you rely on government data. ?They don’t care what others use it for.)

In 2015, the Fed discontinued one of the series that was used in the original calculation. ?I noticed that when the latest Z.1 report came out, and I tried to estimate it the old way. ?That threw me for a loop, and so I tried to re-estimate the relationship using what data was there. ?That led me to do the following:

I tried to get all of them from one source, and could not figure out how to do it. ?The Z.1 report has all four variables in it, but somehow, the Fed’s Data Download Program, which one of my friends at a small hedge fund charitably referred to as “finicky” did not have that series, and somehow FRED did. ?(I don’t get that, but then there are a lot of things that I don’t get. ?This is not one of those times when I say, “Actually, I do get it; I just don’t like it.” ?That said, like that great moral philosopher Lucy van Pelt, I haven’t ruled out stupidity yet. ?To which I add, including my stupidity.)

The variable is calculated like this:

(A + D)/(A + B + C + D)

Not too hard, huh? ?The R-squared is just a touch lower from estimating it the old way… but the difference is not statistically significant. ?The estimation is just a simple ordinary least squares regression using that single variable as the independent variable, and the dependent variable being the total return on the S&P 500.

As an aside, I tested the variable over other forecast horizons, and it worked best over 10-11 years. ?On individual years, the model is most powerful at predicting the next year (surprise!), and gets progressively weaker with each successive individual year.

To make it concrete: you can use this model to forecast the expected returns for 2016, 2017, 2018, etc. ?It won’t be very accurate, but you can do it. ?The model gets more accurate forecasting over a longer period of time, because the vagaries of individual years average out. ?After 10-11 years, the variable is useless, so if I were put in charge of setting stock market earnings assumptions for a pension plan, I would do it as a step function, 6% for the next 10 years, and 9.5% per year thereafter… or in place of 9.5% whatever your estimate is for what the market should return normally.

On Multiple Forecast Horizons

One reader commented:

I would like to make a small observation if I may. If the 16% per annum from Mar 2009 is correct we still have a 40%+ move to make over the next three years. 670 (SPX March 09) growing at 16% per year yields 2900 +/- in 2019. With the SPX at 2050 we have a way to go. If the 2019 prediction is correct, then the returns after 2019 are going to be abysmal.

The first answer would be that you have to net dividends out. ?In March of 2009, the S&P 500 had a dividend yield of around 4%, which quickly fell as the market rose and dividends fell for about one year. ?Taking the dividends into account, we only need to get to 2270 or so by the March?of 2019, works out to 3.1% per year. ?Then add back a dividend yield of about 2.2%, and you are at a more reasonable 5.3%/year.

That said, I would encourage you to keep your eye on the bouncing ball (and sing along with Mitch… does that date me…?). ?Always look at the new forecast. ?Old forecasts aren’t magic — they’re just the best estimate a single point in time. ?That estimate becomes obsolete as conditions change, and people adjust their portfolio holdings to hold proportionately more or less stocks. ?The seven year old forecast may get to its spot in three years, or it may not — no model is perfect, but this one does pretty well.

What of 2001 and 2008? ?(And 1973-4?)

Another reader wrote:

Interesting post and impressive fit for the 10 year expected returns. ?What I noticed in the last graph (total return) is, that the drawdowns from 2001 and 2008 were not forecasted at all. They look quite small on the log-scale and in the long run but cause lot of pain in the short run.

Markets have noise, particularly during bear markets. ?The market goes up like an escalator, and goes down like an elevator. ?What happens in the last year of a ten-year forecast is a more severe version of what the prior questioner asked about the 2009 forecast of 2019.

As such, you can’t expect miracles. ?The thing that is notable is how well this model did versus alternatives, and you need to look at the graph in this article to see it (which was at the top of the last piece). ?(The logarithmic graph is meant for a different purpose.)

Looking at 1973-4, 2001-2 and 2008-9, the model missed by 3-5%/year each time at the lows for the bear market. ?That is a big miss, but it’s a lot smaller than other models missed by, if starting 10 years earlier. ?That said, this model would have told you prior to each bear market that future rewards seemed low — at 5%, -2%, and 5% respectively for the ?next ten years.

Conclusion

No model is perfect. ?All models have limitations. ?That said, this one is pretty useful if you know what it is good for, and its limitations.

Theme: Overlay by Kaira