The Z.1 report came out yesterday, giving an important new data point to the analysis. ?After all, the most recent point gives the best read into current conditions. ?As of March 31st, 2016 the best estimate of 10-year returns on the S&P 500 is 6.74%/year.
The sharp-eyed reader will say, “Wait a minute! ?That’s higher than last time, and the market is higher also! ?What happened?!” ?Good question.
First, the market isn’t higher from 12/31/2015 to 3/31/2016 — it’s down about a percent, with dividends. ?But that would be enough to move the estimate on the return up maybe 0.10%. ?It moved up 0.64%, so where did the 0.54% come from?
The market climbs a wall of worry, and?the private sector has been holding less stock as a percentage of assets than before — the percentage?went from 37.6% to 37.1%, and the absolute amount fell by about $250 billion. ?Some stock gets eliminated by M&A for cash, some by buybacks, etc. ?The amount has been falling over?the last twelve months, while the amount in bonds, cash, and other assets keeps rising.
If you think that return on assets doesn’t vary that much over time, you would?conclude that having a smaller amount of stock owning the assets would lead to a higher rate of return on the stock. ?One year ago, the percentage the private sector held in stocks was 39.6%. ?A move down of 2.5% is pretty large, and moved the estimate for 10-year future returns from 4.98% to 6.74%.
Summary
As a result, I am a little less bearish. ?The valuations are above average, but they aren’t at levels that would lead to a severe crash. ?Take note, Palindrome.
Bear markets are always possible, but a big one is not likely here. ?Yes, this is the ordinarily bearish David Merkel writing. ?I’m not really a bull here, but I’m not changing my asset allocation which is 75% in risk assets.
Postscript for Nerds
One other thing affecting this calculation is the Federal Reserve revising estimates of assets other than stocks up prior to 1961. ?There are little adjustments in the last few years, but in percentage terms the adjustments prior to 1961 are huge, and drop the R-squared of the regression from 90% to 86%, which also is huge. ?I don’t know what the Fed’s statisticians are doing here, but I?am going to look into it, because it is?troubling to wonder if your data series is sound or not.
That said, the R-squared on this model is better than any alternative. ?Next time, if I get a chance, I will try to put a confidence interval on the estimate. ?Till then.
Every now and then, you will run across a mathematical analysis where if you use a certain screening, trading, or other investment method, it produces a high return in hindsight.
And now, you know about it, because it was just published.
Now, luck can simply be a question of timing… think of my recent post:?Think Half of a Cycle Ahead. ?What would happen to value investing if you tested it only over the last ten years?
It would be in the dustbin of failed research.
Just published… well… odds are, particularly if the data only goes back a short distance in time, it means that there was likely a favorable macro backdrop giving the idea a tailwind.
There is a different aspect to luck though. ?Perhaps a few souls were experimenting with something like the theory before it was discovered. ?They had excellent returns, and there was a little spread of the theory?via word of mouth and unsavory means like social media and blogs.
Regardless, one of the main reasons the theory worked was that the asset being bought by those using the theory were underpriced. ?Lack of knowledge by institutions and most of the general public was a barrier to entry allowing for superior returns.
When the idea became known by institutions after the initial paper was published, a small flood of money came through the narrow doors, bidding up the asset prices to the point where the theory would not only no longer work, but the opposite of the theory would work for a time, as the overpriced assets had subpar?prospective returns.
Remember how dot-com stocks were inevitable in March of 2000? ?Now those doors weren’t narrow, but they were more narrow than the money that pursued them. ?Such is the end of any cycle, and the reason why average investors get skinned chasing performance.
Now occasionally the doors of a new theory are so narrow that institutions don’t pursue the strategy. ?Or, the strategy is so involved, that even average quants can tell that the data has been tortured to confess that it was born in a place where the universe randomly served up a royal straight flush, but that five-leaf clover got picked and served up as if it were growing everywhere.
Sigh.
My advice to you tonight is simple. ?Be skeptical of complex approaches that worked well in the past and are portrayed as new ideas for making money in the markets. ?These ideas quickly outgrow the carrying capacity of the markets, and choke on their own success.
The easiest way to kill a good strategy is to oversaturate it too much money.
As such, I have respect for those with proprietary knowledge that limit their fund size, and don’t try to make lots of money in the short run by hauling in assets just to drive fees. ?They create their own barriers to entry with their knowledge and self-restraint, and size their ambitions to the size of the narrow doors that they walk through.
To those that use institutional investors, do ask where they will cut off the fund size, and not create any other funds like it that buy the same assets. ?If they won’t give a firm answer, avoid them, or at minimum, keep your eye on the assets under management, and be willing to sell out when they get reeeally popular.
If it were easy, the returns wouldn’t be that great. ?Be willing to take the hard actions such that your managers do something different, and finds above average returns, but limits the size of what they do to serve current clients well.
Then pray that they never decide to hand your money back to you, and manage only for themselves. ?At that point, the narrow door excludes all but geniuses inside.
My most recent post,?Estimating Future Stock Returns?was well-received. ?I expected as much. ?I presented it as part of a larger presentation to a session at the Society of Actuaries 2015 Investment Symposium, and a recent meeting of the Baltimore Chapter of the AAII. ?Both groups found it to be one of the interesting aspects of my presentation.
This post is meant to answer three reasonable questions that got posed:
How do you estimate the model?
How do we understand what it is forecasting given multiple forecast horizons seemingly implied by the model?
Why didn’t the model how badly the market would do in 2001 and 2008? ?And I will add 1973-4 for good measure.
Ready? ?Let’s go!
How to Estimate
In his original piece, @Jesse_Livermore freely gave the data and equation out that he used. ?I will do that as well. ?About a year before I wrote this, I corresponded with him by email, asking if he had noticed that the Fed changed some of the data in the series that?his variable used retroactively. ?That was interesting, and a harbinger for what would follow. ?(Strange things happen when you rely on government data. ?They don’t care what others use it for.)
In 2015, the Fed discontinued one of the series that was used in the original calculation. ?I noticed that when the latest Z.1 report came out, and I tried to estimate it the old way. ?That threw me for a loop, and so I tried to re-estimate the relationship using what data was there. ?That led me to do the following:
use these three series from the Federal Reserve: [B] Domestic nonfinancial sectors; debt securities and loans; liability, [C] Rest of the world; debt securities and loans; liability, and [D]?Domestic financial sectors; corporate equities; liability
I tried to get all of them from one source, and could not figure out how to do it. ?The Z.1 report has all four variables in it, but somehow, the Fed’s Data Download Program, which one of my friends at a small hedge fund charitably referred to as “finicky” did not have that series, and somehow FRED did. ?(I don’t get that, but then there are a lot of things that I don’t get. ?This is not one of those times when I say, “Actually, I do get it; I just don’t like it.” ?That said, like that great moral philosopher Lucy van Pelt, I haven’t ruled out stupidity yet. ?To which I add, including my stupidity.)
The variable is calculated like this:
(A + D)/(A + B + C + D)
Not too hard, huh? ?The R-squared is just a touch lower from estimating it the old way… but the difference is not statistically significant. ?The estimation is just a simple ordinary least squares regression using that single variable as the independent variable, and the dependent variable being the total return on the S&P 500.
As an aside, I tested the variable over other forecast horizons, and it worked best over 10-11 years. ?On individual years, the model is most powerful at predicting the next year (surprise!), and gets progressively weaker with each successive individual year.
To make it concrete: you can use this model to forecast the expected returns for 2016, 2017, 2018, etc. ?It won’t be very accurate, but you can do it. ?The model gets more accurate forecasting over a longer period of time, because the vagaries of individual years average out. ?After 10-11 years, the variable is useless, so if I were put in charge of setting stock market earnings assumptions for a pension plan, I would do it as a step function, 6% for the next 10 years, and 9.5% per year thereafter… or in place of 9.5% whatever your estimate is for what the market should return normally.
On Multiple Forecast Horizons
One reader commented:
I would like to make a small observation if I may. If the 16% per annum from Mar 2009 is correct we still have a 40%+ move to make over the next three years. 670 (SPX March 09) growing at 16% per year yields 2900 +/- in 2019. With the SPX at 2050 we have a way to go. If the 2019 prediction is correct, then the returns after 2019 are going to be abysmal.
The first answer would be that you have to net dividends out. ?In March of 2009, the S&P 500 had a dividend yield of around 4%, which quickly fell as the market rose and dividends fell for about one year. ?Taking the dividends into account, we only need to get to 2270 or so by the March?of 2019, works out to 3.1% per year. ?Then add back a dividend yield of about 2.2%, and you are at a more reasonable 5.3%/year.
That said, I would encourage you to keep your eye on the bouncing ball (and sing along with Mitch… does that date me…?). ?Always look at the new forecast. ?Old forecasts aren’t magic — they’re just the best estimate a single point in time. ?That estimate becomes obsolete as conditions change, and people adjust their portfolio holdings to hold proportionately more or less stocks. ?The seven year old forecast may get to its spot in three years, or it may not — no model is perfect, but this one does pretty well.
What of 2001 and 2008? ?(And 1973-4?)
Another reader wrote:
Interesting post and impressive fit for the 10 year expected returns. ?What I noticed in the last graph (total return) is, that the drawdowns from 2001 and 2008 were not forecasted at all. They look quite small on the log-scale and in the long run but cause lot of pain in the short run.
Markets have noise, particularly during bear markets. ?The market goes up like an escalator, and goes down like an elevator. ?What happens in the last year of a ten-year forecast is a more severe version of what the prior questioner asked about the 2009 forecast of 2019.
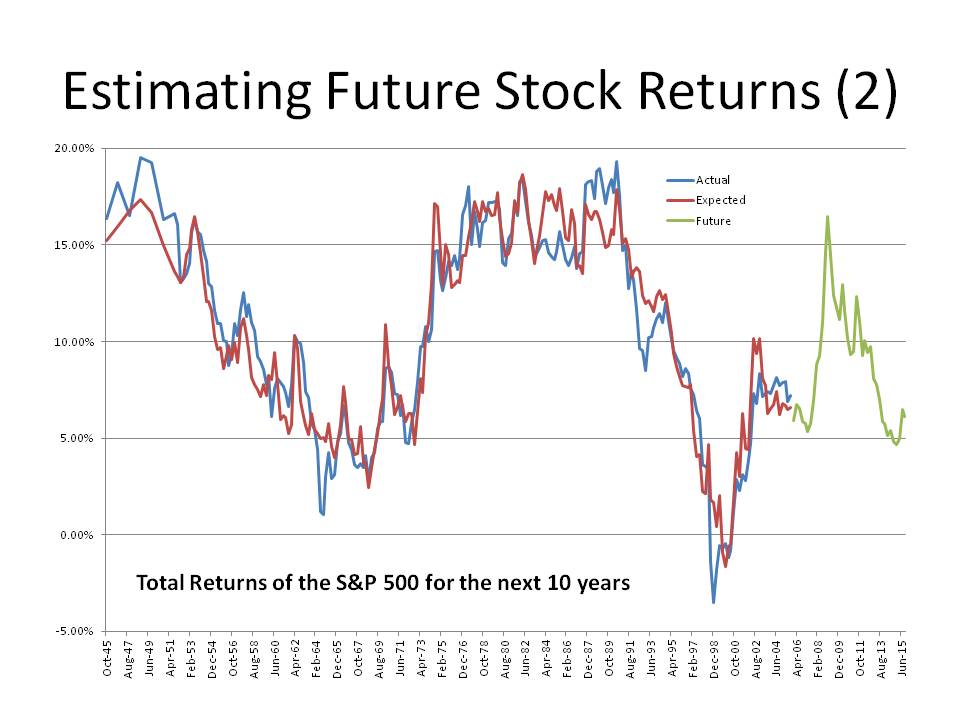
As such, you can’t expect miracles. ?The thing that is notable is how well this model did versus alternatives, and you need to look at the graph in this article to see it (which was at the top of the last piece). ?(The logarithmic graph is meant for a different purpose.)
Looking at 1973-4, 2001-2 and 2008-9, the model missed by 3-5%/year each time at the lows for the bear market. ?That is a big miss, but it’s a lot smaller than other models missed by, if starting 10 years earlier. ?That said, this model would have told you prior to each bear market that future rewards seemed low — at 5%, -2%, and 5% respectively for the ?next ten years.
Conclusion
No model is perfect. ?All models have limitations. ?That said, this one is pretty useful if you know what it is good for, and its limitations.
There are many alternative models for attempting to estimate how undervalued or overvalued the stock market is. ?Among them are:
Price/Book
P/Retained Earnings
Q-ratio (Market Capitalization of the entire market /?replacement cost)
Market Capitalization of the entire market / GDP
Shiller?s CAPE10 (and all modified versions)
Typically these explain 60-70% of?the variation in stock returns. ?Today I can tell you there is a better model, which is not mine, I found it at the blog?Philosophical Economics.? The basic idea of the model is this: look at the proportion of US wealth held by private investors in stocks using the?Fed?s Z.1 report. The higher the proportion, the lower future returns will be.
There are two aspects of the intuition here, as I see it: the simple one is that when ordinary people are scared and have run from stocks, future returns tend to be higher (buy panic). ?When ordinary people are buying stocks with both hands, it is time to sell stocks to them, or even do IPOs to feed them catchy new overpriced stocks (sell greed).
The second intuitive way to view it is that it is analogous to Modiglani and Miller’s capital structure theory, where assets return the same regardless of how they are financed with equity and debt. ?When equity is a small component as?a percentage of market value, equities will return better than when it is a big component.
What it Means Now
Now, if you look at the graph at the top of my blog, which was estimated back in mid-March off of year-end data, you can notice a few?things:
The formula explains more than 90% of the variation in return over a ten-year period.
Back in March of 2009, it estimated returns of 16%/year over the next ten years.
Back in March of 1999, it estimated returns of -2%/year over the next ten years.
At present, it forecasts returns of 6%/year, bouncing back from an estimate of around 4.7% one year ago.
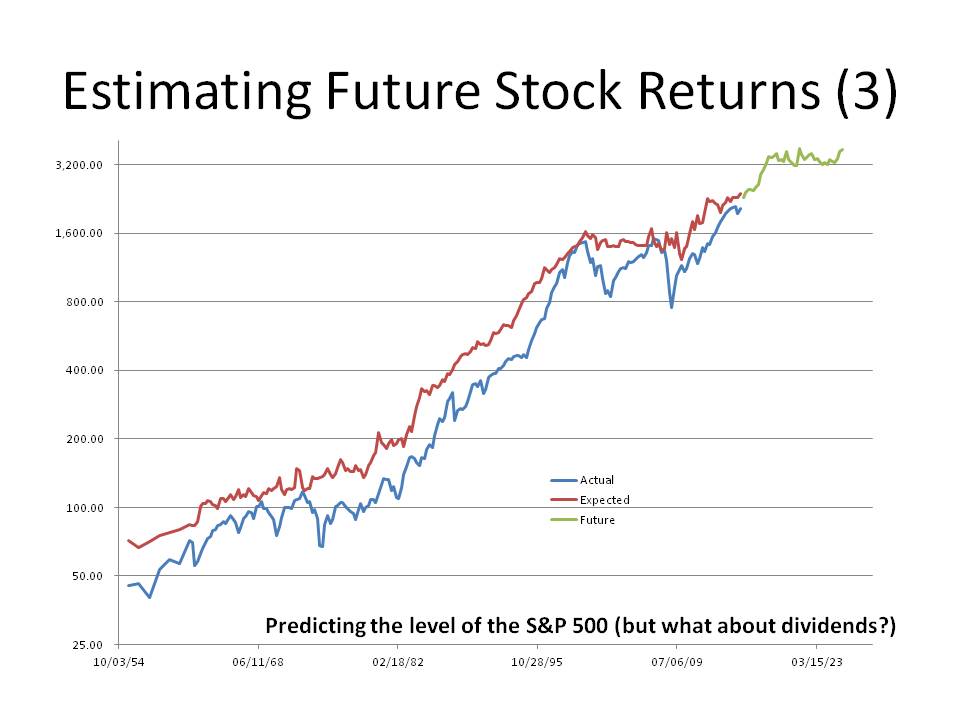
I have two more graphs to show on this. ?The first one below is showing the curve as I tried to fit it to the level of the S&P 500. ?You will note that it fits better at the end. ?The reason for that it is?not a total return index and so the difference going backward in time are the accumulated dividends. ?That said, I can make the statement that the S&P 500 should be near 3000 at the end of 2025, give or take several hundred points. ?You might say, “Wait, the graph looks higher than that.” ?You’re right, but I had to take out the anticipated dividends.
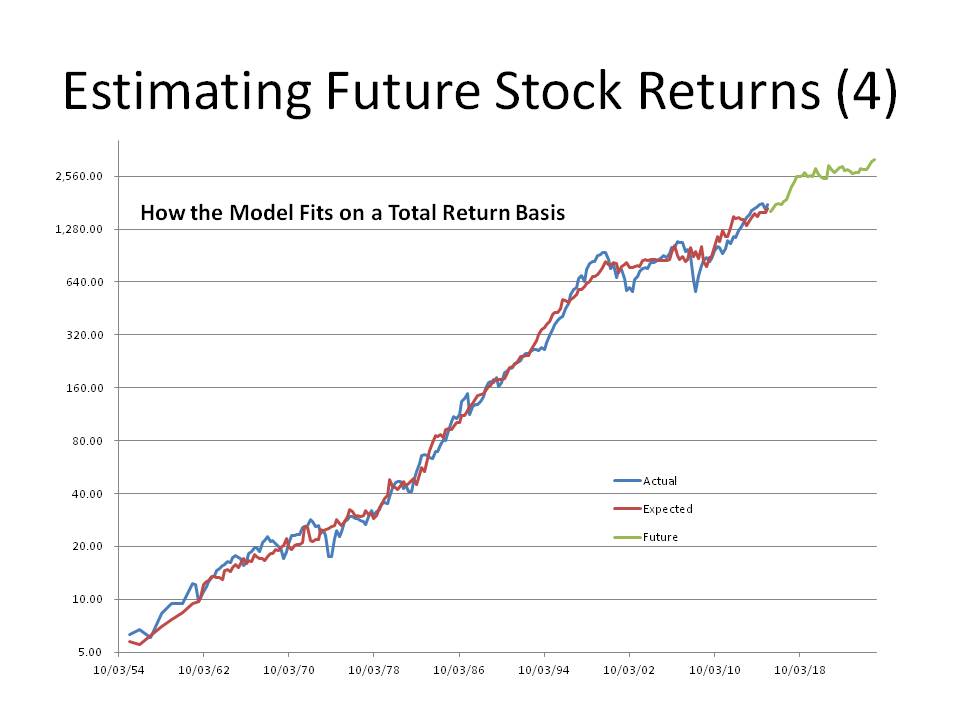
The next graph shows the fit using a homemade total return index. ?Note the close fit.
Implications
If total returns from stocks are only likely to be 6.1%/year (w/ dividends @ 2.2%) for the next 10 years, what does that do to:
Pension funding / Retirement
Variable annuities
Convertible bonds
Employee Stock Options
Anything that relies on the returns from stocks?
Defined benefit pension funds are expecting a lot higher returns out of stocks than 6%. ?Expect funding gaps to widen further unless contributions increase. ?Defined contributions face the same problem, at the time that the tail end of the Baby Boom needs returns. ?(Sorry, they *don’t* come when you need them.)
Variable annuities and high-load mutual funds take a big bite out of scant future returns — people will be disappointed with the returns. ?With convertible bonds, many will not go “into the money.” ?They will remain bonds, and not stock substitutes. ?Many employee stock options and stock ownership plan will deliver meager value unless the company is hot stuff.
The entire capital structure is consistent with low-ish?corporate bond yields, and low-ish volatility. ?It’s a low-yielding environment for capital almost everywhere. ?This is partially due to the machinations of the world’s central banks, which have tried to stimulate the economy by lowering rates, rather than letting recessions clear away low-yielding projects that are unworthy of the capital that they employ.
Reset Your Expectations and Save More
If you want more at retirement, you will have to set more aside. ?You could take a chance, and wait to see if the market will sell off, but valuations today are near the 70th percentile. ?That’s high, but not nosebleed high. ?If this measure got to levels 3%/year returns, I would hedge my positions, but that would imply the S&P 500 at around?2500. ?As for now, I continue my ordinary investing posture. ?If you want, you can do the same.
WESLEY GRAY: Imagine the following theoretical investment opportunity: Investors can invest in a fund that will beat the market by 5% a year over the next 10 years. Of course, there is the catch: The path to outperformance will involve a five-year stretch of poor relative performance.? ?No problem,? you might think?buy and hold and ignore the short-term noise.
Easier said than done.
Consider Ken Heebner, who ran the CGM Focus Fund, a diversified mutual fund that gained 18% annually, and was Morningstar Inc.?s highest performer of the decade ending in 2009. The CGM Focus fund, in many respects, resembled the theoretical opportunity outlined above. But the story didn?t end there: The average investor in the fund lost 11% annually over the period.
What happened? The massive divergence in the fund?s performance and what the typical fund investor actually earned can be explained by the ?behavioral return gap.?
The behavioral return gap works as follows: During periods of strong fund performance, investors pile in, but when fund performance is at its worst, short-sighted investors redeem in droves. Thus, despite a fund?s sound long-term process, the ?dollar-weighted? returns, or returns actually achieved by investors in the fund, lag substantially.
In other words, fund managers can deliver a great long-term strategy, but investors can still lose.
That’s why I wanted to write this post. ?Ken Heebner is a really bright guy, and has the strength of his convictions, but his investors don’t in general have similar strength of convictions. ?As such, his investors buy high and sell low with his funds. ?The graph at the left is from the CGM Focus Fund, as far back as I could get the data at the SEC’s EDGAR database. ?The fund goes all the way back to late 1997, and had a tremendous start for which I can’t find the cash flow data.
The column marked flows corresponds to a figure called “Change in net assets derived from capital share transactions” from the Statement of Changes in Net Assets in the annual and semi-annual reports. ?This is all public data, but somewhat difficult to aggregate. ?I do it by hand.
I use annual cashflows for most of the calculation. ?For the buy and hold return, i got the data from Yahoo Finance, which got it from Morningstar.
Note the pattern of cashflows is positive until?the financial crisis, and negative thereafter. ?Also note that more has gone into the fund than has come out, and thus the average investor has lost money. ?The buy-and-hold investor has made money, what precious few were able to do that, much less rebalance.
This would be an ideal fund to rebalance. ?Talented manager, will do well over time. ?Add money when he does badly, take money out when he does well. ?Would make a ton of sense. ?Why doesn’t it happen? ?Why doesn’t at least buy-and-hold happen?
It doesn’t happen because there is a Asset-Liability mismatch. ?It doesn’t matter what the retail investors say their time horizon is, the truth is it is very short. ?If you underperform for less?than a few years, they yank funds. ?The poetic justice is that they yank the funds just as the performance is about to turn.
Practically, the time horizon of an average investor in mutual funds is inversely proportional to the volatility of the funds they invest in. ?It takes a certain amount of outperformance (whether relative or absolute) to get them in, and a certain amount of underperformance to get them out. ?The more volatile the fund, the more rapidly that happens. ?And Ken Heebner is so volatile that the only thing faster than his clients coming and going, is how rapidly he turns the portfolio over, which is once every 4-5 months.
Pretty astounding I think. ?This highlights two main facts about retail investing that can’t be denied.
Asset prices move a lot more than fundamentals, and
Most investors chase performance
These two factors lie behind most of the losses that retail investors suffer over the long run, not active management fees. ?remember as well that passive investing does not protect retail investors from themselves. ?I have done the same analyses with passive portfolios — the results are the same, proportionate to volatility.
I know buy-and-hold gets a bad rap, and it is not deserved. ?Take a few of my pieces from the past:
If you are a retail investor, the best thing you can do is set an asset allocation between risky and safe assets. ?If you want a spit-in-the-wind estimate use 120 minus your age for the percentage in risky assets, and the rest in safe assets. ?Rebalance to those percentages yearly. ?If you do that, you will not get caught in the cycle of greed and panic, and you will benefit from the madness of strangers who get greedy and panic with abandon. ?(Why 120? ?End of the mortality table. 😉 Take it from an investment actuary. 😉 We’re the best-kept secret in the financial markets. 😀 )
Okay, gotta close this off. ?This is not the last of this series. ?I will do more dollar-weighted returns. ?As far as retail investing goes, it is the most important issue. ?Period.
Suppose you wanted a comprehensive book on all of the ways that there are to get excess returns from the stock market as a type of value investor (as of year-end 2013), and you wanted it in one slim volume. ?This is that book. ?As with most desires there is the “be careful what you wish for, you just might get it” effect. ?This book is not immune.
At Aleph Blog, I try to write book reviews that always include what sort of reader might benefit from a given book. ?Because this book packs so much into such a small space, it is not a?book for beginners unless they are?prodigies. ?If you are a beginner, better to warm up with something like The Intelligent Investor, by Ben Graham. ?Beginners need time to see concepts described in greater detail, and more slowly.
Though it is a book on value investing, it is expansive in what it considers value investing. ?It includes topics as varied as:
Behavioral Economics
Market-timing from a valuation standpoint
Growth at a reasonable price [GARP] investing
Private investing
Shorting
Event-driven investing
Barriers to considering investments that keep others from buying them at attractive prices
In a book of around 300 pages, this is ambitious. ?It gives you one or two passes over important topics, so you are only getting a taste of the ideas involved. ?This is also predominantly a book on qualitative investing. ?Pure quantitative value investing doesn’t get much play. ?Non-value anomalies don’t get much coverage.
The other?thing the book lacks is a way to pull it all together in a practical way. ?Yes, the last chapter tries to pull it all together, but given the breadth of the material, it gets pulled together in terms of the attitudes you need to do this right, but less of a “how do you structure an overall investment process to put these principles into practical action.” ?Providing more examples could have been useful, and really, the whole book could have benefited from that.
Additional Resources
Now, if you want a greater taste of the book without buying it, I’ve got a deal for you: this is a medium-sized slide presentation that summarizes the book. ?Pretty sweet, huh? ?It represents the book well, so if you are on the fence, I would look at it — after that you would know if you want to buy it.
Full disclosure:?I?received a?copy from the author.
If you enter Amazon through my site, and you buy anything, I get a small commission.? This is my main source of blog revenue.? I prefer this to a ?tip jar? because I want you to get something you want, rather than merely giving me a tip.? Book reviews take time, particularly with the reading, which most book reviewers don?t do in full, and I typically do. (When I don?t, I mention that I scanned the book.? Also, I never use the data that the PR flacks send out.)
Most people buying at Amazon do not enter via a referring website.? Thus Amazon builds an extra 1-3% into the prices to all buyers to compensate for the commissions given to the minority that come through referring sites.? Whether you buy at Amazon directly or enter via my site, your prices don?t change.
One of the constants in investing is that average investors show up late to the party or to the crisis. ?Unlike many gatherings where it may be cool to be fashionably late, in investing it tends to mean you earn less and lose more, which is definitely not cool.
One reason why this happens is that information gets distributed in lumps. ?We don’t notice things in real time, partly because we’re not paying attention to the small changes that are happening. ?But after enough time passes, a few people notice a trend. ?After a while longer, still more people notice the trend, and it might get mentioned in some special purpose publications, blogs, etc. ?More time elapses and it becomes a topic of conversation, and articles make it into the broad financial press. ?The final phase is when?general interest magazines put it onto the cover, and get rich quick articles and books point at how great fortunes have been made, and you can do it too!
That slow dissemination and?gathering of information is paralleled by a similar flow of money, and just as the audience gets wider, the flow of money gets bigger. ?As the flow of money in or out gets bigger, prices tend to overshoot fair value, leaving those who arrived last with subpar returns.
There is another aspect to this, and that stems from the way that people commonly evaluate managers. ?We use past returns as a prologue to what is assumed to be still?greater returns in the future. ?This not only applies to retail investors but also many institutional investors. ?Somme institutional investors will balk at this conclusion, but my experience in talking with institutional investors has been that though they look at many of the right forward looking indicators of manager quality, almost none of them will hire a manager that has the right people, process, etc., and has below average returns relative to peers or indexes. ?(This also happens with hedge funds… there is nothing special in fund analysis there.)
For the retail crowd it is worse, because?most investors look at past returns when evaluating managers. ?Much as Morningstar is trying to do the right thing, and have forward looking analyst ratings (gold, silver, bronze, neutral and negative), yet much of the investing public will not touch a fund unless it has four or five stars from Morningstar, which is a backward looking rating. ?This not only applies to individuals, but also committees that choose funds for defined contribution plans. ?If they don’t choose the funds with four or five stars, they get complaints, or participants don’t use the funds.
Another Exercise in Dollar-Weighted Returns
One of the ways this investing shortfall gets expressed is looking at the difference between time-weighted (buy-and-hold) and dollar-weighted (weighted geometric average/IRR) returns. ?The first reveals what an investor who bought and held from the beginning earned, versus what the average dollar invested earned. ?Since money tends to come after good returns have been achieved, and money tends to leave after bad returns have been realized, the time-weighted returns are typically higher then the dollar-weighted returns. ?Generally, the more volatile the performance of the investment vehicle the larger the difference between time- and dollar-weighted returns gets. ?The greed and fear cycle is bigger when there is more volatility, and people buy and sell at the wrong times to a greater degree.
(An aside: much as some pooh-pooh buy-and-hold investing, it generally beats those who trade. ?There may be intelligent ways to trade, but they are always a minority among market actors.)
HSGFX Dollar and Time Weighted Returns
That brings me to tonight’s fund for analysis: Hussman Strategic Growth [HSGFX]. John Hussman, a very bright guy, has been trying to do something very difficult — time the markets. ?The results started out promising, attracting assets in the process, and then didn’t do so well, and assets have slowly left. ?For my calculation this evening, I run the calculation on his fund with the longest track record from inception to 30 June 2014. ?The fund’s fiscal years end on June 30th, and so I assume cash flows occur at mid-year as a simplifying assumption. ?At the end of the scenario, 30 June 2014, I assume that all of the funds remaining get paid out.
To run this calculation, I do what I have always done, gone to the SEC EDGAR website and look at the annual reports, particularly the section called “Statements of Changes in Net Assets.” ?The cash flow for each fiscal year is equal to the?net increase in net assets from capital share transactions plus the net decrease in net assets from distributions to shareholders. ?Once I have?the amount of money moving in or out of the fund in each fiscal year, I can then run an internal rate of return calculation to get the dollar-weighted rate of return.
In my table, the cash flows into/(out of) the fund are in millions of dollars, and the column titled Accumulated PV is the?accumulated present value calculated at an annualized rate of -2.56% per year, which is the dollar-weighted rate of return. ?The zero figure at the top shows that a discount rate -2.56% makes the cash inflows and outflows net to zero.
From the beginning of the Annual Report for the fiscal year ended in June 2014, they helpfully provide the buy-and-hold return since inception, which was +3.68%. ?That gives a difference of 6.24% of how much average investors earned less than the buy-and-hold investors. ?This is not meant to be a criticism of Hussman’s performance or methods, but simply a demonstration that a lot of people invested money after the fund’s good years, and then removed money after years of underperformance. ?They timed their investment in a market-timing fund poorly.
Now, Hussman’s fund may do better when the boom/bust cycle turns if his system makes the right move?somewhere near the bottom of the cycle. ?That didn’t happen in 2009, and thus the present state of affairs. ?I am reluctant to criticize, though, because I tried running a strategy like this for some of my own clients and did not do well at it. ?But when I realized that I did not have the personal ability/willingness to?buy when valuations were high even though the model said to do so because of momentum, rather than compound an error, I shut down the product, and refunded some fees.
One thing I can say with reasonable confidence, though: the low returns of the past by themselves are not a reason to not invest in Mr. Hussman’s funds. ?Past returns by themselves tell you almost nothing about future returns. ?The hard questions with a fund like this are: when will the cycle turn from bullish to bearish? ?(So that you can decide how long you are willing to sit on the sidelines), and when the cycle turns from bearish to bullish, will Mr. Hussman make the right decision then?
Those questions are impossible to answer with any precision, but at least those are the right questions to ask. ?What, you’d rather have the answer to a simple question like how did it return?in the past, that has no bearing on how the fund will do in the future? ?Sadly, that is the answer that propels more investment decisions than any other, and it is what leads to bad overall investment returns on average.
PS — In future articles in this irregular series, I will apply this to the Financial Sector Spider [XLF], and perhaps some fund of Kenneth Heebner’s. ?Till then.
Photo Credit: Hans and Carolyn || Do you have the right building blocks for your model?
Simulating hypothetical future investment returns can be important for investors trying to make decisions regarding the riskiness of various investing strategies. ?The trouble is that it is difficult to do right, and I rarely see it done right. ?Here are some of the trouble spots:
1) You need to get the correlations right across assets. ?Equity returns need to move largely but not totally together, and the same for credit spreads and equity volatility.
2) You need to model bonds from a yield standpoint and turn the yield changes into price changes. ?That keeps the markets realistic, avoiding series of price changes which would imply that yields would go too high or below zero.?Yield curves also need ways of getting too steep or too inverted.
3) You need to add in some momentum and weak mean reversion for asset prices. ?Streaks happen more frequently than pure randomness. ?Also, over the long haul returns are somewhat predictable, which brings up:
4) Valuations. ?The mean reversion component of the models needs to reflect valuations, such that risky assets rarely get “stupid cheap” or stratospheric.
5) Crises need to be modeled, with differing correlations during crisis and non-crisis times.
6) Risky asset markets need to rise much more frequently than they fall, and the rises should be slower than the falls.
7) Foreign currencies, if modeled, have to be consistent with each other, and consistent with the interest rate modeling.
Anyway, those are some of the ideas that realistic simulation models need to follow, and sadly, few if any follow them all.
Sometime in the next few weeks, I am going to dig into my pre-2003 [pre-RealMoney] files and see if there is anything there to share with readers. ?Most of my best stories I have already told in my various series. ?The one I will tell tonight I don’t think I have told.
In 1994, we had a problem at Provident Mutual’s Pension Division. ?Our main external equity manager was having a very lousy year as value managers that focused on absolute yield were getting taken to the cleaners. ?This was after a few years of poor performance — the joke was, given the great performance of the past, “Hey, can you develop the 19-year track record?” ?(The last 5 years as a group were horrid, but the previous 14 were great.)
Aside: there aren’t many absolute yield managers in equities today. ?Back when dividend yields were higher, and corporate bond yields were higher, both absolute and relative yield managers flourished as interest rates and dividend yields?crested in the early 1980s, and the stocks paying high dividends got bid up as interest rates fell, much as the same thing happened to zero coupon and other noncallable long duration bonds.
The process started with a call from a manager of managers who proposed that we start up “multiple manger funds,” where we would be the manager of managers.
This offered several advantages:
It offered us an easy out with our long-held failing manager, because we are not firing them, just making them a portion of the assets in the value fund.
It would make eliminating them easier in a second step, with less PR damage.
It would make us look like we were taking action and control in a new way for our clients. (They loved it.)
As it was, we did a good job selecting managers, and the funds performed well.
We could negotiate lower fees with the managers,
It gave us a great marketing story.
Our margins and growth improved.
I was critical to the process, being the only member of the team with investment expertise. ?Everyone else was a marketer or the divisional head. ?(I take that back, one member of the marketing area was genuinely sharp with investments.) ?After we chose the managers, I set the allocations.
Now onto tonight’s topic (what a long intro): At the beginning of our relationship with the manager of managers, they did a traditional holdings-based analysis of how a manager managed assets. ?About one year into the process, they introduced returns-based style analysis.
Though the Wikipedia article just cited has a bevy of errors, it will still give you a flavor for what it is. ?Let me give my own explanation:
It takes a lot of effort and wisdom to look at quarterly portfolio snapshots and analyze what a manager is doing. ?You almost have to be as wise as the manager himself to analyze it, but many fund analysts developed the skill.
But returns-based style analysis offered the holy grail: we can understand what the manager is doing simply by comparing the returns of the manager versus returns on ?variety of asset indexes, using constrained multiple regression.
The idea was this: the returns of a manager are equal to his alpha versus a composite index that best fits his performance. ?Since we were dealing with long-only managers, the weights on the index components could not be negative.
The practical upshot to the manager of mangers was: “Whoopee! ?We can analyze every manager under the sun just by looking?at their return patterns. ?No more time-consuming work.”
After the first meeting with the manager of managers, I expressed my doubts, and asked for a special meeting with their quants. ?A week later, I had a meeting with a few members of their staff, of which one was the quant, a nice lady 10 years my junior, who I felt sorry for. ?She started her presentation at a very basic level, and asked “Do you have any questions?” ?I asked, “Isn’t this just an quadratic optimization problem where you are choosing weights on the convex hull?” ?She paused, and said, “Oh, so you *do* understand this.” ?The meeting ended son after that — we agreed on the math, and in math, there is no magic.
But that placed me on the warpath; I genuinely felt the advice we were getting had declined in value. ?I wrote a 16-page report to our manager explaining why returns-based style analysis was inferior.
There is no way to correctly estimate error bounds, because of nonlinear constraints. ?(Note: two years later, I guy came up with an approximate way to do it in an article in the Financial Analysts Journal. ?I called him, and we had a great talk. ?That said, approximate is approximate, and I haven’t seen any adopt it.)
Because many of the indexes are highly correlated with each other, small differences in manager returns make a huge difference in the weight calculated for each index.
If a manager is changing investments because he senses a factor like market cap size or valuation is cheap, it will get interpreted as a change in his index, and will not come out as alpha, but as beta.
If I don’t believe that the CAPM and MPT are valid, why should I believe this monstrosity?
And more… I hope I find my 16-page paper in my files.
After six more months we terminated the manager of managers, and hired a better one.
Lower fees
Lower fees from managers (they had greater bargaining power)
We reduced our fees to clients
Better marketing name
Holdings based manager analysis
After that, things were much better, and we continued to grow.
My years at Provident Mutual were exceedingly fruitful — this was just one of many areas where my efforts paid off well.
All that said, there is no way to fix returns-based style analysis. ?It is a bogus concept and needs to be abandoned. ?Those who use it do not grasp the limits of econometrics, and are Sorcerer’s apprentices.
PS — Need I mention that the originator of the idea, Bill Sharpe, is not all that sharp with econometrics? ?He’s a bright guy, but it is not his strong suit.
PPS — there are not many actuaries with a background in econometrics. ?That is why I have written this.
This is the first episode of “We Eat Dollar Weighted Returns” where the fare is yummy.? Here’s the twist: investors in some bond ETFs have done better than one who bought at the beginning and held.
As bond funds go, these are relatively volatile.? TLT buys the longest Treasury bonds, taking interest rate risk.? HYG and JNK buy junk bonds, taking credit risk.
Let’s start with TLT:
Date
Cash Flow
Buy & Hold Return
Cumulated
11/9/2002
248,935,892
1
8/31/2003
-73,889,166
12.31%
1.1231
8/31/2004
439,348,999
3.11%
1.15802841
8/31/2005
73,509,821
6.72%
1.235847919
8/31/2006
442,211,811
6.12%
1.311481812
8/31/2007
165,784,828
3.37%
1.355678749
8/31/2008
-344,202,681
9.54%
1.485010502
8/31/2009
887,336,789
12.30%
1.667666793
8/31/2010
120,142,522
-5.85%
1.570108286
8/31/2011
-452,062,384
4.64%
1.64296131
2/29/2012
-3,038,265,474
32.32%
2.173966406
IRR
Buy & Hold
Difference
11.47%
8.42%
3.05%
I analyzed this back in June, saw the anomalous result, an decide to sit on it until I had more time to analyze it.? The way to think about it is that investors reached for yield at a time when stocks were in trouble, and indeed, rates went lower.? The average investor beat buy-and-hold by 3%.
Here are the results for the junk ETFs:
HYG
4/4/2007
2/29/2008
2/28/2009
2/28/2010
2/28/2011
2/29/2012
Distributions
-9,708
-92,708
-358,324
-512,979
-694,209
Net Additions
371,140
1,989,303
1,781,425
3,201,608
5,840,594
Net Assets
352,636
2,089,054
4,611,414
8,257,928
14,258,718
Investment Return
-8,796
-160,176
1,099,260
957,884
854,406
ROA
-4.57%
-13.12%
32.81%
14.89%
7.59%
4/4/2007
9/16/2007
8/29/2008
8/29/2009
8/29/2010
8/30/2011
2/29/2012
13.40%
IRR
-361,432
-1,896,594
-1,423,100
-2,688,629
-5,146,384
14,258,718
6.04%
Buy-and hold
7.36%
Difference
JNK
11/28/2007
6/30/2008
6/30/2009
6/30/2010
6/30/2011
6/30/2012
Distributions
-9,011
-111,409
-361,521
-616,525
-735,822
Net Additions
404,658
1,481,309
2,180,582
2,366,102
3,928,526
Net Assets
394,346
1,900,709
4,301,252
6,915,538
10,780,535
Investment Return
-1,302
136,463
581,481
864,710
672,292
ROA
-0.61%
11.89%
18.75%
15.42%
7.60%
IRR
11/28/2007
3/14/2008
12/29/2008
12/29/2009
12/29/2010
12/30/2011
6/30/2012
13.22%
IRR
-395,648
-1,369,900
-1,819,061
-1,749,577
-3,192,704
10,780,535
6.49%
Buy-and hold
6.73%
Difference
Both funds were small in advance of the credit crisis, and investors bought into them as yields spiked, and bought even more as income opportunities diminished largely due to the Fed’s low-rate monetary policies. The average investor beat buy-and-hold by 6%+.
Now, the? junk funds were small during default, and grew during the boom, amid unprecedented monetary [policy from the Fed.? (Note: I think that Bernanke will rank below Greenspan in the history books in 210o, and both will be judged to be horrendous failures.? It is better to let things fail, and clear out the bad debt, rather than continue malinvestment.? We need fewer banks, houses, and auto companies, among others.? The government, including the Fed and the GSEs, should not be in the lending business.? Lending should be unusual, and applied mostly to financing short-term assets.? Long-term assets should be financed by equity, or at worst, long-dated debt.
For all three funds, we have the historical accident that the Fed dropped Fed funds rates to near zero, leading to a yield frenzy.? But what happens when defaults spike?? What? happens when no one want to buy long dated Treasuries at anything near current levels?
I think bond investors are more rational than stock investors; they have more rational benchmarks to guide them.? Bond investors have cash flows to analyze against EBITDA (earnings before interest, taxes, depreciation and amortization.? Stock investors wonder at earnings, which are easily gamed.
The real question will come when we have the next credit crisis?? How many holders of HYG or JNK will run then?? Or when inflation starts to run, and the Fed stops buying long Treasury bonds, and even starts to sell them, what will happen to dollar-weighted returns then?
This is an interesting piece for bond assets in a bull market.? We need to see bear market results to truly understand what is going on.