Another quarter goes by, the market rises further, and the the 10-year forward return falls again.? Here are the last eight values:?6.10%, 6.74%, 6.30%, 6.01%, 5.02%, 4.79%, and 4.30%, 3.99%. ?At the end of September 2017, the figure would have been 4.49%, but the rally since the end of the quarter shaves future returns down to 3.99%.
At the end of June the figure was 4.58%.? Subtract 29 basis points for the total return, and add back 12 basis points for mean reversion, and that would leave us at 4.41%.? The result for September month-end was 4.49%, so the re-estimation of the model added 8 basis points to 10-year forward returns.
Let me explain the adjustment calculations.? In-between quarterly readings, price movements shave future returns the same as a ten-year zero coupon bond.? Thus, a +2.9% move in the total return shaves roughly 29 basis points off future returns. (Dividing by 10 is close enough for government work, but I use a geometric calculation.)
The mean-reversion calculation is a little more complex.? I use a 10-year horizon because that is the horizon the fits the data best.? It is also the one I used before I tested it.? Accidents happen.? Though I haven’t talked about it before, this model could be used to provide shorter-run estimates of the market as well — but the error bounds around the shorter estimates would be big enough to make the model useless. It is enough to remember that when a market is at high valuations that corrections can’t be predicted as to time of occurrence, but when the retreat happens, it will be calamitous, and not orderly.
Beyond 10-years, though, the model has no opinion.? It is as if it says, past mean returns will occur.? So, if we have an expectation of a 4.58% returns, we have one 4.58%/yr quarter drop of at the end of the quarter, and a 9.5% quarter added on at the end of the 10-year period. That changes the quarterly average return up by 4.92%/40, or 12.3 basis points.? That is the mean reversion effect.
Going Forward
Thus, expected inflation-unadjusted returns on the S&P 500 are roughly 3.99% over the next ten years.? That’s not a lot of compensation for risk versus investment-grade bonds.? We are at the 94th percentile of valuations.
Now could we go higher?? Sure, the momentum is with us, and the volatility trade reinforces the rise for now.? Bitcoin is an example that shows that there is too much excess cash sloshing around to push up the prices of assets generally, and especially those with no intrinsic value, like Bitcoin and other cryptocurrencies.
Beyond that, there are not a lot of glaring factors pushing speculation, leaving aside futile government efforts to stimulate an already over-leveraged economy.? It’s not as if consumer or producer behavior is perfectly clean, but the US Government is the most profligate actor of all.
And so I say, keep the rally hats on.? I will be looking to hedge around an S&P 500 level of 2900 at present.? I will be watching the FOMC, as they may try to invert the yield curve again, and crash things.? They never learn… far better to stop and wait than make things happen too fast.? But they are omnipotent fools.? Maybe Powell will show some non-economist intelligence and wait once the yield curve gets to a small positive slope.
Who can tell?? ?Well, let’s see how this grand experiment goes as Baby Boomers arrive at the stock market too late to save for retirement, but just in time to put in the top of the equity market.? Though I am waiting until S&P 2900 to hedge, I am still carrying 19% cash in my equity portfolios, so I am bearish here except in the short-run.
PS — think of it this way: it should not have gone this high, therefore it could go higher still…
I’d say this is getting boring, but it’s pretty fascinating watching the rally run. ?Now, this is the seventh time I have done this quarterly analysis. ?The first one was for December 2015. ?Over that time period, the expected annualized 10-year return went like this, quarter by quarter: 6.10%, 6.74%, 6.30%, 6.01%, 5.02%, 4.79%, and 4.30%. ?At the end of June 2017, the figure would have been 4.58%, but the rally since the end of the quarter shaves future returns down to 4.30%.
We are now in the 93rd percentile of valuations.
Wow.
This era will ultimately be remembered as a hot time in the markets, much like 1965-9, 1972, and 1997-2001.
The Internal Logic of this Model
I promised on of my readers that I would provide the equation for this model. ?Here it is:
10-year annualized total return = 32.77% – (70.11% * Percentage of total assets held in stocks for the US as a whole)
Now, the logic of this formula stems from the idea that the return on total assets varies linearly with the height of the stock market, and the return on debt (everything else aside from stocks) does not. ?After that, the formula is derived from the same formula that we use for the weighted average cost of capital [WACC]. ?Under those conditions, the total returns of the stock market can be approximated by a linear function of the weight the stocks have in the WACC formula.
Anyway, that’s one way to think of the logic behind this.
The Future?
Now, what are some of the possibilities for the future?
Above you see the nineteen scenarios for where the S&P 500 will be in 10 years, assuming a 2% dividend yield, and looking at the total returns that happen when the model forecasts returns between 3.30% and 5.30%. ?The total returns vary from 2.31%/year to 6.50%, and average out to 3.97% total returns. ?The bold line above is the 4.30% estimate.
As I have said before, this bodes ill for all collective security schemes that rely on the returns of risky assets to power the payments. ?There is no conventional way to achieve returns higher than 5%/year for the next ten years, unless you go for value and foreign markets (maybe both!).
Then again, the simple solution is just to lighten up and let cash build. ?Now if we all did that, we couldn’t. ?Who would be buying? ?But if enough of us did it such that equity valuations declined, there could be a more orderly market retreat.
The attitude of the market on a qualitative basis doesn’t seem nuts to me yet, so I am at maximum cash for ordinary conditions, but I haven’t hedged. ?When expected 10-year market returns get to 3%/year, I will likely do that, but for now I hold my stocks.
PS — the first article of this series has been translated into Chinese. ?The same website has 48 of my best articles in Chinese, which I find pretty amazing. ?Hope you smile at the cartoon version of me. 😉
I lost this post once already, hopefully it will be better-written this time. ?I’ve been playing around with the stock market prediction model in order to give some idea of how the actual results could vary from the forecasts.
Look at the graph above. ?it shows potential price returns that vary from -1.51%/year to 4.84%/year, with a most likely value of 2.79%, placing the S&P 500 at 3200 in March 2027. ?Add onto this a 2% dividend yield to get the total returns.
The 26 paths above come from the 26 times in the past that the model forecast total returns within 1% of 4.79%. ?4.79% is at the 90th percentile of expected returns. ?Typically in the past, when expected returns were in the lower two deciles, actual returns were lower still. ?For the 26 scenarios, that difference was 0.63%/year, which would imply 10-year future returns in the 4.16%/year area.
The pattern of residuals is unusual. ?The model tends to overestimate returns at the extremes, and underestimate when expected returns are “normal.” ?I can’t think of a good reason for this. ?If you have a good explanation please give it in the comments.
Now if errors followed a normal distribution, a 95% confidence interval on total returns would be plus or minus 3.8%, i.e., from 1.0% to 8.6%. ?I find the non-normal confidence interval, from 0.5% to 6.8% to be more plausible, partly because valuations would be a new record in 2027 if we had anything near 8.6%/year for the next ten years. ?Even 6.8%/year would be a record. ?That”s why I think a downward bias on results makes sense, with high valuations.
At the end of the first quarter, the model forecast total returns of 5.06%/year for the next ten years. ?With the recent rally, that figure is now 4.79%/year. ?Now, how excited should we be about these returns? ?Not very? ?I can buy that.
But what if you were a financial planner and thought this argument to be plausible? ?Maybe you can get 3.5%/year out of bonds over the next ten years. ?With 4.79% on stocks, and a 60/40 mix of stocks/bonds, that means returns of 4.27%. ?Not many financial planning models are considering levels like that.
But now think of pension plans and endowments. ?How many of them have assumptions in the low 4% region? ?Some endowments are there as far as a spending rule goes, but they still assume some capital gains to preserve the purchasing power of the endowment. ?Pension plans are nowhere near that, and if they think alternative investments will bail them out, they don’t know what they are doing. ?Alternatives are common enough now that the face the same allocative behavior from institutional investors, which then correlates their returns with regular investments in the future, even if they weren’t so in the past.
I don’t have much more to say, so I will close with this: if you want to study this model more, you need to read the articles in this series, and the articles referenced at the Economic Philosopher blog. ?Move your return expectations down, and diversify away from the US; there are better returns abroad — but remember, there are good reasons for home bias, so choose your foreign investments with care.
Are you ready to earn 6%/year until 9/30/2026? ?The data from the Federal Reserve comes out with some delay. ?If I had it instantly at the close of the third quarter, I would have said 6.37% ? but with the run-up in prices since then, the returns decline to 6.01%/year.
So now I say:
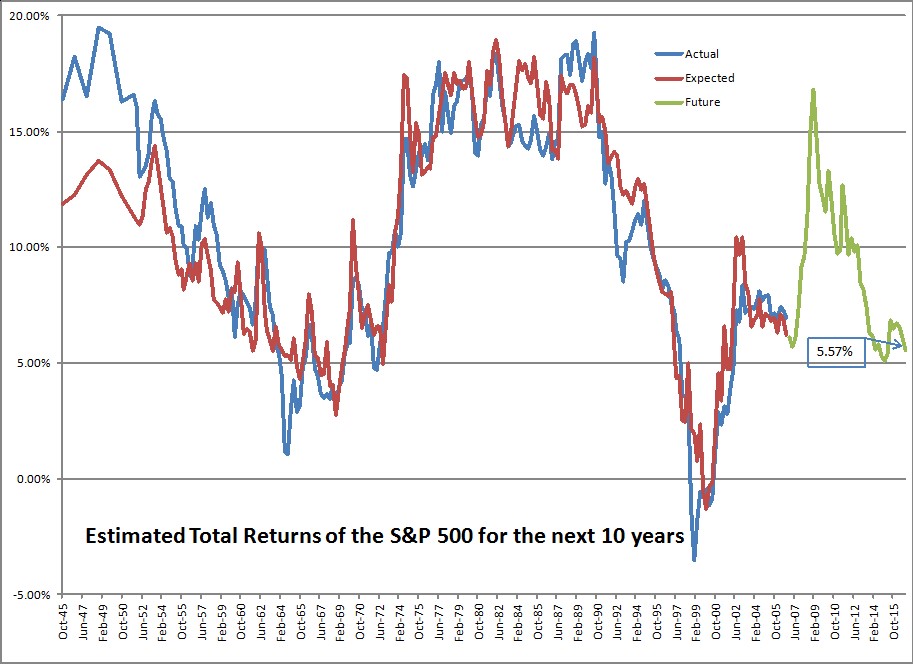
Are you ready to earn 5%/year until 12/31/2026? ?The data from the Federal Reserve comes out with some delay. ?If I had it instantly at the close of the fourth?quarter, I would have said 5.57% ? but with the run-up in prices since then, the returns decline to 5.02%/year.
A one percent drop is pretty significant. ?It stems from one main factor, though — investors are allocating a larger percentage of their total net worth to stocks. ?The amount in stocks moved from 38.00% to 38.75%, and is probably higher now. ?Remember that these figures come out with a 10-week delay.
Remember that the measure in question covers both public and private equities, and is market value to the extent that it can be, and “fair value” where it can’t. ?Bonds and most other assets tend to be a little easier to estimate.
So what does it mean for the ratio to move up from 38.00% to 38.75%? ?Well, it can mean that equities have appreciated, which they have. ?But corporations buy back stock, pay dividends, get acquired for cash which reduces the amount of stock outstanding, and places more cash in the hands of investors. ?More cash in the hands of investors means more buying power, and that gets used by many long-term institutional investors who have fixed mandates to follow. ?Gotta buy more if you hit the low end of your equity allocation.
And the opposite is true if new money gets put into businesses, whether through private equity, Public IPOs, etc. ?One of the reasons this ratio went so high in 1998-2001 was the high rate of business formation. ?People placed more money at risk as they thought they could strike it rich in the Dot-Com bubble. ?The same was true of the Go-Go era in the late 1960s.
Remember here, that average returns are around 9.5%/year historically. ?To be at 5.02% places us in the 88th percentile of valuations. ?Also note that I will hedge what I can if expected 10-year returns get down to 3%/year, which corresponds to a ratio of 42.4% in stocks, and the 95th percentile of valuations. ?(Note, all figures in this piece are nominal, not inflation-adjusted.) ?At that level, past 10-year returns in the equity markets have been less than 1%, and in the short-to-intermediate run, quite poor.)
You can also note that short-term and 10-year Treasury yields have risen, lowering the valuation advantage versus cash and bonds.
The investors? positioning suggests burgeoning optimism, with TD Ameritrade clients increasing their net exposure to stocks in February, buying bank shares and popular stocks such as Amazon.com Inc. and sending the retail brokerage?s Investor Movement Index to a fresh high in data going back to 2010. The index tracks investors? exposure to stocks and bonds to gauge their sentiment.
?People went toe in the water, knee in the water and now many are probably above the waist for the first time,? said JJ Kinahan, chief market strategist at TD Ameritrade.
This is sad to say, but it is rare for a rally to end before the “dumb money” shows up in size. ?Running a small asset management shop like I do, at times like this I suggest to clients that they might want more bonds (with me that’s short and high quality now), but few do that. ?Asset allocation is the choice of my clients, not me. ?That said, most of my clients are long-term investors like me, for which I give them kudos.
Then there is this piece over at Bloomberg.com called:?Wall Street’s Buzz Over ‘Great Leader’ Trump Gives Shiller Dot-Com Deja Vu. ?I want to see the next data point in this analysis, which won’t be available by mid-June, but I do think a lot of the rally can be chalked up to willingness to take more risk.
I do think that most people and corporations think that they will have a more profitable time under Trump rather than Obama. ?That said, a lot of the advantage gets erased by a higher cost of debt capital, which is partly driven by the Fed, and partly by a potentially humongous deficit. ?As I have said before though, politicians are typically limited in what they can do. ?(And the few unlimited ones are typically destructive.)
Shiller’s position is driven at least partly by the weak CAPE model, and the rest by his interpretation of current events. ?I don’t make much out of policy uncertainty indices, which are too new. ?The VIX is low, but hey, it usually is when the market is near new highs. ?Bull markets run on complacency. ?Bear markets plunge on revealed credit risk threatening economic weakness.
One place I will agree with Shiller:
What Shiller will say now is that he?s refrained from adding to his own U.S. stock positions, emphasizing overseas markets instead.
That is what I am doing. ?Where I part ways with Shiller for now is that I am not pressing the panic button. ?Valuations are high, but not so high that I want to hedge or sell.
That’s all for now. ?This series of posts generates more questions than most, so feel free to ask away in the comments section, or send me an email. ?I will try to answer the best questions.
=========================
Late edit: changed bolded statement above from third to fourth quarter.
I recently received two sets of questions from readers. Here we go:
David,
I am a one-time financial professional now running a modest ?home office? operation in the GHI?area.? I have been reading your blog posts for a couple years now, and genuinely appreciate your efforts to bring accessible, thoughtful, and modestly stated insights to a space too often lacking all three characteristics.? If I didn?t enjoy your financial posts so much, I?d request that you bring your approach to the political arena ? but that?s a different discussion altogether?
I am writing today with two questions about your work on the elegant market valuation approach you?ve credited to @Jesse_Livermore.?? I apologize in advance for any naivety evidenced by my lack of statistical background?
I noticed that you constructed a ?homemade? total return index ? perhaps to get you data back to the 1950s.? Do you see any issue using SPXTR index (I see data back to 1986)?? The 10yr return r-squared appears to be above .91 vs. investor allocation variable since that date.
The most current Fed/FRED data is from Q32016.? It appears that the Q42016 data will be released early March (including perhaps ?re-available? data sets for each of required components http://research.stlouisfed.org/fred2/graph/?g=qis ).? While I appreciate that the metric is not necessarily intended as a short-term market timing device, I am curious whether you have any interim device(s) you use to estimate data ? especially as the latest data approaches 6 months in age & the market has moved significantly?
I appreciate your thoughts & especially your continued posts?
JJJ
These questions are about the Estimating Future Stock Returns posts. ?On question 1, I am pulling the data from Shiller’s data. ?I don’t have a better data feed, but that should be the S&P 500 data, or pretty near it. ?It goes all the way back to the start of the Z.1 series, and I would rather keep things consistent, then try to fuse two similar series.
As for question 2, Making adjustments for time elapsed from the end of the quarter is important, because the estimate is stale by 70-165 days or so. ?I treat it like a 10-year zero coupon bond and look at the return since the end of the quarter. ?I could be more exact than this, adjusting for the exact period?and dividends, but the surprise from the unknown change in investor behavior which is larger than any of the adjustment simplifications. ?I take the return since the end of the last reported quarter and divide by ten, and subtract it from my ten year return estimate. ?Simple, understandable, and usable, particularly when the adjustment only has to wait for 3 more months to be refreshed.
PS — don’t suggest that I write on politics. ?I annoy too many people with my comments on that already. 😉
Now for the next question:
I have a quick question. If an investor told you they wanted a 3% real return (i.e., return after inflation) on their investments, do you consider that conservative? Average? Aggressive? I was looking at some data and it seems on the conservative side.
EEE
Perhaps this should go in the “dirty secrets” bin. ?Many analyses get done using real return?statistics. ?I think those are bogus, because inflation and investment returns are weakly related when it comes to risk assets like stocks and any other investment with business risk, even in the long run. ?Cash and high-quality bonds are different. ?So are precious metals and commodities as a whole. ?Individual commodities that are not precious metals have returns that are weakly related to inflation. ?Their returns depend more on their individual pricing cycle than on inflation.
I’m happier projecting inflation and real bond returns, and after that, projecting the nominal returns using my models. ?I typically do scenarios rather than simulation?models because the simulations are too opaque, and I am skeptical that the historical relationships of the past are all that useful without careful handling.
Let’s answer this question to a first approximation, though. ?Start with the 10-year breakeven inflation rate which is around 2.0%. ?Add to that a 10-year average life modification of the Barclays’ Aggregate, which I estimate would yield about 3.0%. ?Then go the the stock model, which at 9/30/16 projected 6.37%/yr returns. ?The market is up 7.4% since then in price terms. ?Divide by ten and subtract, and we now project 5.6%/year returns.
So, stocks forecast 3.6% “real” returns, and bonds 1.0%/year returns over the next 10 years. ?To earn a 3% real return, you would have to invest 77% in stocks and 23% in 10-year high-quality bonds. ?That’s aggressive, but potentially achievable. ?The 3% real return is a point estimate — there is a lot of noise around it. ?Inflation can change sharply upward, or there could be a market panic near the end of the 10-year period. ?You might also need the money in the midst of a drawdown. ?There are many ways that a base scenario could go wrong.
You might say that using stocks and bonds only is too simple. ?I do that because I don’t trust return most risk and return estimates for more complex models, especially the correlation matrices. ?I know of three organizations that I think have good models — T. Rowe Price, Research Affiliates, and GMO. ?They look at asset returns like I do — asking what the non-speculative returns would be off of the underlying assets and starting there. ?I.e. if you bought and held them w/reinvestment of their cash flows, how much would the return be after ten years?
Earning 3% real returns is possible,?and not that absurd, but it is a little on the high side unless you like holding?77% in stocks and 23% in 10-year high-quality bonds, and can bear with the volatility.
My last post on this generated some good questions. ?I’m going to answer them here, because this model deserves a better explanation. ?Before I start, I should say that in order to understand the model, you need to read the first two articles in the series, which are?here:
If you are curious about the model, the information is there. ?It includes links to the main article at Economic Philosopher’s blog ( @jesselivermore on Twitter).
On to the questions:
Is this nominal or real return? Where can I find your original blog post explaining how you calculate future returns? Similar charts using Shiller PE, total market cap to gdp, q-ratio etc. all seem to imply much lower future returns.
This is a nominal return. ?In my opinion, returns and inflation should be forecast separately, because they have little to do with each other. ?Real interest rates?have a large impact on equity prices, inflation has a small impact that varies by sector.
This model also forecasts returns for the next ten years. ?If I had it do forecasts over shorter horizons, the forecasts would be lower, and less precise. ?The lower precision comes from the greater ease of forecasting an average than a single year. ?It would be lower because?the model has successively less power in forecasting each successive year — and that should make sense, as the further you get away from the current data, the less impact the data have. ?Once you get past year ten, other factors dominate?that this model does not account for — factors reflecting the long-term productivity of capital.
I can’t fully explain why this model is giving higher return levels, but I can tell you how the models are different:
This model focuses in investor behavior — how much are investors investing in stocks versus everything else. ?It doesn’t explicitly consider valuation.
The Shiller PE isn’t a well-thought-out model for many reasons. ?16 years ago I wrote an email to Ken Fisher where I listed a dozen flaws, some small and some large. ?That e-mail is lost, sadly. ?That said, let me be as fair as I can be — it attempts to compare the S&P 500 to trailing 10-year average earnings. ?SInce using a single year would be unsteady, the averaging is a way to compare a outdated smoothed income statement figure to the value of the index. ?Think of it as price-to-smoothed-earnings.
Market Cap to GDP does a sort of mismatch, and makes the assumption that public firms are representative of all firms. ?It also assumes that total payments to all factors are what matter for equities, rather than profits only. ?Think of it as a mismatched price-to-sales ratio.
Q-ratio compares the market value of equities and debt to the book value of the same. ?The original idea was to compare to replacement value, but book value is what is available. ?The question is whether it would be cheaper to buy or build the corporations. ?If it is cheaper to build, stocks are overvalued. ?Vice-versa if they are cheaper to buy. ?The grand challenge here is that book value may not represent replacement cost, and increasingly so because intellectual capital is an increasing part of the value of firms, and that is mostly not on the balance sheet. ?Think of a glorified Economic Value to Book Capital ratio.
What are the return drivers for your model? Do you assume mean reversion in (a) multiples and (b) margins?
Again, this model does not explicitly consider valuations or profitability. ?It is based off of the subjective judgments of people allocating their portfolios to equities or anything else. ?Of course, when the underlying ratio is high, it implies that people are attributing high valuations to equities relative to other assets, and vice-versa. ?But the estimate is implicit.
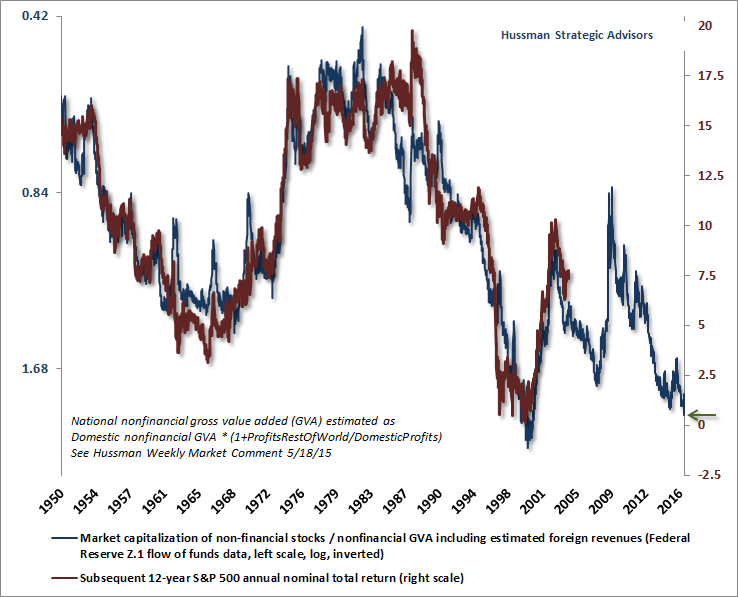
So?I?m wondering what the difference is between your algorithm for future returns and John Hussman?s algorithm for future returns. For history, up to the 10 year ago point, the two graphs look quite similar. However, for recent years within the 10-year span, the diverge quite substantially in absolute terms (although the shape of the ?curves? look quite similar). It appears that John?s algorithm takes into account the rise in the market during the 2005-2008 timeframe, and yours does not (as you stated, all else remaining the same, the higher the market is at any given point, the lower the expected future returns that can be for an economy). That results in shifting your expected future returns up by around 5% per year compared to his! That leads to remarkably different conclusions for the future.
Perhaps you have another blog post explaining your prediction algorithm that I have not seen. John has explained (and defended) his algorithm extensively. In absence of some explanation of the differences, I think that John?s is more credible at this point. See virtually any of his weekly posts for his chart, but the most recent should be at http://www.hussmanfunds.com/wmc/wmc161212e.png?(DJM: the article in question is here.)
I’d love to meet and talk with John Hussman. ?I have met some members of his small staff, and he lives about six miles from my house. ?(PS — Even more, I would like to meet @jesselivermore). ?The Baltimore CFA Society asked him to come speak to us a number of times, but we have been turned down.
Now, I’m not fully cognizant of everything he has written on the topic, but the particular method he is using now was first published on 5/18/2015. ?There is an article critiquing aspects of Dr. Hussman’s methods from Economic Philosopher. ?You can read EP for yourself, but I gain one significant thing from reading this — this isn’t Hussman’s first model on the topic. ?This means the current model has benefit of hindsight bias as he acted to modify the model to correct inadequacies. ?We sometimes call it a specification search. ?Try out a number of models and adjust until you get one that fits well. ?This doesn’t mean his model is wrong, but that the odds of it forecasting well in the future are lower because each model adjustment effectively relies on less data as the model gets “tuned” to eliminate past inaccuracies. ?Dr. Hussman has good reasons to adjust his models, because they have generally been too bearish, at least recently.
I don’t have much problem with his underlying theory, which looks like a modified version of Price-to-sales. ?It should be more comparable to the market cap to GDP model.
This model, to the best of my knowledge, has not been tweaked. ?It is still running on its first pass through the data. ?As such, I would give it more credibility.
There is another reason I would give it more credibility. ?You don’t have the same sort of tomfoolery going on now as was present during the dot-com bubble. ?There are some speculative enterprises today, yes, but they don’t make up as much of the total market capitalization.
All that said, this model does not tell you that the market can’t fall in 2017. ?It certainly could. ?But what it does tell you versus valuations in 1999-2000 is that if we do get a bear market, it likely wouldn’t be as severe, and would likely come back faster. ?This is not unique to this model, though. ?This is true for all of the models mentioned in this article.
Stock returns are probabilistic and mean-reverting (in a healthy economy with no war on your home soil, etc.). ?The returns for any given year are difficult to predict, and not tightly related to valuation, but the returns over a long period of time are easier to predict, and are affected by valuation more strongly. ?Why? ?The correction has to happen sometime, and the most likely year is next year when valuations are high, but the probability?of it happening in the 2017?are maybe 30-40%, not 80-100%.
If you’ve read me for a long time, you will know I almost always lean bearish. ?The objective is to become intelligent in the estimation of likely returns and odds. ?This model is just one of ones that I use, but I think it is the best one that I have. ?As such, if you look the model now, we should be Teddy Bears, not full-fledged Grizzlies.
That is my defense of the model for now. ?I am open to new data and interpretations, so once again feel free to leave comments.
[bctt tweet=”As such, if you look the model now, we should be Teddy Bears, not full-fledged Grizzly Bears.” username=”alephblog”]
Are you ready to earn 6%/year until 9/30/2026? ?The data from the Federal Reserve comes out with some delay. ?If I had it instantly at the close of the third quarter, I would have said 6.37% — but with the run-up in prices since then, the returns decline to 6.01%/year.
That puts us in the 82nd percentile of valuations, which isn’t low, but isn’t the nosebleed levels last seen in the dot-com era. ?There are many talking about how high valuations are, but investors have not responded in frenzy mode yet, where they overallocate stocks relative to bonds and other investments.
Think of it this way: as more people invest in equities, returns go up to those who owned previously, but go down for the new buyers. ?The businesses themselves throw off a certain rate of return evaluated at replacement cost, but when the price paid is far above replacement cost the return drops considerably even as the cash flows from the businesses do not change at all.
For me to get to a level where I would hedge my returns, we would be talking about?considerably higher levels where the market is discounting future returns of 3%/year — we don’t have that type of investor behavior yet.
One final note: sometimes I like to pick on the concept of Dow 36,000 because the authors didn’t get the concept of risk premia, or, margin of safety. ?They assumed the market could be priced to no margin of safety, and with high growth. ?That said, the model does offer a speculative prediction of Dow 36,000. ?It just happens to come around the year 2030.
Until next time, when we will actually have some estimates of post-election behavior… happy investing and remember margin of safety.
[bctt tweet=”Are you ready to earn 6%/year until 9/30/2026?” username=”alephblog”]
Now I’ve written at least one other article on this:?Numerator vs Denominator. ?(If you have time, it is a good summary article.) ?The basic idea is this: in the long-run stocks benefit from growth in the economy. ?In the short-run, growth in the economy can push up the demand for capital because new and existing businesses need investment, and the cost of capital rises as a result. ?Second, as the economy grows, sometimes resources other than capital are proven to be in short supply, e.g., labor and resources. ?GDP may grow, but in certain contexts, profits as a share of GDP can shrink, and the share going to wages, resources, and interest may grow.
I write this for a few?reasons:
It is by no means certain that the economy will grow more rapidly under President-elect Trump.
It is also not certain that profits will grow more rapidly.
Even if profits grow more rapidly, that does not guarantee that stock prices will rise.
There are often surprising second order effects when policies change.
After the election of Trump, the old economy stocks in portfolios that I manage for clients and me?did well, and the emerging market stocks did badly, aside from a Russian small cap ETF (which flew). ?At first I wondered about the emerging market stocks, but with rising interest rates in the US, the Volatility Machine kicked in, amplifying the effects of anticipated growth in demand capital in the US, and raised capital costs in the emerging markets, sending their stock prices down.
The same thing can happen to stocks in the US if there is enough demand for capital from the US Government to rebuild infrastructure. ?Let the US Government try to borrow more than $1 Trillion per year.? Watch interest rates rise, and watch stocks fall, as Government borrowing crowds out private investment.? On a related basis, higher interest rates make dividend-paying common and preferred stocks less attractive.
That doesn’t mean that the stocks supplying the needs of the government will do badly, but remember that the growth in demand for those goods and services might not persist. ?The prices of those stocks have already embedded higher growth rates into them — will the reality outcompete the expectations?
That’s the key question for all investors now and ever: reality versus expectations. ?Good investors make cold calculations of the expectations embedded in their investments versus likely reality, and as the situation changes, they keep adjusting.
That’s why I don’t think of the post-election period as a re-animation of “animal spirits.”? I do see it as?a rational response to likely changes. ?Does that mean that the likely changes are certain to happen? No. ?But it is likely for the economy and profits to grow faster in an environment where regulation is lower (for an example, consider the first term?of the Reagan Administration. ?It is also possible that interest rates could rise enough to erase the effect of higher profits on stock prices. ?Also, with a political neophyte in the White House, there could be significant volatility in all of the markets as the new President absorbs on-the-job training at our expense. ?Remember, volatility is risk in the short-run, but less so in the long-run. ?That can have a temporary effect on the prices of risky assets like stocks.
Permanent linear changes rarely happen in complex societies, so consider:
All sorts of things will get proposed, but what will get enacted?
Of what is enacted, will it have the expected effect?
Will there be other effects not presently expected, including a quick reversal or slowdown of policy changes because of public opinion changes and future electoral losses?
How will monetary policy react?
The election and its aftermath has not changed my investing plans in any major way. Tastes, demographics, and technology have not been radically altered. ?I am reacting to what the market is doing, but what is likely to get approved, and how regulatory efforts shift is likely to be moderate rather than revolutionary. ? Even if GDP grows faster, it is no guarantee of a rising stock market in the short run.
As such, my responses are?small, and I continue to watch and adjust.
This is my quarterly update on how much the market is likely to return over the next 10 years. ?At the end of the last quarter, that figure was around 6.54%/year. ?For comparison purposes, that is at the 77th percentile of outcomes — high, but not nosebleed high, which to me, is when the market is priced to?return 3% or less. ?That’s when you run.
Adding in quarter to date movements, the current value should be near 6.3%/year (79th percentile).
With all of the hoopla over how high the market is, why is this measure not screaming run? ?This is because average investors, retail and institutional, are not as heavily invested in the equity markets as is typical toward the end of bull markets. ?There are many articles calling for caution — I have issued a few as well.
From an asset-liability management standpoint, bull markets get particularly precarious when caution is thrown to the wind, and people genuinely believe that there is no alternative to stocks — that you are missing out on “free money” if you are not invested in stocks.
We aren’t there now. ?So, much as I am not crazy about the present state of the credit cycle (debts rising, income falling), there is still the reasonable possibility of more gains in the stock markets.
The Z.1 report came out yesterday, giving an important new data point to the analysis. ?After all, the most recent point gives the best read into current conditions. ?As of March 31st, 2016 the best estimate of 10-year returns on the S&P 500 is 6.74%/year.
The sharp-eyed reader will say, “Wait a minute! ?That’s higher than last time, and the market is higher also! ?What happened?!” ?Good question.
First, the market isn’t higher from 12/31/2015 to 3/31/2016 — it’s down about a percent, with dividends. ?But that would be enough to move the estimate on the return up maybe 0.10%. ?It moved up 0.64%, so where did the 0.54% come from?
The market climbs a wall of worry, and?the private sector has been holding less stock as a percentage of assets than before — the percentage?went from 37.6% to 37.1%, and the absolute amount fell by about $250 billion. ?Some stock gets eliminated by M&A for cash, some by buybacks, etc. ?The amount has been falling over?the last twelve months, while the amount in bonds, cash, and other assets keeps rising.
If you think that return on assets doesn’t vary that much over time, you would?conclude that having a smaller amount of stock owning the assets would lead to a higher rate of return on the stock. ?One year ago, the percentage the private sector held in stocks was 39.6%. ?A move down of 2.5% is pretty large, and moved the estimate for 10-year future returns from 4.98% to 6.74%.
Summary
As a result, I am a little less bearish. ?The valuations are above average, but they aren’t at levels that would lead to a severe crash. ?Take note, Palindrome.
Bear markets are always possible, but a big one is not likely here. ?Yes, this is the ordinarily bearish David Merkel writing. ?I’m not really a bull here, but I’m not changing my asset allocation which is 75% in risk assets.
Postscript for Nerds
One other thing affecting this calculation is the Federal Reserve revising estimates of assets other than stocks up prior to 1961. ?There are little adjustments in the last few years, but in percentage terms the adjustments prior to 1961 are huge, and drop the R-squared of the regression from 90% to 86%, which also is huge. ?I don’t know what the Fed’s statisticians are doing here, but I?am going to look into it, because it is?troubling to wonder if your data series is sound or not.
That said, the R-squared on this model is better than any alternative. ?Next time, if I get a chance, I will try to put a confidence interval on the estimate. ?Till then.


